



Lucid Group, Inc. stock plunged over 50% intraday on July 14 — from $5.51 to $2.37 — before closing at $4.62 on record volume. Bankruptcy rumors triggered a Nasdaq trading halt. Although Lucid dismissed the reports as false, the technical damage to LCID is now severe.
Summary
Key takeaways
- LCID crashed more than 50% intraday on July 14, hitting a low of $2.37 before closing at $4.62 on volume exceeding 155 million shares.
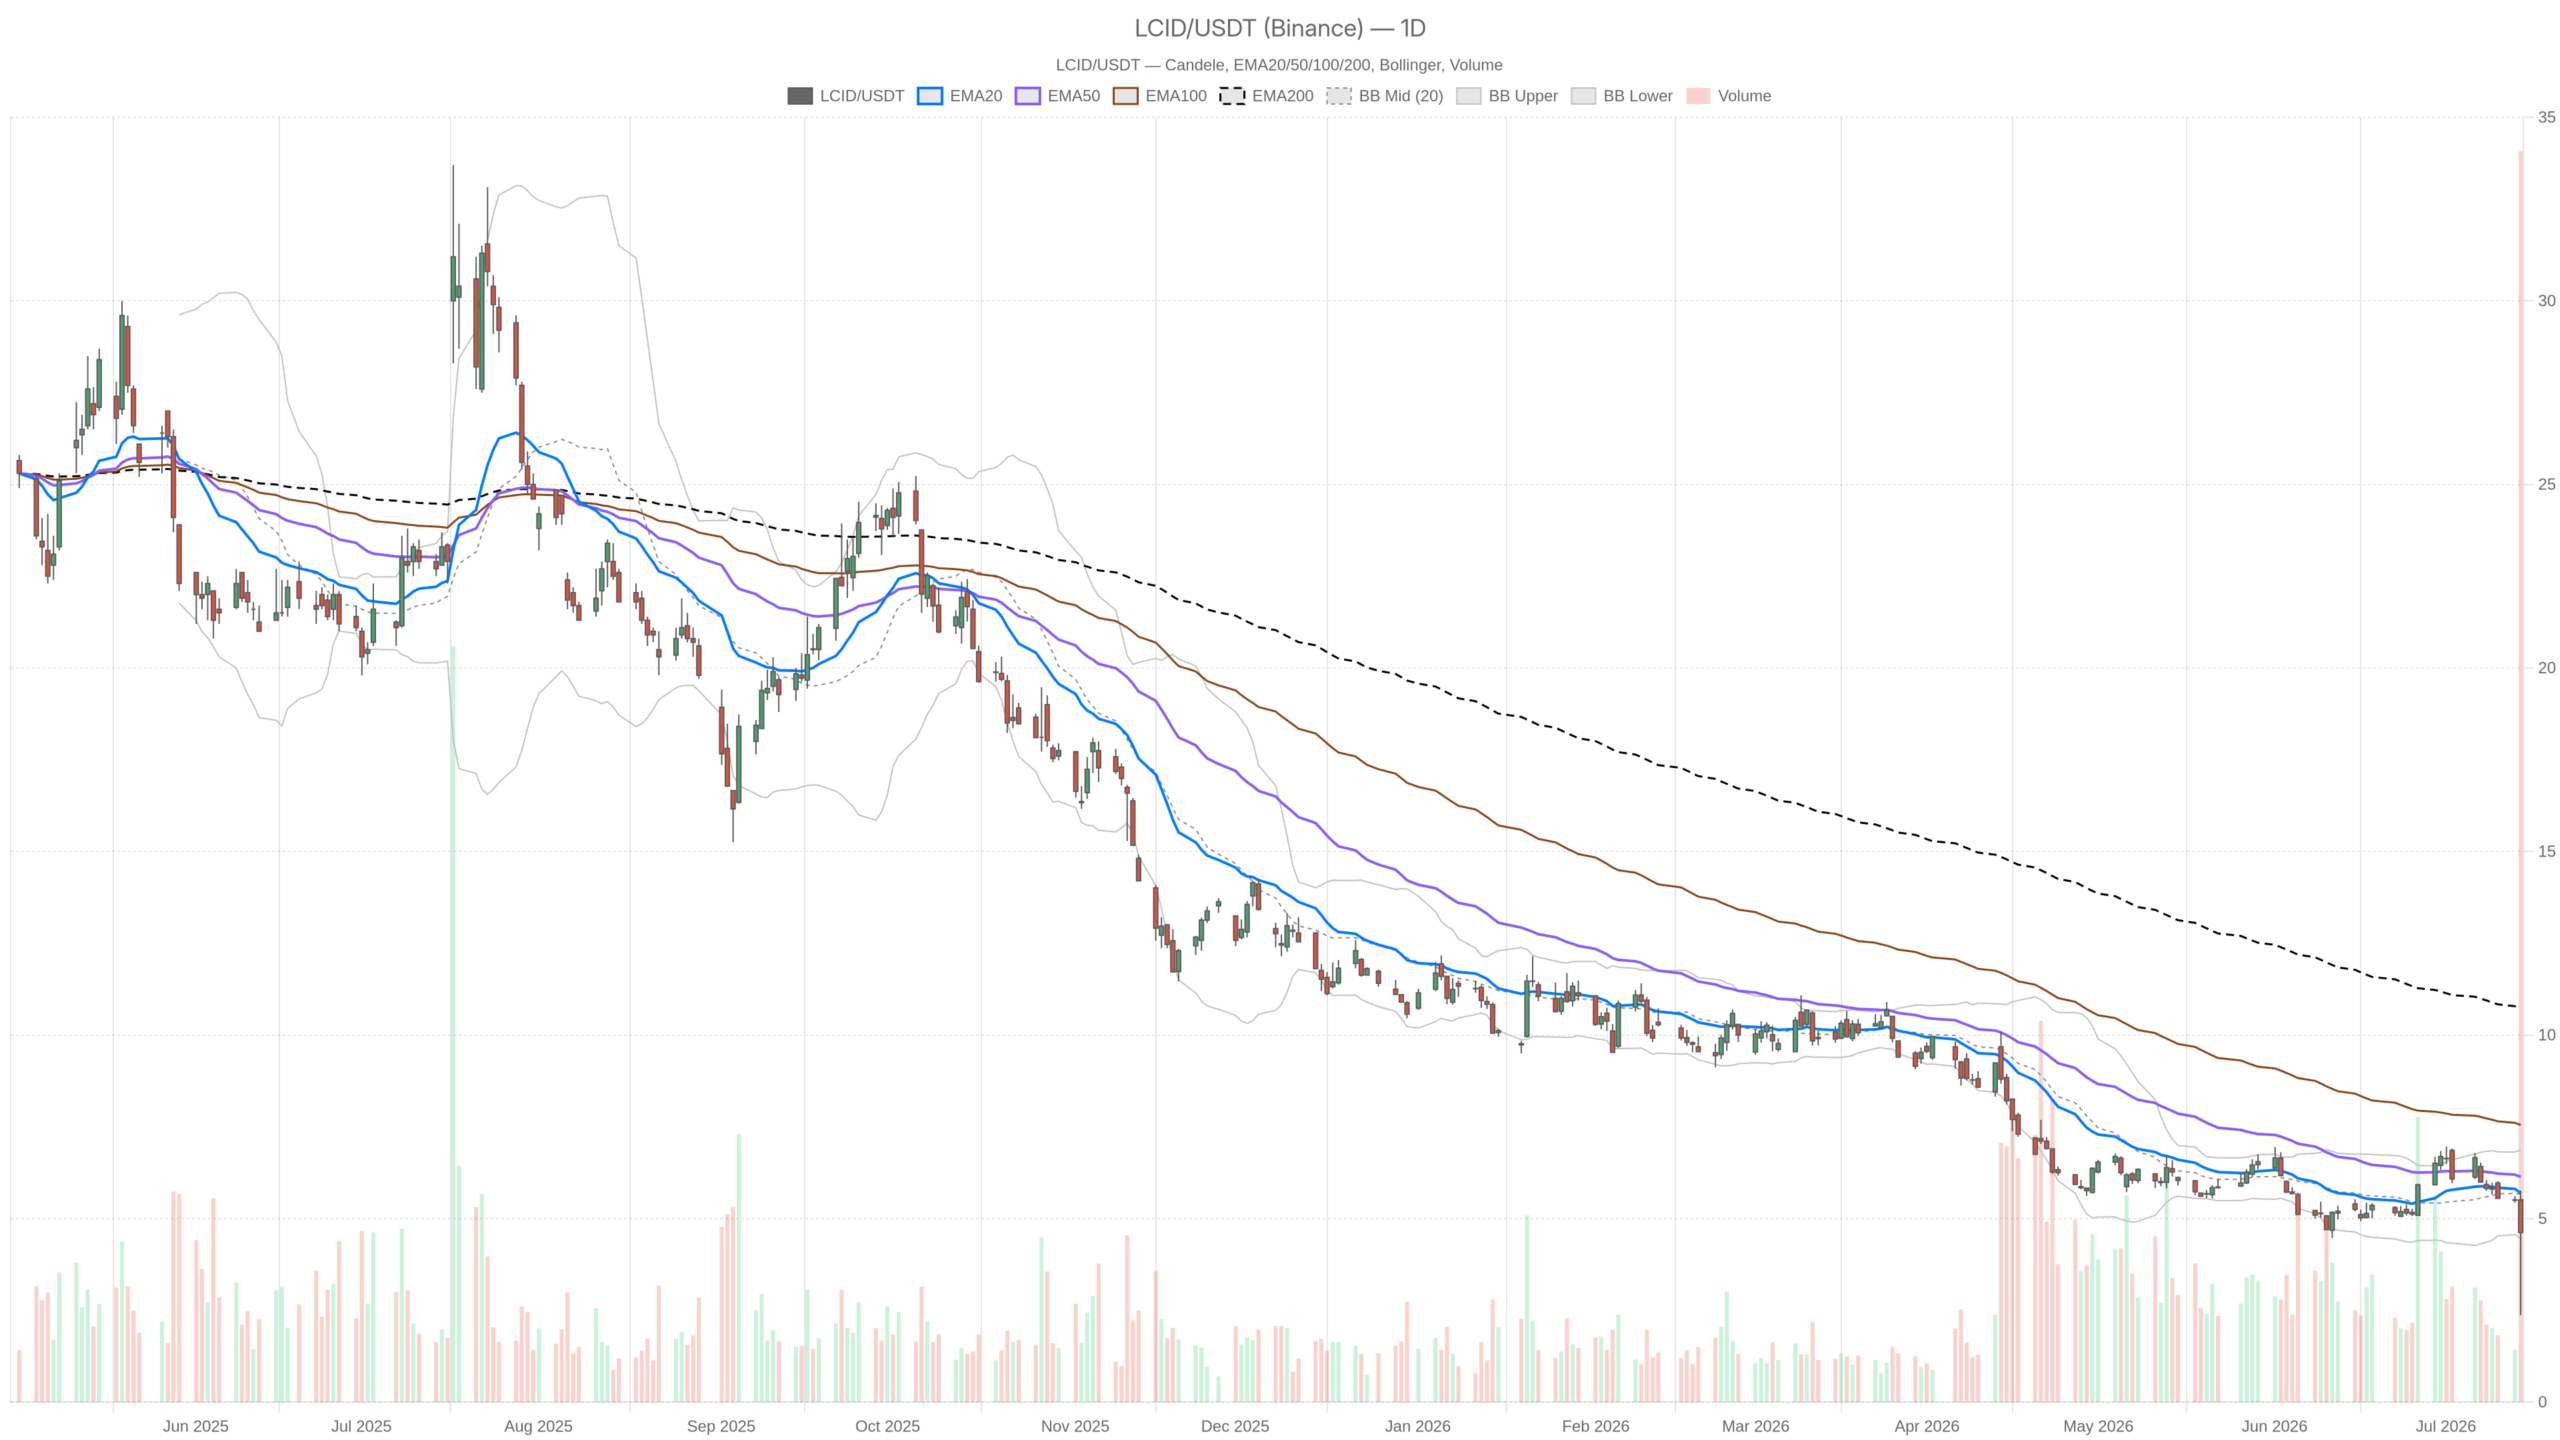
- The stock closed below all three daily EMAs — EMA20 at $5.70, EMA50 at $6.14, and EMA200 at $10.72 — confirming a deeply bearish structure.
- Daily RSI sits at 35.75 and MACD histogram reads -0.08, indicating persistent downside momentum without oversold relief.
- Lucid is reportedly working with a restructuring expert and may need additional capital to sustain operations through 2027.
- A bullish recovery requires a move above the daily EMA20 at $5.70; a break below S1 at $2.74 would signal further technical deterioration.
Lucid Group, Inc. Stock Faces Its Most Severe Test Yet
LCID has entered a crisis phase defined by collapsing price structure, bankruptcy fears, and fundamental uncertainty about its funding runway. The core issue goes beyond rumor. Lucid is reportedly working with a restructuring expert — a development rarely reassuring for a money-losing business carrying significant debt. Meanwhile, weak Q2 deliveries have added fuel to the fire. Despite recent capital infusions, analysts covering the stock note that LCID may need additional funding just to survive through 2027. That fundamental backdrop must inform every chart reading.
Daily Chart Signals Deep Structural Damage
The daily timeframe confirms an unambiguously bearish regime for Lucid Group, Inc. stock, with price closing well below all key moving averages. Price closed at $4.62 — beneath the EMA20 at $5.70, the EMA50 at $6.14, and the EMA200 at $10.72. All three moving averages are stacked in a descending sequence above price. This alignment reflects months of sustained selling pressure and does not emerge overnight.
Momentum Indicators Confirm Persistent Selling
The RSI on the daily sits at 35.75. It approaches oversold territory but has not reached it yet. Critically, an RSI near oversold in a downtrend does not automatically signal a reversal. It often signals that the selling is intense and persistent. Meanwhile, the MACD line stands at -0.09 against a signal of -0.01, producing a histogram of -0.08. The negative crossover and widening histogram confirm active downside momentum at the daily level.
Meanwhile, Bollinger Bands frame the extent of the damage. The lower band sits at $4.46, and yesterday’s intraday low of $2.37 briefly pierced far below that level before recovering. The close at $4.62 is just above the lower band. In isolation, that might hint at a short-term mean-reversion impulse. However, given the fundamental pressures at play, any bounce warrants extreme caution.
Notably, the daily ATR of $0.72 underscores the intense volatility. That figure will almost certainly reprice higher after yesterday’s extraordinary range of $3.39. Pivot analysis places the pivot point at $4.25, with R1 at $6.13 and S1 at $2.74. The $2.74 support level is now a key marker. It sits close to the session’s intraday low and represents the first major downside reference if selling resumes.
Hourly Timeframe Offers No Relief
The 1H chart reinforces the bearish bias across every indicator, with LCID showing accelerating negative momentum and no sign of buyer accumulation. Price closed at $4.62, sitting below all three hourly EMAs. The EMA20 reads $5.09, the EMA50 $5.53, and the EMA200 $5.71. The hourly regime is flagged as bearish, and the structure supports that label completely.
At the same time, hourly RSI at 42.25 is weak but not yet oversold. This implies there is still room to deteriorate before a technical floor forms. The MACD on the 1H is more concerning: the line at -0.41 versus a signal of -0.29 produces a histogram of -0.12. This shows accelerating negative momentum on the shorter timeframe. Sellers remain in control at every interval — this is not a setup where buyers are quietly accumulating.
Meanwhile, the hourly Bollinger Bands are notably wide. The upper band sits at $6.78 and the lower at $3.71, reflecting the spike in realized volatility. Pivot levels at this timeframe place R1 at just $4.75 and S1 at $4.52. R1 being barely above current price shows how compressed the upside is in the immediate term.
15-Minute Consolidation, Not Reversal
The 15-minute chart shows a momentary stabilization in LCID, but this is consolidation within a bearish structure — not evidence of a durable low. At this level, there is a flicker of relative stability. The regime is flagged as neutral, and the RSI has recovered to 48.45 — essentially mid-range. The MACD histogram has turned slightly positive at 0.09, suggesting the very short-term selling pressure has eased momentarily. Price closed at $4.62, precisely on the 15m pivot point.
However, the 15m EMA50 at $5.02 and EMA200 at $5.63 both sit well above price. Even at the micro level, the trend structure is bearish. This near-term steadying is best read as consolidation after a violent move. Traders watching this timeframe should note that any attempt to fade the intraday drop faces formidable resistance from overhead EMAs on all timeframes.
What a Bullish Turn Would Require
A credible bullish reversal for Lucid Group, Inc. stock demands both a fundamental catalyst and a technical recovery above the daily EMA20 at $5.70. First, the company would need to issue a definitive, substantiated denial of any restructuring process. This must go beyond a verbal dismissal. It requires tangible evidence that its liquidity position is secure beyond 2027. Second, a fresh capital raise or strategic investment announcement could provide a floor. Lucid has received capital infusions in the past, and its backing from major investors has historically acted as a stabilizer.
Technically, a recovery above the daily EMA20 at $5.70 would be the minimum requirement to shift the short-term bias. Above that, $6.13 — the R1 pivot level — represents the next meaningful hurdle. Absent a fundamental catalyst, however, a purely technical recovery from current levels would be fighting against significant structural headwinds.
Why the Bearish Case Holds the Advantage
The bearish scenario remains the path of least resistance for Lucid Group, Inc. stock. The next major support sits at the daily S1 level of $2.74. If restructuring conversations are more advanced than disclosed, LCID could revisit the intraday low near $2.37. Worsening Q2 delivery numbers would only compound that risk. A break below the daily S1 at $2.74 would represent a significant technical deterioration and would likely amplify institutional selling.
Furthermore, the EMA200 on the daily at $10.72 is so far removed from current price that it offers no practical support reference in the near term. The stock has been in structural decline for an extended period. The events of July 14 have accelerated that trend dramatically. The broad EV sector context does not help either. Rivian saw its price target raised by an analyst while maintaining an Underweight rating, suggesting the entire space remains under scrutiny.
Volatility, Positioning, and the Weight of Uncertainty
Lucid Group, Inc. stock is now caught in a uniquely dangerous combination of fundamental doubt, collapsed technical structure, and extreme volatility. Overall, the daily ATR alone — before yesterday’s historic range is fully absorbed — points to a highly unstable environment. Price swings of a dollar or more in either direction are entirely plausible on any given session. That is not a setup that rewards impulsive positioning.
In summary, the bears hold the structural advantage at every timeframe that matters. Any recovery attempt will face resistance from a dense stack of EMAs above current price. Until Lucid provides concrete clarity on its financial path, the risk profile of this stock remains skewed heavily to the downside. That clarity must also be reflected in a genuine stabilization of price and volume. This is not financial advice; it is a reading of the evidence as it stands.
FAQ
Is Lucid Group going bankrupt?
Based on official statements from the company, no. Lucid called the bankruptcy rumors “completely false.” However, the company is reportedly working with a restructuring expert — a fact that has kept market anxiety elevated and fueled continued selling pressure in LCID shares.
What caused the LCID stock crash on July 14?
Bankruptcy rumors triggered an aggressive selloff that briefly halted Nasdaq trading. LCID shares fell more than 50% intraday, from an open of $5.51 to a low of $2.37, before recovering to close at $4.62 on volume exceeding 155 million shares.
What are the key technical levels to watch for Lucid Group, Inc. stock?
Key support sits at $2.74 (daily S1), near the July 14 intraday low of $2.37. On the upside, resistance stands at the daily EMA20 of $5.70, followed by the R1 pivot at $6.13. The daily EMA200 at $10.72 remains structurally distant and offers no practical near-term reference.
Does Lucid need more funding to survive?
Analysts covering the stock have noted that LCID may need additional capital infusions to sustain operations through 2027. Despite past capital raises and backing from major investors, the company’s cash burn rate remains a central concern for the market.
Disclaimer: This article is for informational purposes only and does not constitute financial advice, an investment recommendation, or a solicitation to buy or sell any financial instrument or cryptocurrency. The analysis provided is not indicative of future results. Investing in crypto assets and financial markets carries a high risk of capital loss. Always do your own research (DYOR) and consult a qualified financial advisor before making any decision.
Article produced with the assistance of artificial intelligence and reviewed by the editorial team.
