



As of July 15, 2026, the broader crypto market shows a modest recovery even as sentiment stays trapped in extreme fear. Solana crypto trades at $77.69 USDT — a price that looks quiet but sits at the intersection of competing forces that make the next move genuinely consequential.
Summary
Key takeaways
- SOL trades at $77.69, with the daily EMA200 at $97.83 acting as the critical long-term resistance roughly 26% above current price.
- The Fear & Greed Index sits at 25, signaling extreme fear even as broader crypto markets post a modest recovery.
- Daily RSI at 53.11 and a stalled MACD crossover reflect neutral momentum with no clear directional conviction.
- The 1-hour Bollinger Bands have compressed to just 1.5% wide, signaling an imminent sharp move in either direction.
- Bitcoin dominance at 56.32% continues to limit altcoin rotation, keeping SOL in a wait-and-see structure.
The Daily Picture: Under the Shadow of the 200 EMA
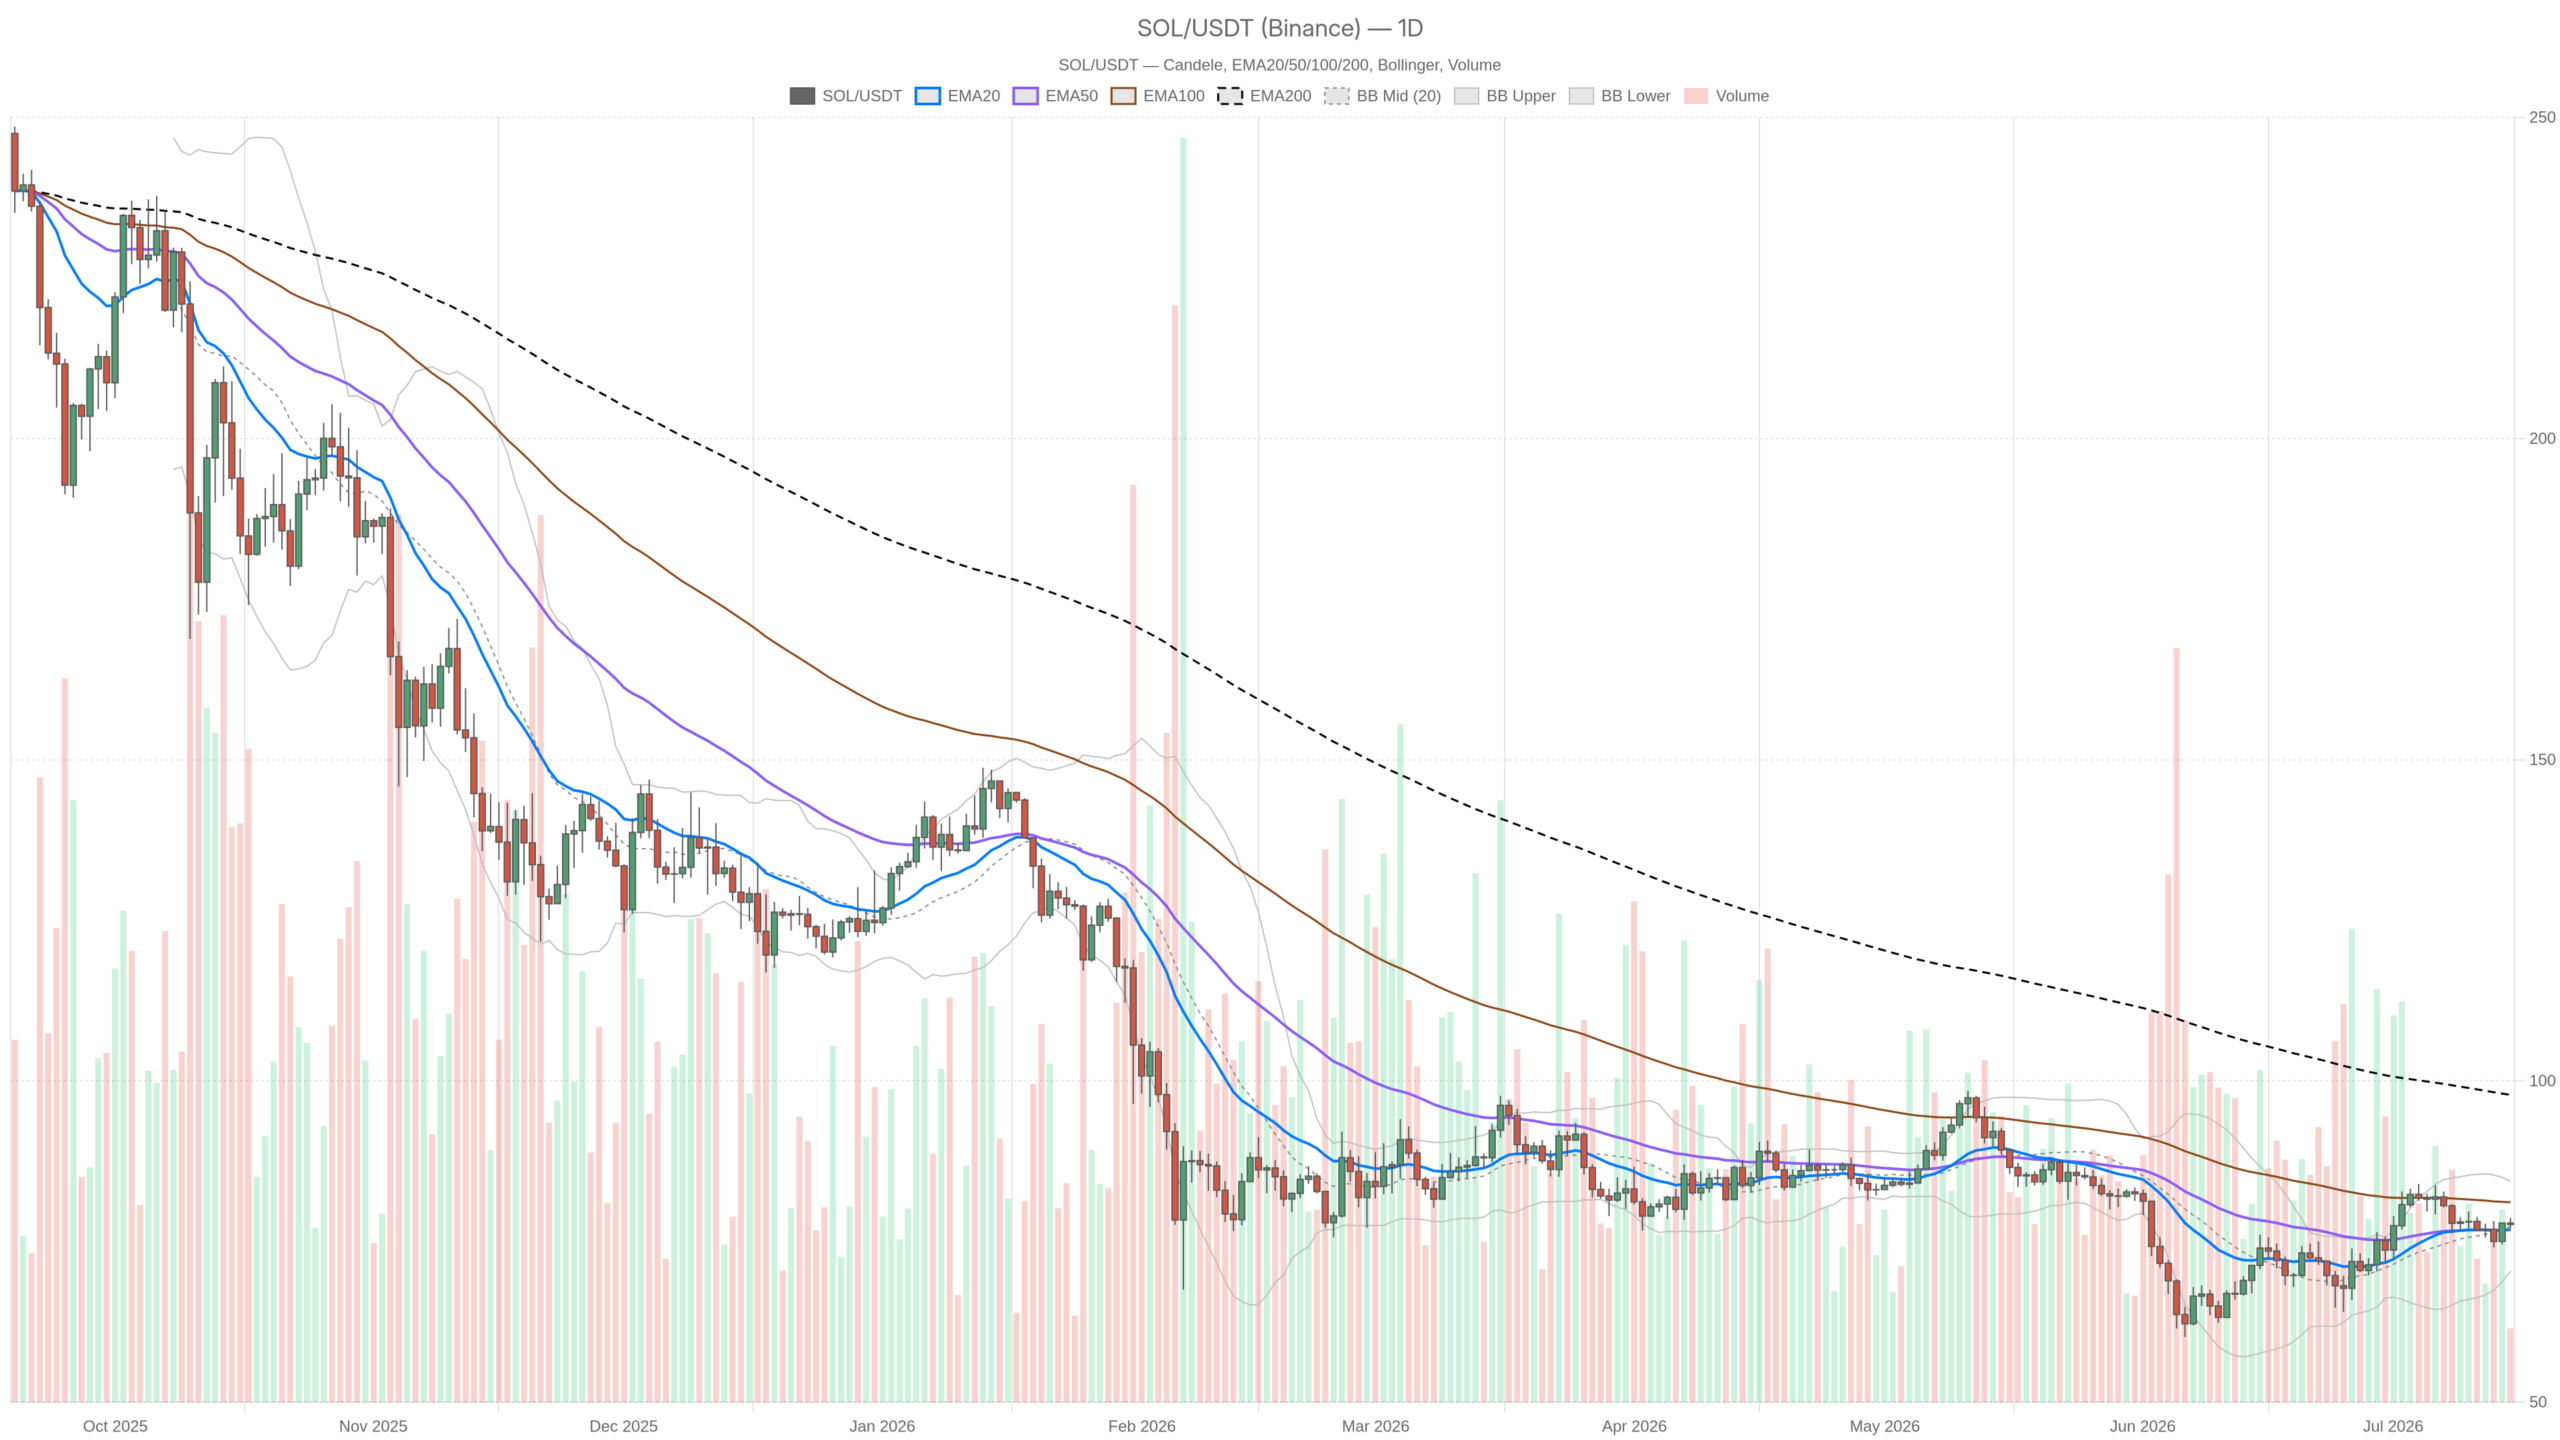
The daily timeframe confirms SOL remains in a recovery phase within a longer-term bear structure. Price closed at $77.69, sitting just above the daily EMA20 at $76.86 and EMA50 at $76.80 — two moving averages converging at essentially the same level. However, the EMA200 at $97.83 looms roughly 26% above current price, and until SOL reclaims that threshold, any bullish narrative carries a clear asterisk.
Meanwhile, the daily RSI at 53.11 sits in the middle of the range — neither oversold nor overbought, simply drifting. The MACD reinforces this hesitation: the MACD line at 0.94 is above zero, which leans technically bullish, but the signal line at 1.22 remains ahead, producing a negative histogram of -0.28. Momentum improved, then stalled, and that stall is what makes the current zone particularly tricky.
Moreover, Bollinger Bands show price trading just above the midline at $77.37, with the upper band at $84.35 and the lower band at $70.38. SOL is coiling near the midpoint, suggesting no imminent squeeze — though this middle-band position often precedes a directional resolution. The daily ATR of $3.12 means typical swings are wide enough to shake out weak hands. The pivot point sits at $77.80, with R1 at $78.57 and S1 at $76.90 — price is pinned between these two levels right now.
Hourly Compression: A Market Waiting for Direction
Shifting to the 1-hour chart, the picture sharpens into a very tight range. Price at $77.69 hovers just above the hourly EMA50 at $76.88, while the EMA200 sits at $77.75 — essentially at current price. SOL is trading right at its own mean, which is about as indecisive as a chart gets. The hourly RSI at 57.83 leans slightly constructive without being aggressive, and the MACD histogram at -0.06 is barely negative, confirming momentum is winding down rather than expanding.
That said, the Bollinger Bands on the 1H have compressed between $76.93 and $78.15 — a zone just 1.5% wide. This kind of compression always resolves eventually, and the resolution tends to be sharp. The 1H EMA20 at $77.37 holds below price, offering mild short-term support, but the EMA200 at $77.75 acting as overhead resistance keeps any pop contained. Until SOL closes a 1H candle meaningfully above $77.75, the path of least resistance remains sideways.
On-Chain Activity Reveals Mixed Signals
One area where the outlook for Solana crypto becomes more nuanced is on-chain activity. Data from DefiLlama paints a mixed picture across the ecosystem. Raydium AMM has accumulated significant all-time fees, yet its 7-day change is down 21.74%, pointing to declining short-term activity. PumpSwap posted a notable 26.93% spike in daily fees but dropped 55.27% over seven days — the kind of erratic data that reflects speculative micro-cap activity more than sustained network health.
In contrast, Orca DEX stands out with a 27.86% improvement in 30-day fees, suggesting stickier liquidity activity, though its weekly numbers are also lower. The overall read is clear: Solana’s DeFi layer remains active, but volume is cooling from recent peaks. That is not catastrophic, but it reduces one potential catalyst for a near-term price re-rating.
Bullish and Bearish Scenarios
For bulls, the constructive outline exists. Price holds above both the EMA20 and EMA50 on the daily. The daily RSI has not broken down, and the Bollinger midline acts as mild support. The 15-minute regime is actually classified as bullish, with price above all three EMAs on that frame. A clean break above $77.78 — the hourly R1 — would open the immediate target of the daily R1 at $78.57, with a stretch toward the daily Bollinger upper band at $84.35 as the more ambitious scenario.
However, the bearish case should not be dismissed. The EMA200 at $97.83 remains a reminder that SOL has not recovered from a major structural breakdown. The daily MACD signal still outpacing the MACD line confirms momentum deceleration preceded this pause. Furthermore, with Fear & Greed at 25 and Bitcoin dominance holding at 56.32%, the macro setup still favors defensive positioning over altcoin accumulation. A breakdown below the 1H Bollinger lower band at $76.93 would trigger a retest of the daily S1 at $76.90 almost immediately.
Positioning in This Environment
The honest assessment is that SOL sits in no man’s land — above short-term support, far below long-term resistance, with deeply fearful sentiment and neutral structure across both key timeframes. The cluster of EMA20 and EMA50 around $76.80 to $76.86 is the line in the sand on the downside; a decisive hourly close above $77.75 is the line on the upside. Anyone already in a position has a clear decision tree based on these levels.
For those watching from the sidelines, the Bollinger compression on the 1H signals a move is coming. In an Extreme Fear environment with Bitcoin hoarding dominance, the burden of proof sits with the bulls. DeFi activity on Solana is not deteriorating catastrophically, but it is not accelerating either. Volatility, as measured by the daily ATR of $3.12, remains real — this is not a market where tight stops survive without conviction. Position sizing and patience matter more than the direction of the next trade.
FAQ
What is the key support level for Solana right now?
The critical support zone lies between $76.80 and $76.86, where the daily EMA50 and EMA20 converge. A daily close below this cluster would shift the short-term structure from recovery to rollover, opening the path toward the daily S1 at $76.90 and ultimately toward the daily Bollinger lower band at $70.38.
Why is the EMA200 at $97.83 so important for SOL’s outlook?
The daily EMA200 sits roughly 26% above the current price of $77.69. Until SOL reclaims this level, any bullish narrative remains unconfirmed — the EMA200 represents the dividing line between a recovery within a bear structure and a genuine trend reversal.
Is Solana’s DeFi activity growing or declining?
The picture is mixed. Raydium’s 7-day fees are down 21.74% and PumpSwap’s weekly volume dropped 55.27%, though Orca DEX posted a 27.86% improvement in 30-day fees. Overall, on-chain volume is cooling from recent peaks, reducing a potential catalyst for near-term price appreciation.
What does the Fear & Greed Index at 25 signal for SOL?
An index reading of 25 indicates Extreme Fear, which historically can precede both sharp reversals and further declines. Combined with elevated Bitcoin dominance at 56.32%, it suggests capital remains defensive and has not yet rotated into altcoins like Solana.
Disclaimer: This article is for informational purposes only and does not constitute financial advice, an investment recommendation, or a solicitation to buy or sell any financial instrument or cryptocurrency. The analysis provided is not indicative of future results. Investing in crypto assets and financial markets carries a high risk of capital loss. Always do your own research (DYOR) and consult a qualified financial advisor before making any decision.
Article produced with the assistance of artificial intelligence and reviewed by the editorial team.
