




Lucid Stock is at a crossroads. LCID surged roughly 20% on a new executive team announcement, then pulled back on a Q2 delivery miss, closing July 6 at $6.66. The daily picture leans cautiously constructive, but the story is more nuanced than a simple breakout.
Summary
Key takeaways
- Lucid Stock surged roughly 20% on a new executive team announcement before pulling back on a Q2 delivery miss.
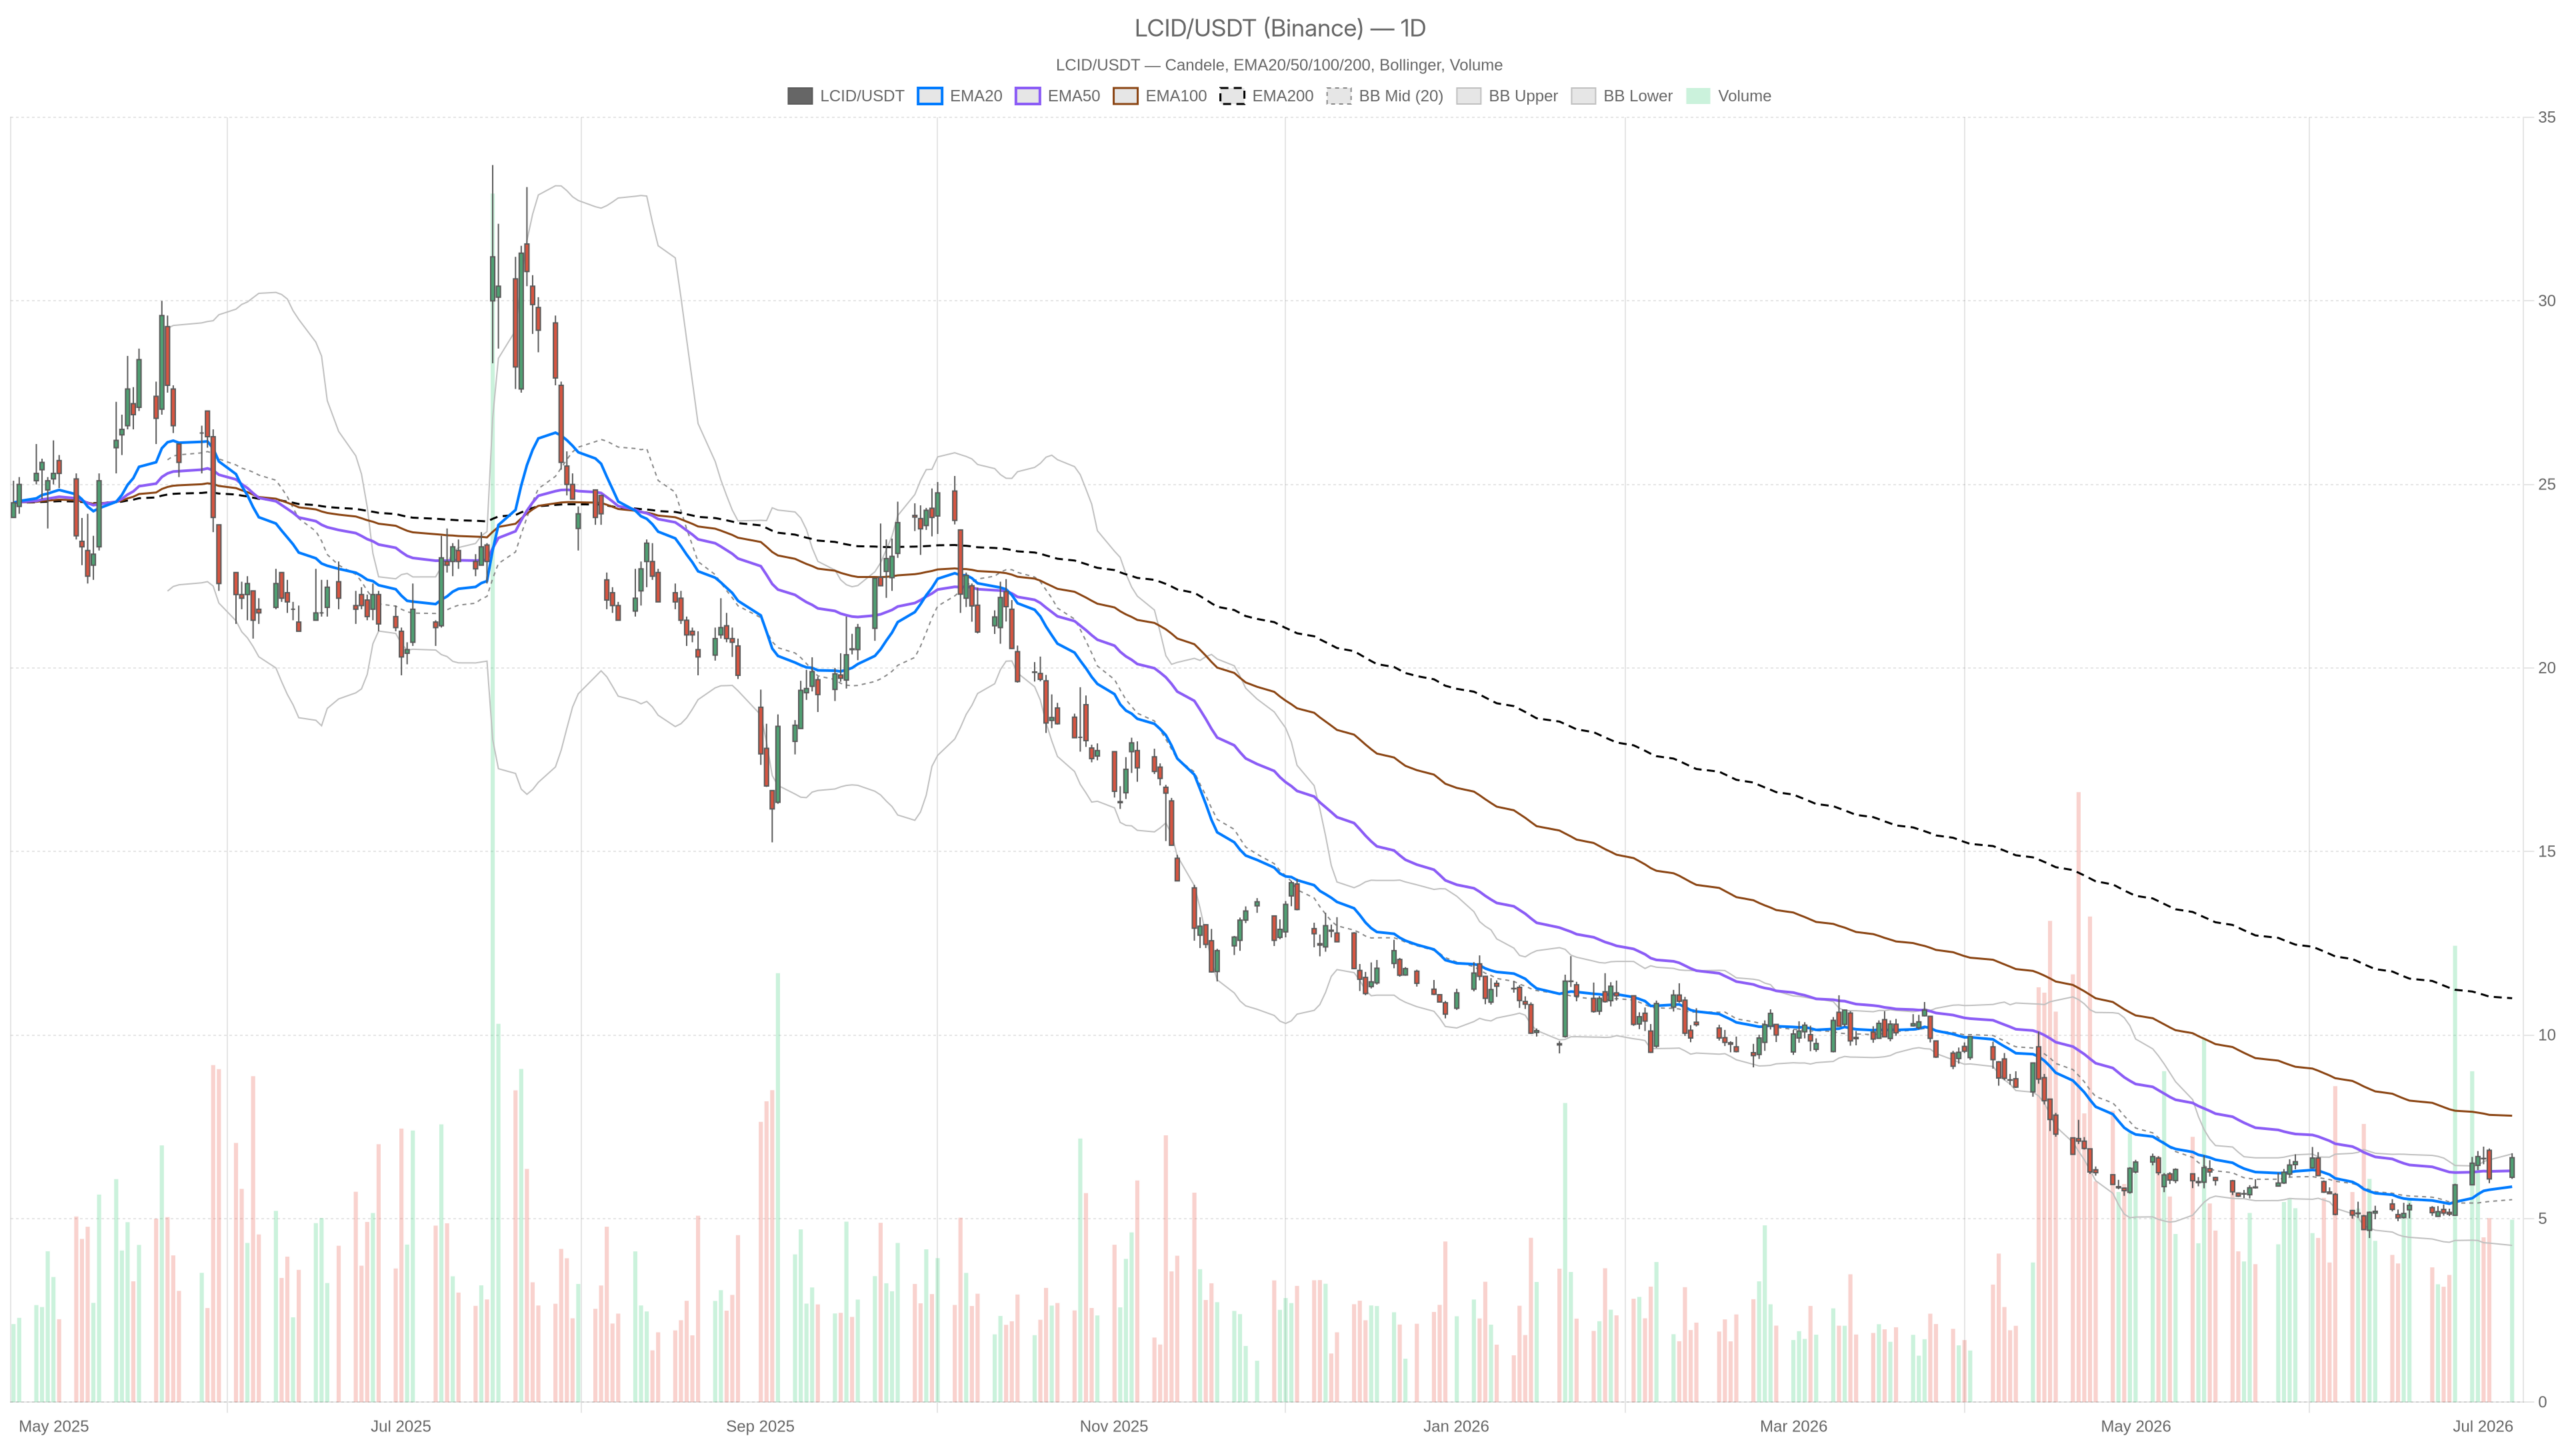
- LCID closed July 6 at $6.66, above the EMA20 ($5.87) and EMA50 ($6.30) but far below the EMA200 at $11.00.
- Daily MACD histogram is expanding positively at $0.20, with RSI14 at 60.75 — room to run before overbought.
- Baird reiterated a Neutral rating with a $6 price target, placing Lucid Stock roughly 11% above current analyst expectations.
- California passed EV incentive legislation excluding Tesla, positioning Lucid as a direct beneficiary.
Lucid Stock Daily Bias: Neutral Regime With Emerging Bullish Momentum
Lucid Stock’s daily bias is neutral with emerging bullish momentum. Price closed above short-term moving averages, yet the long-term trend remains deeply damaged.
LCID’s daily timeframe is officially flagged as neutral, and that classification is honest. The stock closed the July 6 session at $6.66, carving out a daily range between $6.08 and $6.78. Price is comfortably above the EMA20 at $5.87 and the EMA50 at $6.30 — a short-term structural positive. However, the EMA200 sits at $11.00, a sobering reminder of how deep the longer-term damage runs.
MACD and RSI Signal Genuine Momentum
The daily MACD is one of the more encouraging signals. The MACD line at $0.13 has crossed above the signal line at -$0.08, producing a histogram reading of $0.20. That kind of positive histogram expansion reflects genuine short-term momentum building — not a false start. Meanwhile, the RSI14 at 60.75 sits in constructive territory. It is elevated enough to confirm buying pressure without yet reaching overbought extremes. This leaves room for further upside before a technical ceiling appears.
Bollinger Bands and Pivots Frame the Resistance Zone
Bollinger Bands add important context. The upper band on the daily is at $6.76, and the July 6 high printed at $6.78. Price briefly pierced the upper band before pulling back to close at $6.66. That kind of intraday probe and retracement is a common pattern near short-term resistance. It does not invalidate the move, but it does suggest Lucid Stock is not yet powering through resistance with conviction. The daily ATR14 of $0.49 indicates a fairly volatile environment — meaningful daily swings are the norm, not the exception.
Pivot analysis reinforces this read. The daily pivot point sits at $6.51, with R1 at $6.93 and S1 at $6.23. The close at $6.66 sits between the pivot and R1. This position typically favors bulls on a continuation basis. However, it leaves R1 as the next real test before any breakout can be confirmed.
Hourly and 15-Minute Signals Support Near-Term Positioning
Intraday charts confirm a bullish alignment for Lucid Stock, though momentum is thinning. The 1H and 15-minute timeframes both show price above key moving averages.
On the 1H timeframe, the regime shifts to explicitly bullish. Price is above the EMA20 at $6.45, the EMA50 at $6.19, and even the EMA200 at $5.83. That full EMA stack alignment is a meaningful short-term confirmation. The hourly RSI14 at 60.66 mirrors the daily reading almost exactly — consistent momentum, not divergence. However, the MACD histogram on the 1H is a slim $0.02. This signals that the intraday move is thinning out. Momentum exists, but is not accelerating further at this hour.
The 1H Bollinger upper band at $7.03 gives some breathing room before the next band-level resistance. The hourly pivot structure is tight: PP at $6.68, R1 at $6.73, S1 at $6.61. The July 6 close of $6.66 sits essentially at the hourly pivot — a neutral micro-position. Bulls need a clean break above $6.73 to signal the next leg.
The 15-minute frame offers execution context rather than directional conviction. The regime reads bullish here too, with price above all three EMAs. Notably, the 15m MACD histogram is at exactly zero — the line and signal are both at $0.10. That signals consolidation, not breakdown. The 15m Bollinger mid is $6.58, with the upper band at $6.80. A $0.08 ATR on the 15m confirms near-term volatility is compressed. Lucid Stock is essentially coiling in the $6.62–$6.72 zone, waiting for a catalyst.
Lucid Stock Fundamental Backdrop: A New Team, an Old Problem
Lucid Stock’s fundamental picture is split between a promising leadership overhaul and a disappointing Q2 delivery miss. California’s new EV incentives add a demand-side tailwind, but analysts remain skeptical.
The technical setup does not exist in a vacuum. Earlier this week, Lucid announced a major leadership overhaul alongside a new turnaround plan. The initial reaction was a 20% surge in LCID. Then came the Q2 delivery data — and the stock shed 8.2% in a single session after deliveries missed analyst expectations. That sequence defines the core tension in this name right now.
On the positive side, California passed new EV incentive legislation specifically benefiting first-time buyers. The program pointedly excludes Tesla, positioning Lucid and Rivian as direct beneficiaries. That is a genuine demand-side catalyst for a company that has struggled to scale volume. However, Baird on July 6 reiterated its Neutral rating on Lucid Stock with a $6 price target — directly citing the Q2 miss. With LCID trading at $6.66, the stock is already roughly 11% above that target. Analysts are not chasing this move.
In contrast to the skeptical analyst community, a Motley Fool comparison piece from July 3 noted that while both Rivian and Lucid face difficult battles, Rivian is seen as having the stronger strategic footing. That relative positioning matters for institutional capital allocation decisions.
Bullish Scenario: Momentum Continues Into $6.93
The bullish case for Lucid Stock targets a move above the daily R1 at $6.93. Expanding MACD momentum and genuine demand-side catalysts support this scenario.
The bullish case rests on several aligned factors. Daily MACD momentum is genuinely positive and expanding. The RSI at 60.75 has room to run toward 70 without hitting extreme territory. A close above the daily R1 at $6.93 would be a material technical signal. The California EV incentive news provides a real-world demand narrative to support any momentum continuation.
Furthermore, if the new executive team’s turnaround plan gains credibility in upcoming communications, sentiment could shift more durably. The 1H and 15m bullish regimes confirm that institutional buyers have not stepped away from the recent breakout level. Any hold above the daily pivot at $6.51 on a pullback keeps the structure intact.
Bearish Scenario: Q2 Miss Caps the Rally
The bearish case for Lucid Stock is anchored by the Q2 delivery miss and Baird’s $6 price target. That target sits roughly 10% below the current price.
A Q2 delivery miss is a hard fundamental fact that does not disappear because the stock rallied. If further details of the Q2 shortfall emerge, or if the new leadership team fails to articulate a credible path to production growth, the post-announcement rally could fully unwind.
Technically, a failure to clear the daily R1 at $6.93 combined with a close below the daily S1 at $6.23 would invalidate the current bullish momentum setup. The EMA200 at $11.00 stands as a reminder that Lucid Stock remains in a long-term downtrend. Any sustained move back below the EMA50 at $6.30 would signal that bulls have lost control of the near-term narrative.
Positioning Into Uncertainty
Lucid Stock offers a technically constructive short-term setup inside a damaged long-term trend. Directional conviction requires a confirmed break above $6.93 or below $6.23.
Overall, Lucid Stock presents a technically constructive short-term setup sitting inside a deeply damaged long-term trend. The daily momentum signals are real, the California incentive tailwind is tangible, and the short-term EMA structure is aligned in bulls’ favor. At the same time, the stock is already trading above a top analyst’s price target. Volatility remains elevated at a daily ATR of $0.49, and the fundamental delivery miss has not been resolved. The 15-minute consolidation near $6.66 reflects a market pausing to decide which story wins. Directional conviction requires either a confirmed break above $6.93 on the upside or a breach of $6.23 support on the downside. Until then, LCID remains a high-volatility, high-uncertainty trade where position sizing matters as much as direction.
FAQ
Why did Lucid Stock rally and then pull back in early July?
Lucid Stock surged roughly 20% on news of a new executive team and turnaround plan, then shed 8.2% in a single session after Q2 deliveries missed analyst expectations.
What is the key resistance level for LCID right now?
The daily R1 pivot at $6.93 is the immediate resistance. A confirmed close above that level would be a material bullish signal for Lucid Stock.
What is Baird’s rating and price target for Lucid Stock?
Baird reiterated a Neutral rating on Lucid Stock with a $6 price target, citing the Q2 delivery miss. LCID currently trades roughly 11% above that target.
What support levels should Lucid Stock traders watch?
The daily pivot at $6.51 and S1 at $6.23 are the key supports. A close below $6.23 would invalidate the current bullish momentum setup.
Disclaimer: This article is for informational purposes only and does not constitute financial advice, an investment recommendation, or a solicitation to buy or sell any financial instrument or cryptocurrency. The analysis provided is not indicative of future results. Investing in crypto assets and financial markets carries a high risk of capital loss. Always do your own research (DYOR) and consult a qualified financial advisor before making any decision.
Article produced with the assistance of artificial intelligence and reviewed by the editorial team.
