




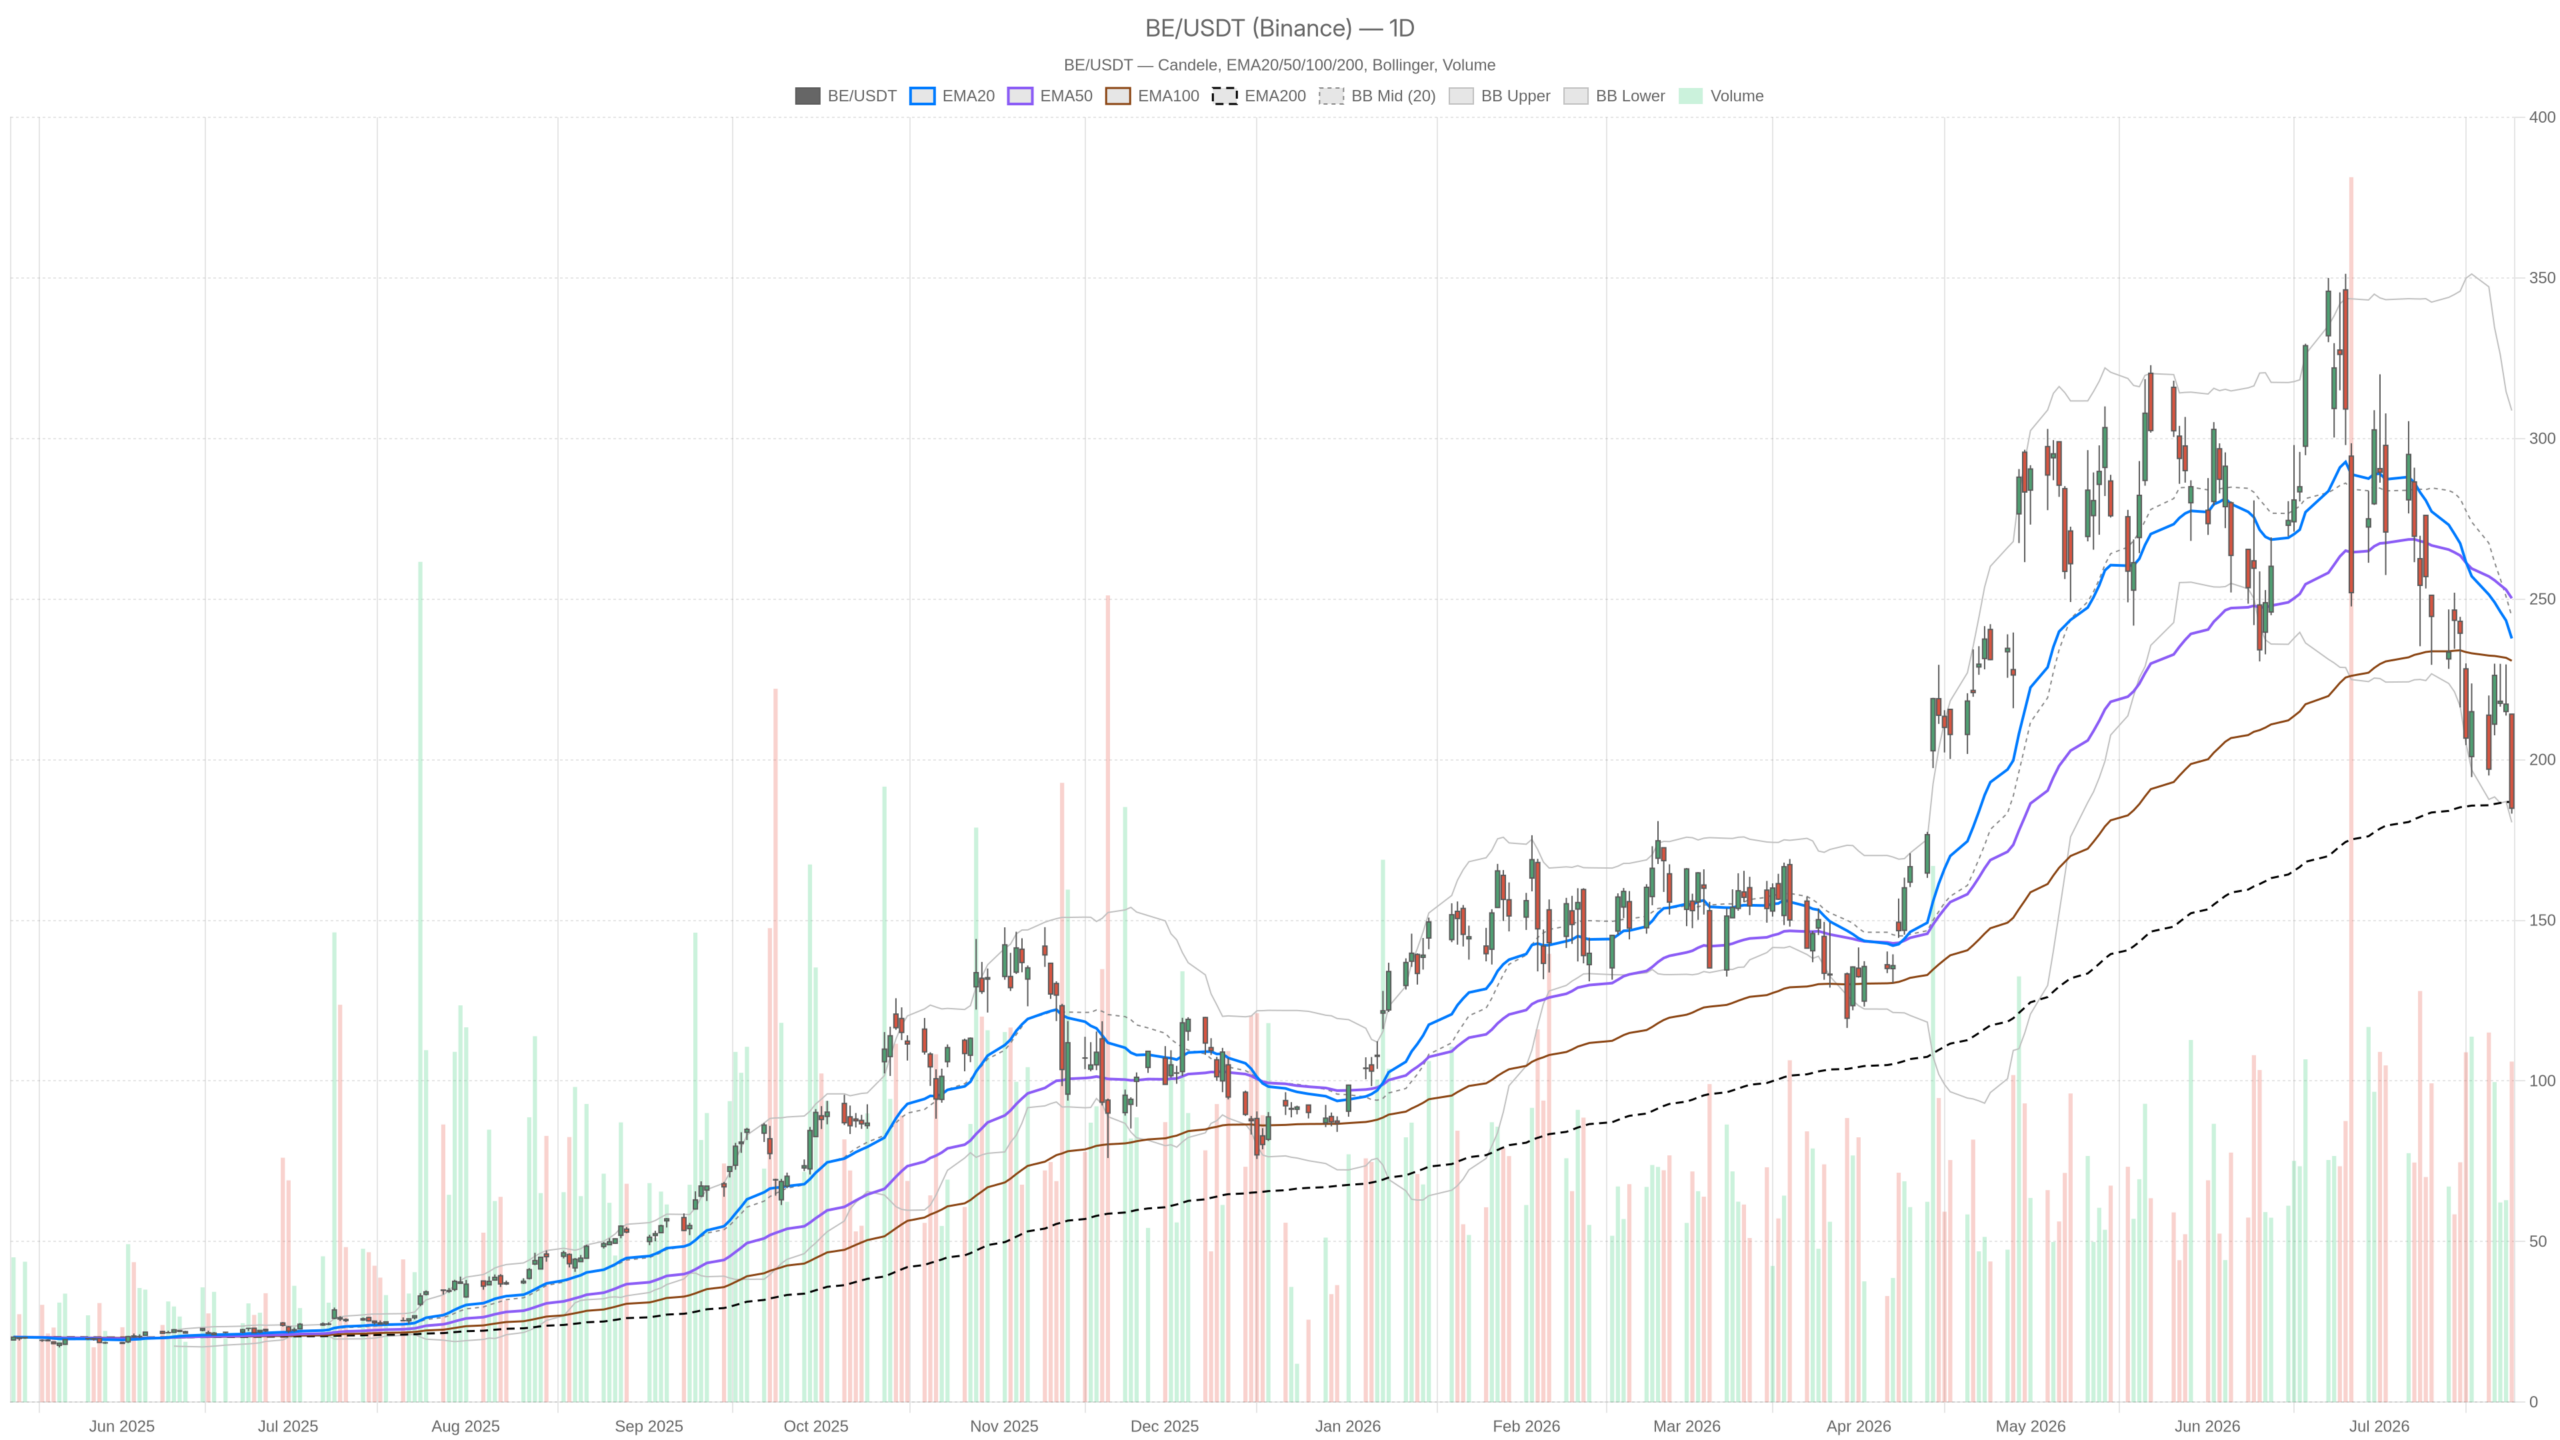
Bloom Energy Stock closed at $184.89 on July 24 after shedding 43% in a single month. The technical picture is unambiguously bearish across all timeframes. Yet with Q2 earnings due July 28, the setup carries a binary element that makes risk calculus unusually complex.
Summary
Key takeaways
- BE closed at $184.89 on July 24, down roughly 43% in one month and trading below every meaningful daily moving average.
- The daily RSI at 36.11 and a deeply negative MACD confirm accelerating bearish momentum, with no divergence signal in sight.
- The EMA200 at $186.84 is the immediate gatekeeper — a breakdown below it would expose the daily S1 pivot at $174.01.
- Q2 earnings on July 28 represent a powerful binary catalyst; a $20 billion contracted backlog and the Oracle fuel-cell deal provide genuine upside ammunition.
- The daily ATR of $26.32 reflects elevated volatility, making pre-earnings directional positioning exceptionally risky.
Bloom Energy Stock Daily Bias Remains Under Pressure
Bloom Energy Stock’s daily trend is decisively bearish, with price stranded below key moving averages and momentum indicators still pointing lower.
BE’s close at $184.89 sits comfortably below the EMA20 at $237.78 and the EMA50 at $250.27. That gap reflects a sustained breakdown in trend structure, not a minor technical shortfall. The EMA200 at $186.84 is the one level still in play. It acts as thin immediate support just above the lower Bollinger Band at $180.51.
The daily RSI at 36.11 confirms ongoing selling pressure without triggering a classic oversold reading. Momentum has not fully exhausted. Meanwhile, the MACD tells an equally uncomfortable story: the line at -20.24 sits well below the signal at -14.93, with a histogram of -5.30. Bearish momentum is accelerating on the daily chart.
Volatility is elevated. The daily ATR of $26.32 reflects wide swings in either direction, consistent with a stock that has recently experienced extreme selling. Notably, the Bollinger midline at $244.62 is now far overhead. The lower band at $180.51 marks where price compression could theoretically begin. Meanwhile, daily pivot support sits at $174.01 — a meaningful breakdown level if the EMA200 fails.
Hourly Structure Confirms the Weakness
The hourly chart offers no bullish relief for Bloom Energy Stock, with price stranded below every structural reference point.
On the 1-hour chart, the bearish regime is explicit. The close at $185.08 lies below all three hourly EMAs: the EMA20 at $207.69, the EMA50 at $217.35, and the EMA200 at $250.84. Price is essentially stranded below every structural reference. No meaningful base of support exists overhead.
The hourly RSI at 27.53 is now approaching genuinely oversold territory. In isolation, that might invite a technical bounce narrative. However, the MACD histogram at -3.92 shows that bearish momentum at the intraday level is still expanding, not contracting. These two signals are in mild tension: oversold RSI hints at exhaustion, but MACD has not yet confirmed a reversal. That combination typically favors caution over aggressive counter-trend positioning.
The hourly lower Bollinger Band at $184.95 nearly matches the current close. Price hugging the lower band without a decisive breakdown can sometimes precede a relief bounce. It can also simply walk the band lower in a sustained trend. At this stage, the hourly regime lends no bullish confirmation to counter the daily breakdown.
Short-Term Execution Context: Extreme Oversold Readings
The 15-minute chart reveals extreme oversold conditions for Bloom Energy Stock, with the RSI at 18.85 — a level that signals short-term exhaustion rather than structural reversal.
The 15m RSI stands at 18.85, deeply oversold by any standard measure. The MACD histogram at -0.61 has effectively flatlined relative to the prior descent. This suggests the most intense short-term selling impulse may be briefly pausing. The 15m pivot point sits at $184.89, with resistance at $186.56 and support at $183.41.
Overall, the 15m picture suggests short-term exhaustion rather than a structural reversal. The ATR of $2.68 implies modest intraday range in the short session. Any bounces at this level are likely corrective, not trend-changing, until a higher-timeframe trigger appears.
Earnings on July 28 — The Overriding Variable
Bloom Energy Stock’s technical outlook cannot be assessed without factoring in the July 28 earnings report, which represents a powerful binary catalyst with fundamental ammunition on both sides.
No technical analysis of Bloom Energy Stock is complete without acknowledging the July 28 earnings event. Q1 revenue reportedly grew 130% year-over-year. The company carries a $20 billion contracted backlog and a major Oracle fuel-cell deal. These are fundamentally strong signals. They explain why some analysts have upgraded BE to a Buy even as the price has collapsed.
The 43% one-month decline creates a paradox. The stock is deeply oversold and technically broken. Yet that decline may already reflect fear rather than deteriorating fundamentals. A strong Q2 print — with margin progress and backlog growth — could trigger a violent short-squeeze recovery. Conversely, any disappointment against elevated Wall Street estimates could push price toward the daily S1 pivot at $174.01 or even the Bollinger lower band at $180.51.
Bullish Scenario: What Would Need to Happen
For Bloom Energy Stock to stage a bullish recovery, Q2 results must validate the growth trajectory, and price must reclaim the EMA200 at $186.84 on a daily closing basis.
A bullish recovery requires a specific sequence. First, Q2 results on July 28 need to validate the growth trajectory implied by the backlog and Oracle deal. Second, price would need to reclaim the EMA200 at $186.84 on a daily closing basis. That level is the immediate gatekeeper. Beyond it, a recovery toward the daily pivot point at $194.10 and then R1 at $204.98 becomes the structural pathway. The deeply oversold 15m and approaching-oversold 1H RSI readings would amplify any upward move from current levels.
Bearish Scenario: What Would Invalidate the Case for Bulls
The bearish case for Bloom Energy Stock is technically straightforward: disappointing earnings would likely break the EMA200 support, opening a path toward the daily S1 pivot at $174.01.
A disappointing earnings report — or guidance that fails to justify the premium valuation — would remove the one remaining bullish catalyst. In that case, the EMA200 at $186.84 would likely fail as support. The next meaningful technical floor sits at the daily S1 pivot of $174.01. Below that, the lower Bollinger Band at $180.51 offers limited buffer before sellers reach open territory with little structural support in sight.
The daily MACD remaining in deep negative territory would reinforce that scenario. There is no sign of divergence or trend exhaustion on the daily chart at this point. Only continued downside momentum persists.
Positioning Into a High-Stakes Binary Event
Bloom Energy Stock enters its July 28 earnings report as a compressed spring — technically distressed across all timeframes, yet carrying genuine upside ammunition in its fundamental backdrop.
Overall, Bloom Energy Stock enters its July 28 earnings report in technically distressed condition across all three timeframes. The daily regime is under pressure. The hourly is explicitly bearish. Only the extreme 15m RSI reading offers any short-term pause signal. At the same time, the fundamental backdrop provides genuine upside ammunition if Q2 delivers: a $20B backlog, triple-digit revenue growth, and an Oracle deal.
In this context, the stock is best understood as a compressed spring rather than a directional trade. Volatility is high. The ATR is wide. The binary nature of the upcoming event makes pre-earnings positioning exceptionally risky. Prudent analysts will wait for clarity from the earnings call before establishing meaningful directional exposure. The technical damage is real — but so is the potential for a sharp reversal if the numbers surprise to the upside.
FAQ
What is the technical outlook for Bloom Energy Stock ahead of earnings?
Bloom Energy Stock is technically bearish across all timeframes. The daily close at $184.89 sits below the EMA20 ($237.78) and EMA50 ($250.27), with only the EMA200 ($186.84) providing thin support. The daily RSI at 36.11 and a deeply negative MACD confirm accelerating bearish momentum without any divergence signal.
What key levels should traders watch on Bloom Energy Stock?
The EMA200 at $186.84 is the immediate gatekeeper. A breakdown below it would expose the daily S1 pivot at $174.01. On the upside, reclaiming the EMA200 opens a recovery path toward the daily pivot at $194.10 and R1 at $204.98.
Could Bloom Energy Stock recover after the July 28 earnings report?
Yes, a recovery is possible. The company’s $20 billion contracted backlog, 130% year-over-year Q1 revenue growth, and the Oracle fuel-cell deal provide genuine upside ammunition. A strong Q2 print could trigger a sharp short-squeeze recovery from deeply oversold levels.
Why is Bloom Energy Stock considered a binary event trade right now?
The July 28 earnings report creates a high-stakes binary setup. The 43% one-month decline may already reflect excessive fear, making a positive surprise explosively bullish. However, any disappointment could push price toward $174.01 or lower, given the limited structural support below current levels.
Disclaimer: This article is for informational purposes only and does not constitute financial advice, an investment recommendation, or a solicitation to buy or sell any financial instrument or cryptocurrency. The analysis provided is not indicative of future results. Investing in crypto assets and financial markets carries a high risk of capital loss. Always do your own research (DYOR) and consult a qualified financial advisor before making any decision.
Article produced with the assistance of artificial intelligence and reviewed by the editorial team.
