




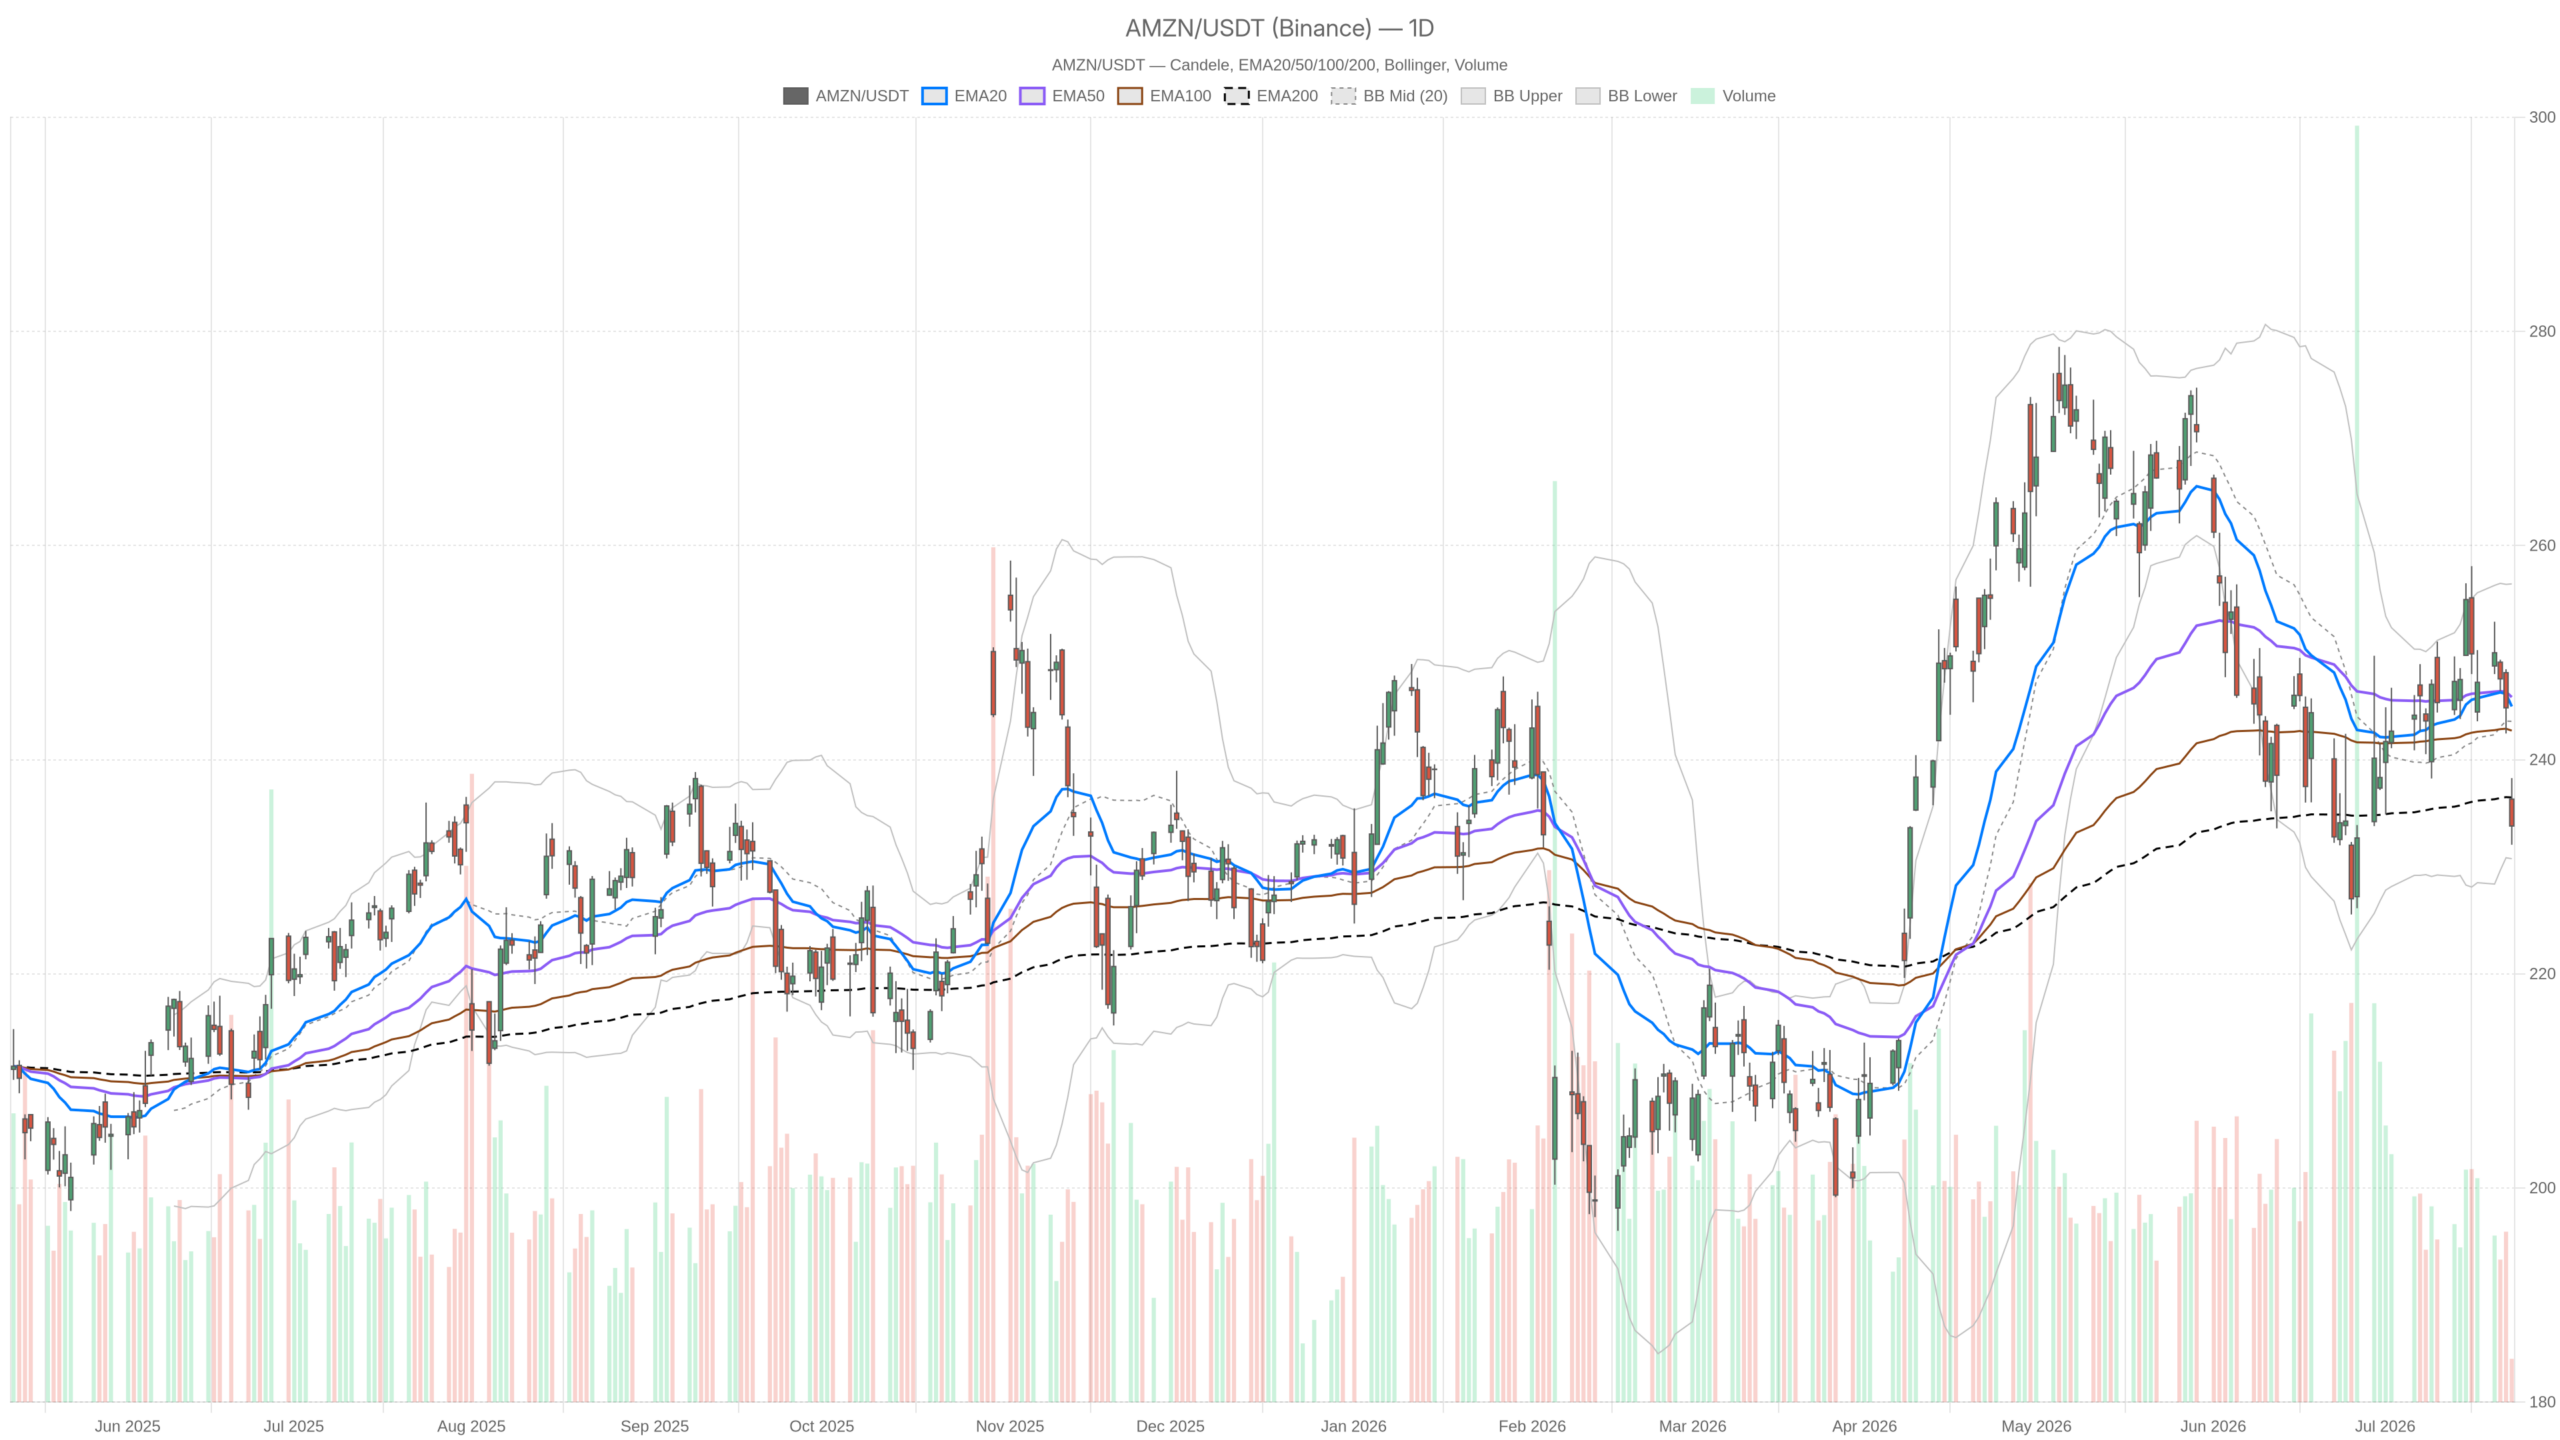
Amazon.com, Inc. stock enters a precarious zone just days before the Q2 earnings report. AMZN closed at $233.81 on July 23 — 11% below its 52-week high. Every major moving average exerts overhead pressure. The stock is in correction territory, with a critical catalyst ahead.
Summary
Key takeaways
- AMZN closed at $233.81 on July 23, 11% below its 52-week high, with all major moving averages acting as overhead resistance
- Daily RSI at 38.73 signals persistent selling pressure, while hourly RSI at 26.59 sits deep in oversold territory
- AWS grew 28% in Q1; the Q2 earnings report on July 30 is a high-stakes catalyst that could reset the narrative
- The daily Bollinger lower band at $230.75 marks the critical support — a breakdown below it would signal a structural shift
- Both daily and hourly timeframes confirm a bearish bias, with MACD momentum accelerating to the downside
Daily Bias: Bearish Structure With a Critical Support Test
The daily bias for Amazon.com, Inc. stock is decisively bearish. Price at $233.81 sits well below both the EMA20 at $244.98 and the EMA50 at $245.85. Sellers have maintained control for an extended period. The EMA200 at $236.48 is the only dynamic level still in reach — and the stock is already trading beneath it, adding further weight to the downside case.
Momentum Indicators Deepen the Bearish Case
However, the daily RSI at 38.73 is approaching oversold territory without having fully reached it. A reading in this range typically reflects persistent selling pressure rather than a clean washout. It signals fatigue without resolution. It does not yet point to an imminent reversal.
Meanwhile, the daily MACD confirms the bearish momentum. The line at -0.52 sits below the signal at -0.23, producing a histogram of -0.29. No evidence of a bullish crossover is forming. The momentum signal remains firmly negative.
Bollinger Bands on the daily chart place the midline at $243.59. The upper band sits at $256.42 and the lower band at $230.75. The current close near the lower end confirms that AMZN is hugging the soft floor of this structure. The ATR of 6.91 underscores meaningful day-to-day swing potential — this is not a low-volatility environment.
At the same time, daily pivot levels place the pivot point at $234.72, with resistance at $237.38 and support at $231.15. The stock trades just beneath the pivot, reinforcing the near-term bearish lean. A reclaim above $237.38 would mark the first meaningful sign of short-term stabilization.
Hourly Timeframe: Bearish Regime Deepens the Case
The hourly chart offers no relief from the daily bearish structure. AMZN sits far beneath all three hourly EMAs. The EMA20 at $241.55, EMA50 at $245.16, and EMA200 at $246.36 form a full bearish stack. This alignment echoes and reinforces the daily picture, leaving little room for a neutral interpretation.
More striking is the 1H RSI reading of 26.59 — technically in oversold territory. However, oversold does not mean buy. In a confirmed bearish regime, oversold RSI often signals sustained distribution rather than an exhaustion reversal. The risk of a short-term bounce is real. Still, without a structural catalyst, bounces in this context tend to be selling opportunities rather than trend reversals.
The 1H MACD reinforces this view. The line sits at -3.9 against a signal of -2.75, producing a histogram of -1.15. That is a notably deep negative spread. Momentum on the hourly is not just negative — it is accelerating to the downside. The 1H Bollinger lower band at $231.84 represents the immediate cushion. A sustained close below it would suggest the selling phase has further room to run.
15-Minute Frame: One Faint Signal in a Sea of Selling
The 15-minute chart offers a single faint bullish signal. The MACD histogram has turned positive at 0.37, with the line at -1.85 and the signal at -2.22. This means the histogram is recovering even as absolute momentum remains negative. The micro-level divergence hints at very short-term stabilization or a minor relief bounce.
Nevertheless, the broader 15-minute picture remains consistent with the higher timeframes. The RSI sits at 31.12 and the regime designation is explicitly bearish. Price is hemmed between the pivot at $233.92, resistance at $234.11, and support at $233.61. The tight trading range reflects post-decline consolidation rather than renewed buying interest.
The Earnings Wildcard: July 30 Changes Everything
The July 30 Q2 earnings report is the dominant catalyst for Amazon.com, Inc. stock this week. Bank of America has already raised the bar, projecting Q2 revenue of $198.8 billion and operating profit of $24.1 billion. BofA specifically argues that AWS grew 28% in Q1 — and is accelerating faster than the broader Street expects.
In contrast, the market appears skeptical. The 11% drawdown from the 52-week high, despite record profitability metrics, points to a wall of worry rather than a collapsing business. Capital expenditure concerns are clearly weighing on sentiment. Some investors read ballooning capex as a warning sign. Others see evidence of aggressive infrastructure investment that will yield long-term returns. The market has not reached a verdict.
Adding a separate headline risk, a $2.5 billion FTC settlement related to Amazon Prime enrollment practices has entered the news cycle. The direct financial impact relative to Amazon’s scale may be limited. However, it is the kind of regulatory overhang that keeps cautious investors on the sidelines near a technically weak chart.
Bullish Scenario: What Would Support a Recovery
A recovery in Amazon.com, Inc. stock hinges on a strong earnings beat. Oversold RSI readings on both the daily and hourly timeframes create the technical foundation for a sharp mean-reversion rally. If the July 30 report delivers on AWS acceleration and meets or exceeds BofA’s projections, a rapid re-rating becomes plausible.
Technically, a reclaim of the daily EMA200 at $236.48 would be the first signal that sentiment is shifting. Above that, the pivot resistance at $237.38 and the EMA20 near $244.98 define the recovery pathway. Sustained volume on any bounce would be essential to distinguish a genuine reversal from a dead-cat rally.
Bearish Scenario: What Would Invalidate the Bullish Case
On the other hand, a breakdown below $230.75 would invalidate any near-term bullish thesis. That level sits just $3 beneath the July 23 close. Below it, the daily pivot support at $231.15 offers only a thin floor. A close beneath both levels on meaningful volume ahead of earnings would suggest that institutional selling is structural — not simply pre-earnings profit-taking.
Should earnings disappoint — particularly on AWS guidance, operating margins, or if capex commentary unnerves investors further — the daily RSI still has room to push deeper before reaching extreme levels. The ATR of 6.91 on the daily frame means a single-day post-earnings move of that magnitude or larger is entirely within normal statistical range for Amazon.com, Inc. stock.
Positioning Into an Uncertain Earnings Window
Overall, Amazon.com, Inc. stock is in a technically weak posture on every meaningful timeframe. Price structure, momentum, and trend alignment all point in the same direction: pressure remains to the downside until a catalyst forces a repricing. The daily regime is neutral-to-bearish, while both the hourly and 15-minute frames are explicitly bearish.
That catalyst is just one week away. The asymmetry of this setup is notable — the stock is technically stretched to the downside, oversold on the hourly, and approaching critical support levels, all within days of a high-stakes earnings report. Volatility ahead of and following July 30 is likely to be substantial. The technical bias is bearish, but the earnings binary makes this an environment where conviction demands caution.
FAQ
Is Amazon.com, Inc. stock in a correction?
Yes. AMZN closed at $233.81 on July 23, which sits 11% below its 52-week high. The stock is trading beneath every major daily moving average, confirming it is in a correction. The daily bias is decisively bearish with no immediate signs of a reversal.
When is Amazon’s Q2 2025 earnings report?
Amazon reports Q2 earnings on July 30. Bank of America projects revenue of $198.8 billion and operating profit of $24.1 billion. AWS performance and capex commentary will be the focal points for investors.
What are the key support levels for AMZN?
The most critical support is the daily Bollinger lower band at $230.75. Just above it sits the daily pivot support at $231.15. On the hourly chart, the Bollinger lower band at $231.84 provides an additional cushion. A sustained breakdown below $230.75 would signal a structural shift in the bearish direction.
What is Wall Street expecting from AWS?
Bank of America argues that AWS is accelerating faster than the broader Street anticipates. AWS already grew 28% in Q1, and BofA’s projections for Q2 imply continued momentum. The AWS growth trajectory is central to the bull case heading into the July 30 print.
Disclaimer: This article is for informational purposes only and does not constitute financial advice, an investment recommendation, or a solicitation to buy or sell any financial instrument or cryptocurrency. The analysis provided is not indicative of future results. Investing in crypto assets and financial markets carries a high risk of capital loss. Always do your own research (DYOR) and consult a qualified financial advisor before making any decision.
Article produced with the assistance of artificial intelligence and reviewed by the editorial team.
