




Bearish signals dominate the cryptocurrency landscape as of July 22, 2026, with the total market cap slipping to $2.32 trillion and sentiment stuck in Fear. Movement crypto finds itself trading at $0.01, facing pressure across every major timeframe with no immediate reversal signal in sight.
Summary
Key takeaways
- MOVE/USDT trades at $0.01 with bearish signals confirmed across daily, hourly, and 15-minute timeframes
- Daily RSI at 39.91 leaves room for further downside before reaching oversold territory
- Bollinger Bands have compressed on the daily chart, signaling an impending volatility expansion likely biased to the downside
- The 200-day EMA at $0.02 represents the only structurally meaningful recovery target for any trend reversal
- Bitcoin dominance at 56.6% and the Fear & Greed Index at 33 reinforce the risk-off environment for altcoins
Daily Bias: Structurally Bearish, No Room for Doubt
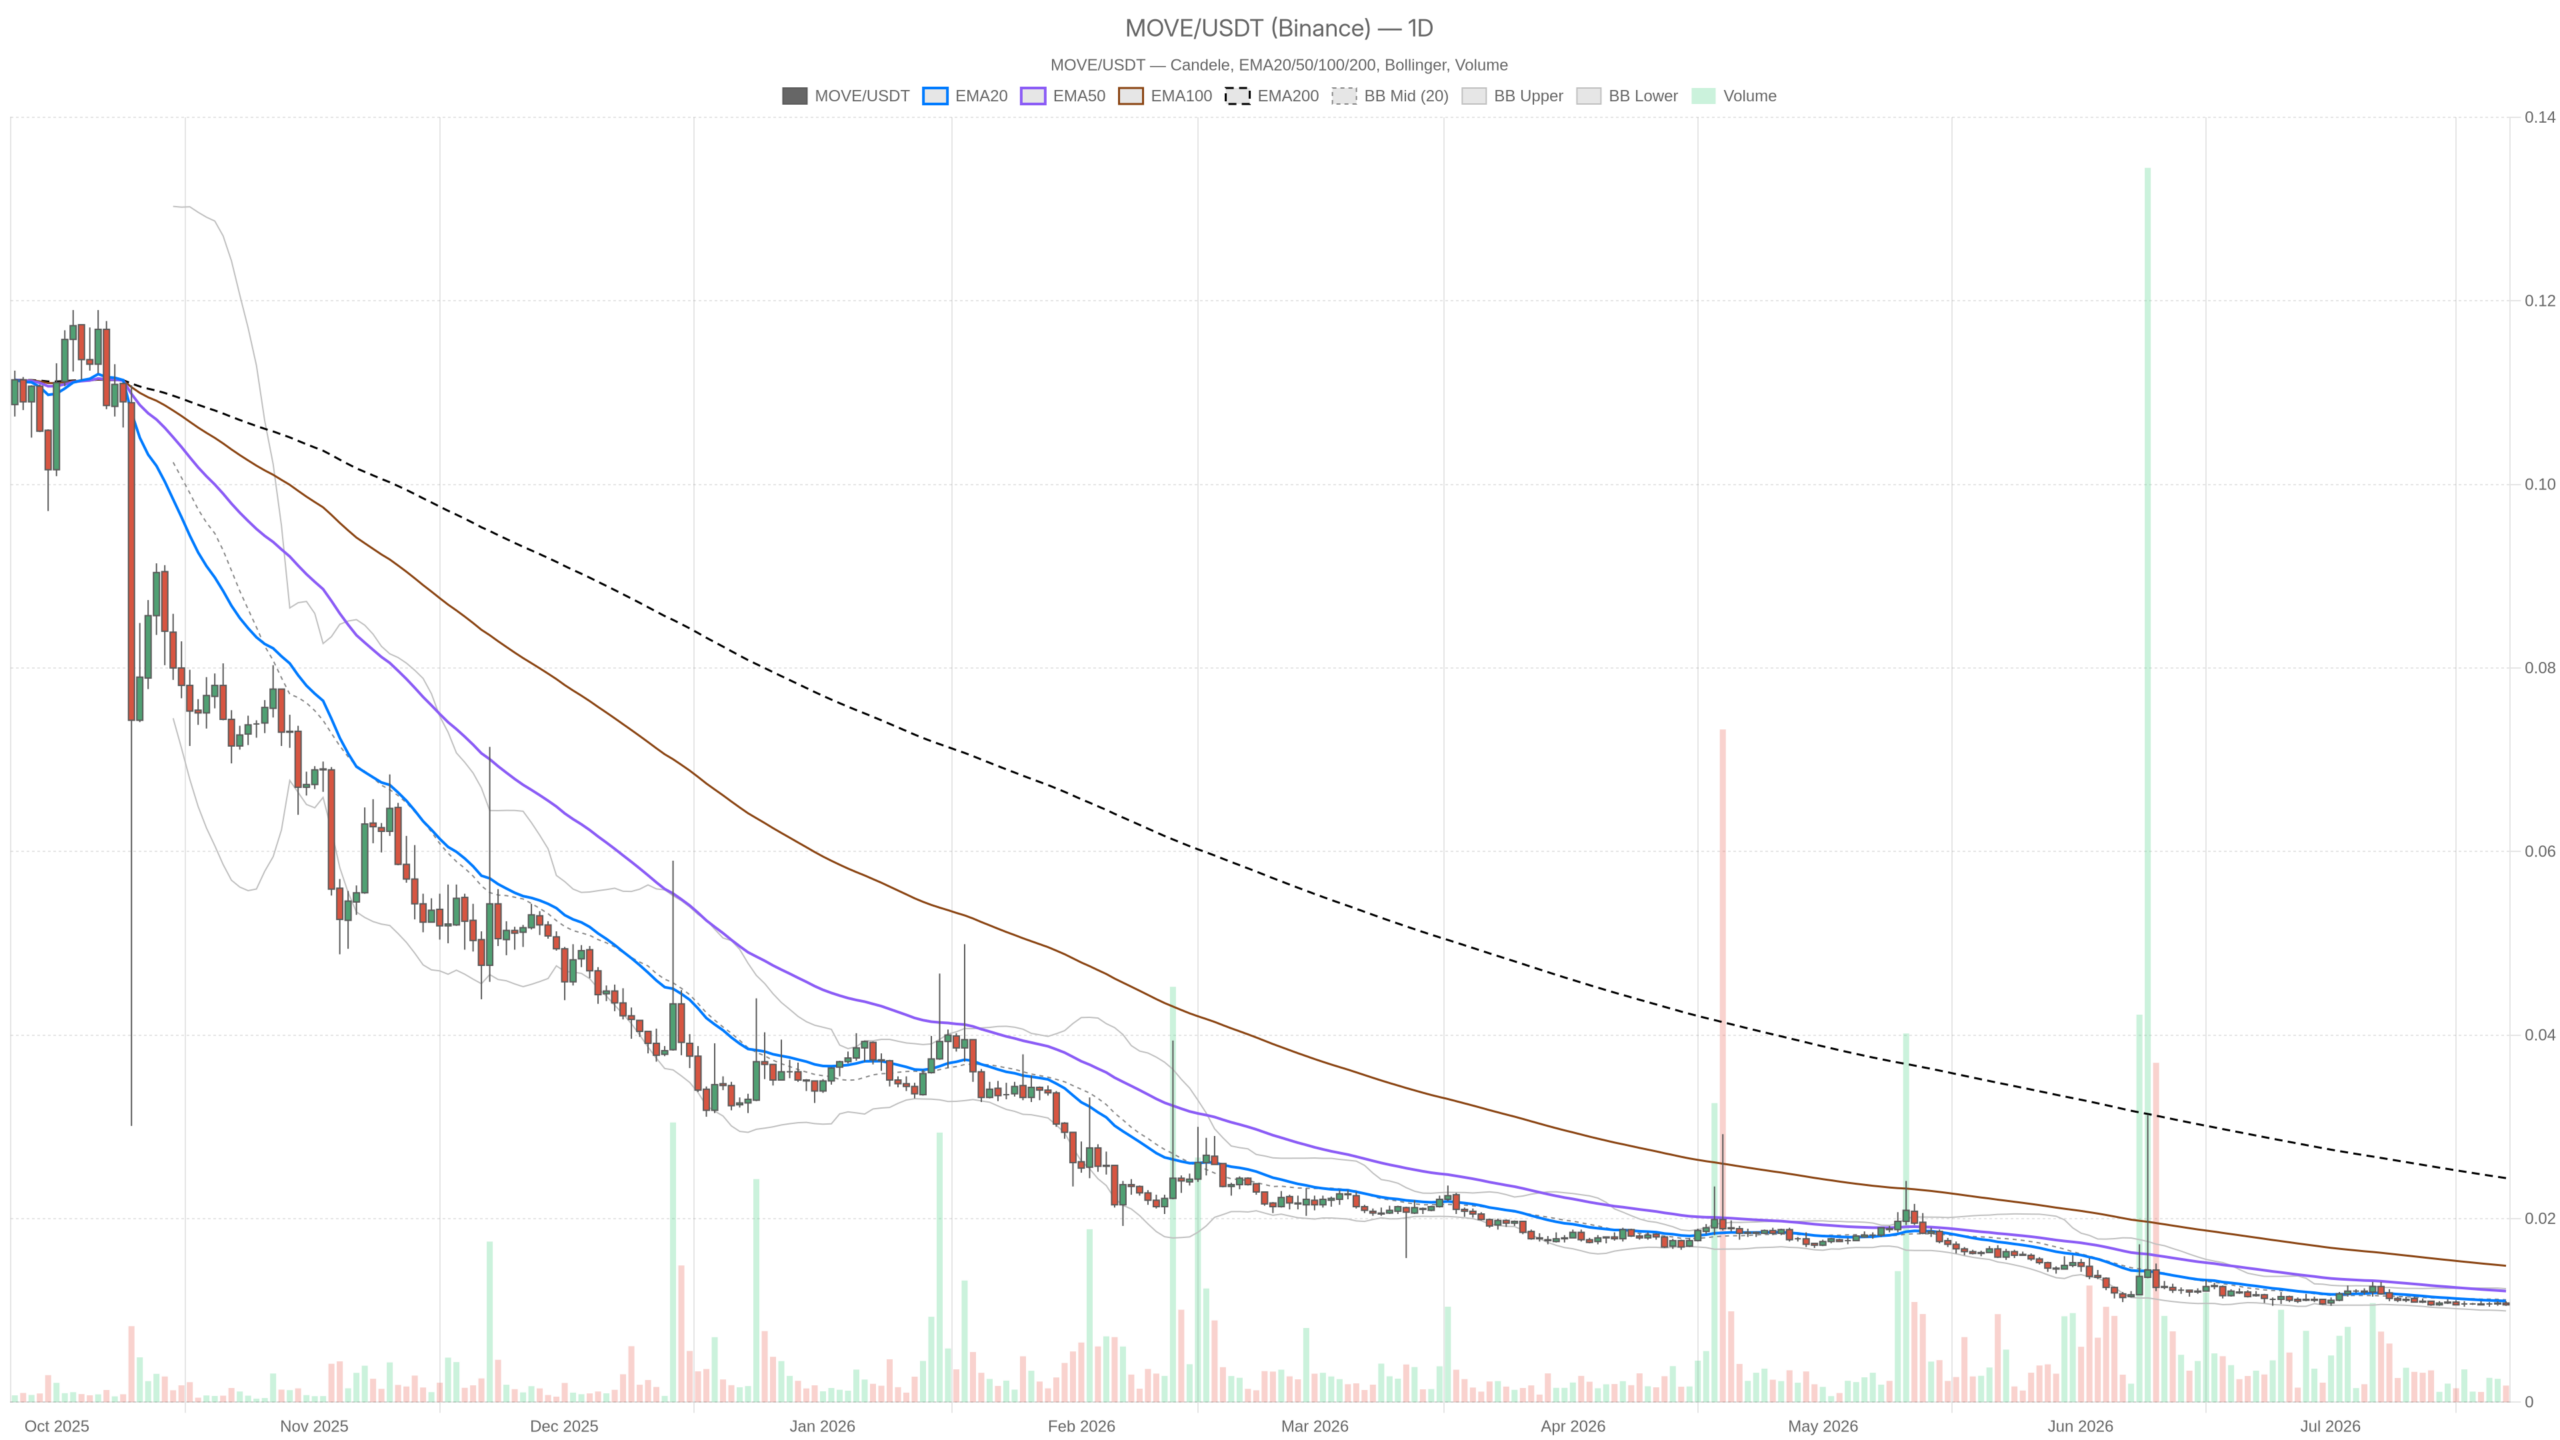
The daily chart confirms a structurally bearish regime, with price pinned at converged 20-day and 50-day EMAs while the 200-day EMA sits at double the current price. Price is trading at $0.01, right at both the 20-day and 50-day EMAs which have effectively converged. Meanwhile, the 200-day EMA sits at $0.02 — double the current price. That gap is not just a distance metric. It is a statement about how far MOVE has fallen from its prior trend.
The daily RSI at 39.91 sits just below the neutral 40 zone. It has not reached oversold territory, which is actually the more cautious read. Sellers have not fully exhausted themselves yet, and there is room for further downside without triggering a technical bounce. MACD on the daily is flat at zero, reflecting a market that has lost momentum rather than one building for a move. Bollinger Bands have compressed, with mid, upper, and lower bands all registering at $0.01. This squeeze typically precedes a volatility expansion leaning bearish.
Hourly Chart: Momentum Is Collapsing
The 1-hour timeframe shows accelerating weakness, with the RSI dropping to 29.3 and all three EMAs aligned at $0.01, confirming no intraday support structure exists. Drop down to the 1-hour chart and the picture accelerates the concern. The 1H RSI has fallen to 29.3, placing it on the doorstep of oversold. All three EMAs — 20, 50, and 200 — are aligned at $0.01, confirming there is no intraday structure offering support. The hourly MACD remains flat, again suggesting this is not a market where buyers are quietly accumulating against the trend.
However, the fact that the 1H regime is also flagged as bearish means the daily bias is not being challenged from below. There is no divergence, no early reversal signal, and no hidden strength. Both timeframes are singing from the same sheet, which removes any ambiguity about the intermediate-term direction.
15-Minute Chart: Extreme Short-Term Oversold — But Be Careful
The 15-minute RSI at 6.44 signals extreme short-term oversold conditions, but within a bearish daily and hourly structure, any bounce is more likely a trap than a reversal. The 15-minute RSI is the one number that stands out: 6.44. That is not just oversold — it is a reading that implies an almost complete absence of buying pressure at the micro level. In practice, RSI readings this extreme on the lowest timeframe often produce short-term bounces from mechanical seller exhaustion. That said, a snap bounce on the 15-minute chart within a bearish daily and hourly structure is a trap more often than a reversal.
Execution traders might watch this level for a short-term relief rally. However, positioning against the prevailing trend here carries meaningful risk. The 15-minute regime remains bearish, and with all EMAs compressed at $0.01 and MACD flat, any bounce would need to prove itself with volume and follow-through — two things the current data gives no evidence of.
Movement Crypto’s Bullish Scenario — and What Would Make It Real
A daily close separating price from the current EMA cluster with conviction, accompanied by RSI pushing through 45, would be the minimum requirement for any narrative shift. For Movement crypto to shift the narrative, the bare minimum would be a daily close that begins separating price from the current EMA cluster with conviction. This would ideally be accompanied by a daily RSI pushing back through 45 and MACD histograms turning positive. A reclaim of $0.02 — where the 200-day EMA sits — would be the structural level that actually changes the macro bias from bearish to contested. Until that happens, any green candle is noise within a downtrend.
A macro tailwind could help. Visa’s recently launched stablecoin platform serving over 200 million merchants signals that institutional infrastructure around crypto is expanding. That is the kind of development that, in a risk-on environment, tends to lift altcoin sentiment broadly. But this is a sector narrative, not an asset-specific catalyst, and right now MOVE needs its own reason to attract buyers.
Bearish Scenario — The Path of Least Resistance
If the $0.01 psychological floor fails, MOVE faces asymmetric downside risk because pivot levels have collapsed into a single price point offering no differentiated support. If the $0.01 level fails to hold as a psychological floor — and given the data there is no structural evidence that it will — MOVE faces a situation where pivot support offers no meaningful differentiation. Pivot levels PP, R1, and S1 all sit at $0.01. When your pivot levels collapse into a single price, the market is essentially telling you that range has contracted so severely that directional risk is asymmetric to the downside.
Moreover, a continuation of broader market weakness reinforces the case. BTC dominance remains above 56% and the Fear & Greed Index stays below 40. DeFi data from DefiLlama adds another layer: fees across major DEXs including Uniswap V3, Fluid DEX, and Curve DEX are declining sharply on 1-day and 7-day measures. Curve in particular saw fees drop 68.49% in a single day and 80% over seven days. This is not just a MOVE problem — on-chain activity is cooling, and low-cap tokens in a low-activity environment are the most vulnerable.
Positioning and Risk: What Traders Should Consider
No timeframe currently supports a bullish bias for MOVE, which means any holding without a defined invalidation level relies on hope rather than technical structure. Anyone already holding MOVE should be honest about what the data is saying: there is no timeframe that supports a bullish bias right now. That does not mean the asset goes to zero tomorrow. However, it does mean that holding through this without a defined invalidation level is a decision made on hope rather than structure. The Bollinger Band compression on the daily is the one dynamic factor worth monitoring — when that band expands, it will signal the start of the next significant directional move. Given the current setup, the probability-weighted expectation is that it expands downward.
For those watching for a re-entry on any potential recovery, the 200-day EMA at $0.02 remains the only technically meaningful level worth targeting as confirmation. Until price reclaims that zone and consolidates above it, any long position in MOVE is a counter-trend trade. That positioning is not inherently wrong, but it requires tighter risk management and clear stop levels. The market overall, with a $2.32 trillion cap losing ground and sentiment firmly in Fear, is not an environment that forgives sloppy positioning in lower-liquidity altcoins.
FAQ
What is the current price of Movement crypto?
MOVE/USDT is trading at $0.01 as of July 22, 2026, with bearish signals confirmed across the daily, hourly, and 15-minute timeframes.
Is Movement crypto expected to recover?
A recovery would require a daily close separating price from the current EMA cluster with conviction, accompanied by RSI pushing through 45. The 200-day EMA at $0.02 remains the structurally meaningful level that would shift the macro bias from bearish to contested.
What are the biggest risks for MOVE right now?
The biggest risks include the compression of Bollinger Bands signaling an impending volatility expansion biased downward, BTC dominance remaining elevated above 56%, and declining DeFi activity across major DEXs. The $0.01 psychological floor offers no differentiated pivot support, making downside risk asymmetric.
Disclaimer: This article is for informational purposes only and does not constitute financial advice, an investment recommendation, or a solicitation to buy or sell any financial instrument or cryptocurrency. The analysis provided is not indicative of future results. Investing in crypto assets and financial markets carries a high risk of capital loss. Always do your own research (DYOR) and consult a qualified financial advisor before making any decision.
Article produced with the assistance of artificial intelligence and reviewed by the editorial team.
