




AT&T Inc. stock surged 2.5% premarket after Q2 2026 adjusted EPS of $0.65 beat the $0.59 estimate. Postpaid phone and internet additions exceeded expectations. Yet overbought technical signals across multiple timeframes present a more nuanced picture than the headline suggests.
Summary
Key takeaways
- AT&T delivered adjusted EPS of $0.65, beating analyst estimates of $0.59 by 10.2%.
- Postpaid phone and internet subscriber additions exceeded expectations in Q2 2026.
- Daily RSI at 62.35 remains constructive, while hourly RSI has reached overbought territory at 81.5.
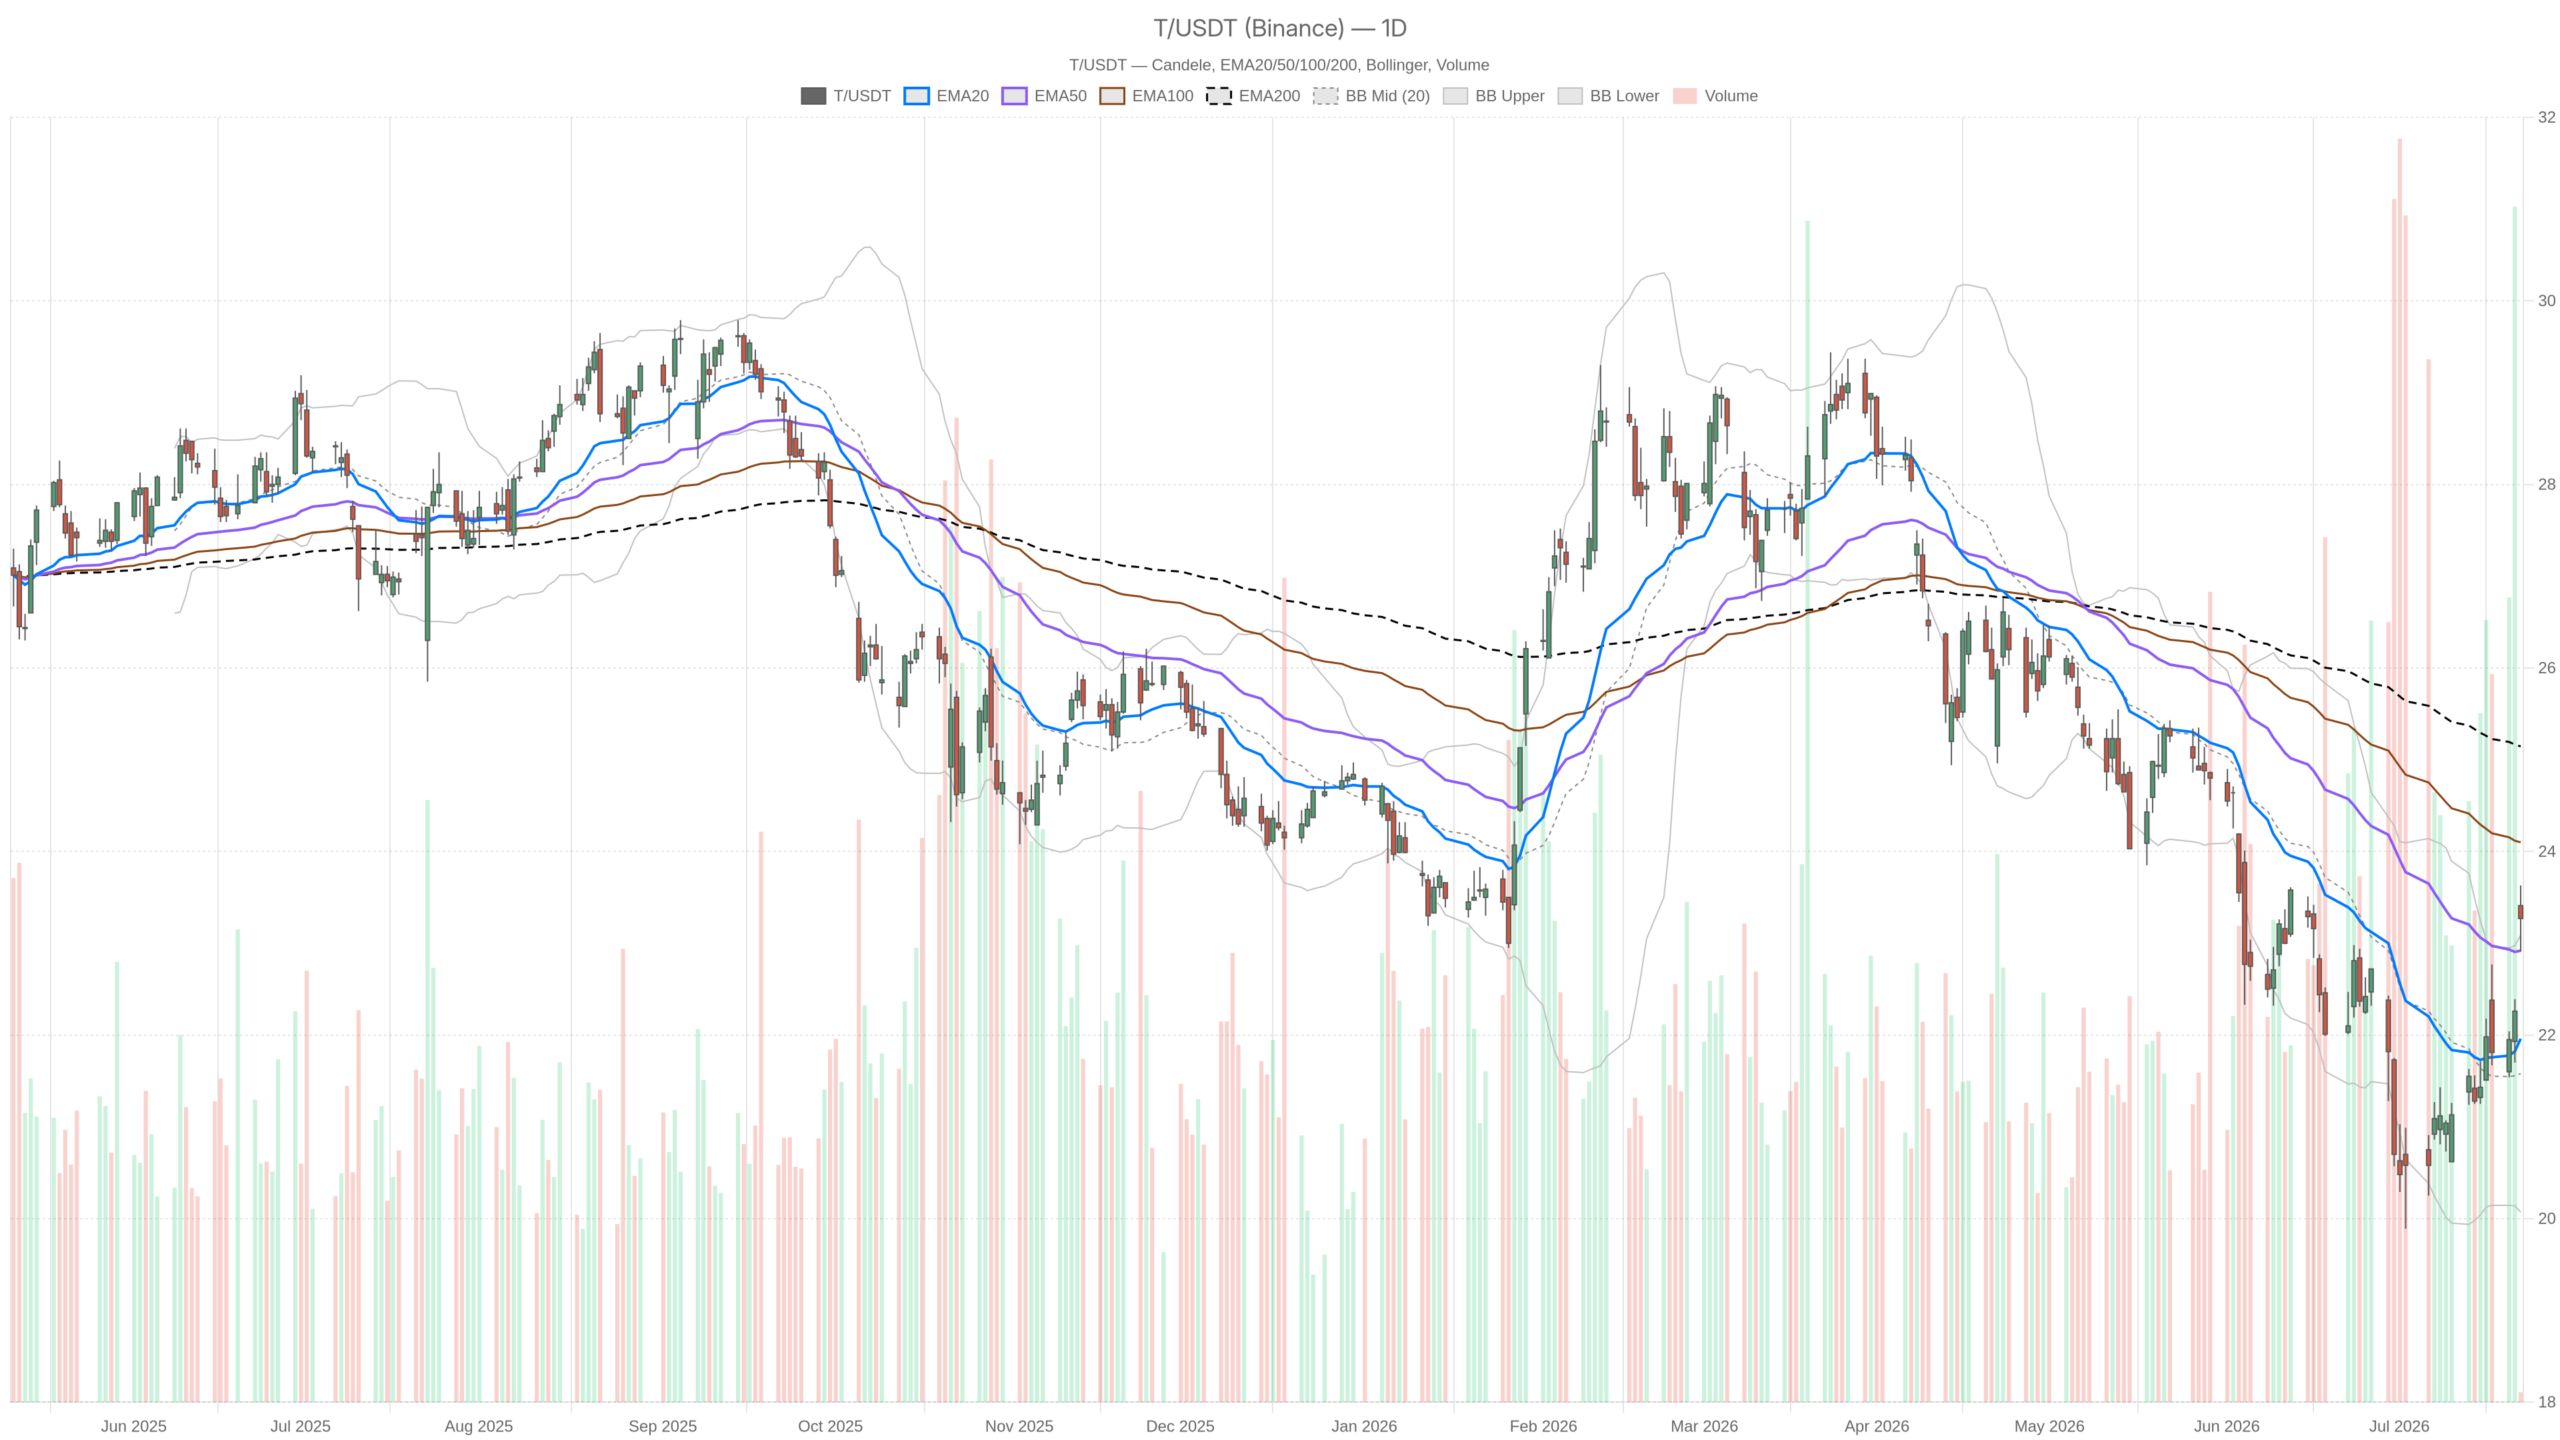
- Price closed at $23.27, fractionally above the daily Bollinger upper band at $23.09.
- The EMA200 at $25.15 remains a structural ceiling above current levels.
Daily Bias: Cautiously Constructive on AT&T Inc. Stock
The daily timeframe for AT&T Inc. stock presents a broadly constructive picture with important caveats. Price holds above key moving averages, but the longer-term trend has not yet reversed. AT&T closed at $23.27 on July 22, sitting above both the EMA20 at $21.96 and the EMA50 at $22.92. This reflects a meaningful recovery from lower levels. However, the EMA200 at $25.15 remains well above current price. That longer-term average acts as a structural ceiling.
Momentum and Moving Average Alignment
The daily MACD tells a quietly bullish story. The histogram has turned positive at 0.31. The MACD line at -0.17 has crossed above the signal line at -0.48. That MACD crossover from negative territory signals an early-trend shift. Meanwhile, daily RSI at 62.35 sits in comfortable bullish territory without yet reaching overbought extremes. There is still room to run on this timeframe.
Volatility Context and Band Dynamics
Bollinger Bands show the upper band at $23.09. Price closed at $23.27 — fractionally above that band. This breakout suggests strong buying pressure. At the same time, it can flag near-term overextension. The ATR of 0.70 points to moderate daily volatility. The session range spanned $22.91 to $23.63. Both figures align precisely with the S1 and R1 pivot levels. Overall, the daily regime is classified as neutral, reflecting a recovery still maturing rather than established.
Hourly Conflict: Momentum Running Hot on AT&T
The hourly chart confirms the bullish impulse but immediately raises a caution flag. RSI on this timeframe stands at 81.5 — firmly in overbought territory. That is not a trigger to fade the move outright. Still, it signals the intraday run has been aggressive. Buyers have pushed hard. The probability of at least a short-term consolidation increases materially at these levels.
Overbought RSI Meets Bullish MACD
On the other hand, the 1H MACD remains positive and expanding. The MACD line at 0.22 stands above the signal at 0.14, with a histogram reading of 0.08. Momentum is still constructive on the hourly chart. The EMA structure also supports the bullish case. EMA20 at $22.12 sits above EMA200 at $22.06. EMA50 at $21.82 sits below both — a setup reflecting recent bullish alignment rather than a long-established trend.
Notably, price on the 1H has broken well above the Bollinger upper band at $22.68. Trading at $23.27, AT&T stock runs significantly above that band. This kind of expansion typically accompanies a strong news-driven move. However, it also compresses the margin of safety for new entries. The hourly regime is also classified as neutral. This reinforces the view that the move is news-led rather than technically-driven at its core.
15-Minute Context: Short-Term Execution Dynamics on AT&T Inc. Stock
The 15-minute chart adds granularity for timing purposes and reveals even more extreme short-term readings. RSI on this frame hits 85.32 — significantly more stretched than the hourly reading. The 15m MACD histogram is positive at 0.08. Price structure shows a bullish regime classification that the higher timeframes have not yet confirmed. This is the only timeframe explicitly flagged as bullish by the regime model.
In practice, the 15m picture confirms the opening burst has been sharp and nearly vertical. The pivot point sits at $23.26, with R1 at $23.61 and S1 at $22.89. Price hugs R1. A failure to hold that level on any retest could pull the stock back toward the $22.89–$23.00 support zone. That range now becomes the key short-term reference level.
The Bullish Case for AT&T
The fundamental support for a sustained move higher in AT&T stock is genuine. Q2 revenue rose 2.3% year-on-year to $31.56 billion. Wireless subscriber additions beat expectations — a key metric that had investors nervous given the competitive environment. GAAP EPS of $0.66 came in 11.2% above consensus estimates. These are not marginal beats. They represent a clear operational outperformance on the metrics that matter most in the current telecom cycle.
Therefore, if price consolidates above $23.00 and daily RSI continues to build without reverting sharply, the next technical target becomes the $23.63 intraday high. Broader resistance approaching the EMA200 at $25.15 follows over a longer horizon. A hold of the daily EMA50 at $22.92 on any pullback would preserve the constructive structure intact.
The Bearish Scenario: What Could Invalidate the Rally
In contrast, the risks are not trivial. Revenue missed analyst expectations despite the EPS beat. Sales came in below the market’s top-line forecasts. That divergence between earnings outperformance and revenue shortfall can weigh on sentiment once the initial reaction fades. The market rewarded the subscriber story in the premarket. However, that enthusiasm may moderate as the session matures.
Technically, the most immediate bearish trigger would be a decisive break below the daily pivot at $23.27. A subsequent failure of the EMA50 at $22.92 would signal the gap-up was absorbed without follow-through. That would mark a classic fade pattern after a news catalyst.
Furthermore, the overbought RSI readings on both hourly and 15-minute frames create a specific vulnerability. Any fresh selling pressure could find limited buying resistance. A reversal back inside the daily Bollinger upper band would also undermine the breakout narrative.
Positioning and Volatility Outlook
Overall, AT&T Inc. stock enters the post-earnings session with genuine fundamental support and a daily technical structure that favors the bulls. The MACD crossover and EMA alignment both point in the right direction. However, the extreme short-term RSI readings across the hourly and 15-minute timeframes represent a real risk of near-term exhaustion. The daily ATR of 0.70 signals that meaningful swings remain possible within any given session.
Patience around entry timing appears warranted. Chasing the opening spike at these intraday levels carries elevated mean-reversion risk. The cleaner opportunity likely presents itself after some consolidation. Ideally, this would come on a pullback that holds the $22.91–$23.00 support zone. That would reset momentum indicators to less stretched levels.
FAQ
What drove AT&T Inc. stock higher on Wednesday?
AT&T Inc. stock surged after the company reported Q2 2026 adjusted EPS of $0.65, beating analyst estimates of $0.59. Postpaid phone and internet subscriber additions also exceeded expectations, providing a strong fundamental catalyst for the premarket rally.
Is AT&T stock overbought after the earnings pop?
On the daily timeframe, RSI at 62.35 remains in constructive territory and has not reached overbought levels. However, the hourly RSI stands at 81.5 and the 15-minute RSI at 85.32 — both firmly overbought — suggesting near-term exhaustion risk despite strong fundamentals.
What are the key support and resistance levels for AT&T?
The immediate support zone sits between $22.89 (S1 pivot) and $23.00. The daily EMA50 at $22.92 reinforces that area. On the upside, the intraday high of $23.63 marks near-term resistance, with the EMA200 at $25.15 representing a longer-term structural ceiling.
What is the broader trend outlook for AT&T Inc. stock?
The daily MACD crossover and EMA alignment point constructively higher. However, the daily regime remains classified as neutral, reflecting a recovery in progress rather than a fully established uptrend. The EMA200 at $25.15 remains distant, confirming the broader trend has not yet fully reversed.
Disclaimer: This article is for informational purposes only and does not constitute financial advice, an investment recommendation, or a solicitation to buy or sell any financial instrument or cryptocurrency. The analysis provided is not indicative of future results. Investing in crypto assets and financial markets carries a high risk of capital loss. Always do your own research (DYOR) and consult a qualified financial advisor before making any decision.
Article produced with the assistance of artificial intelligence and reviewed by the editorial team.
