




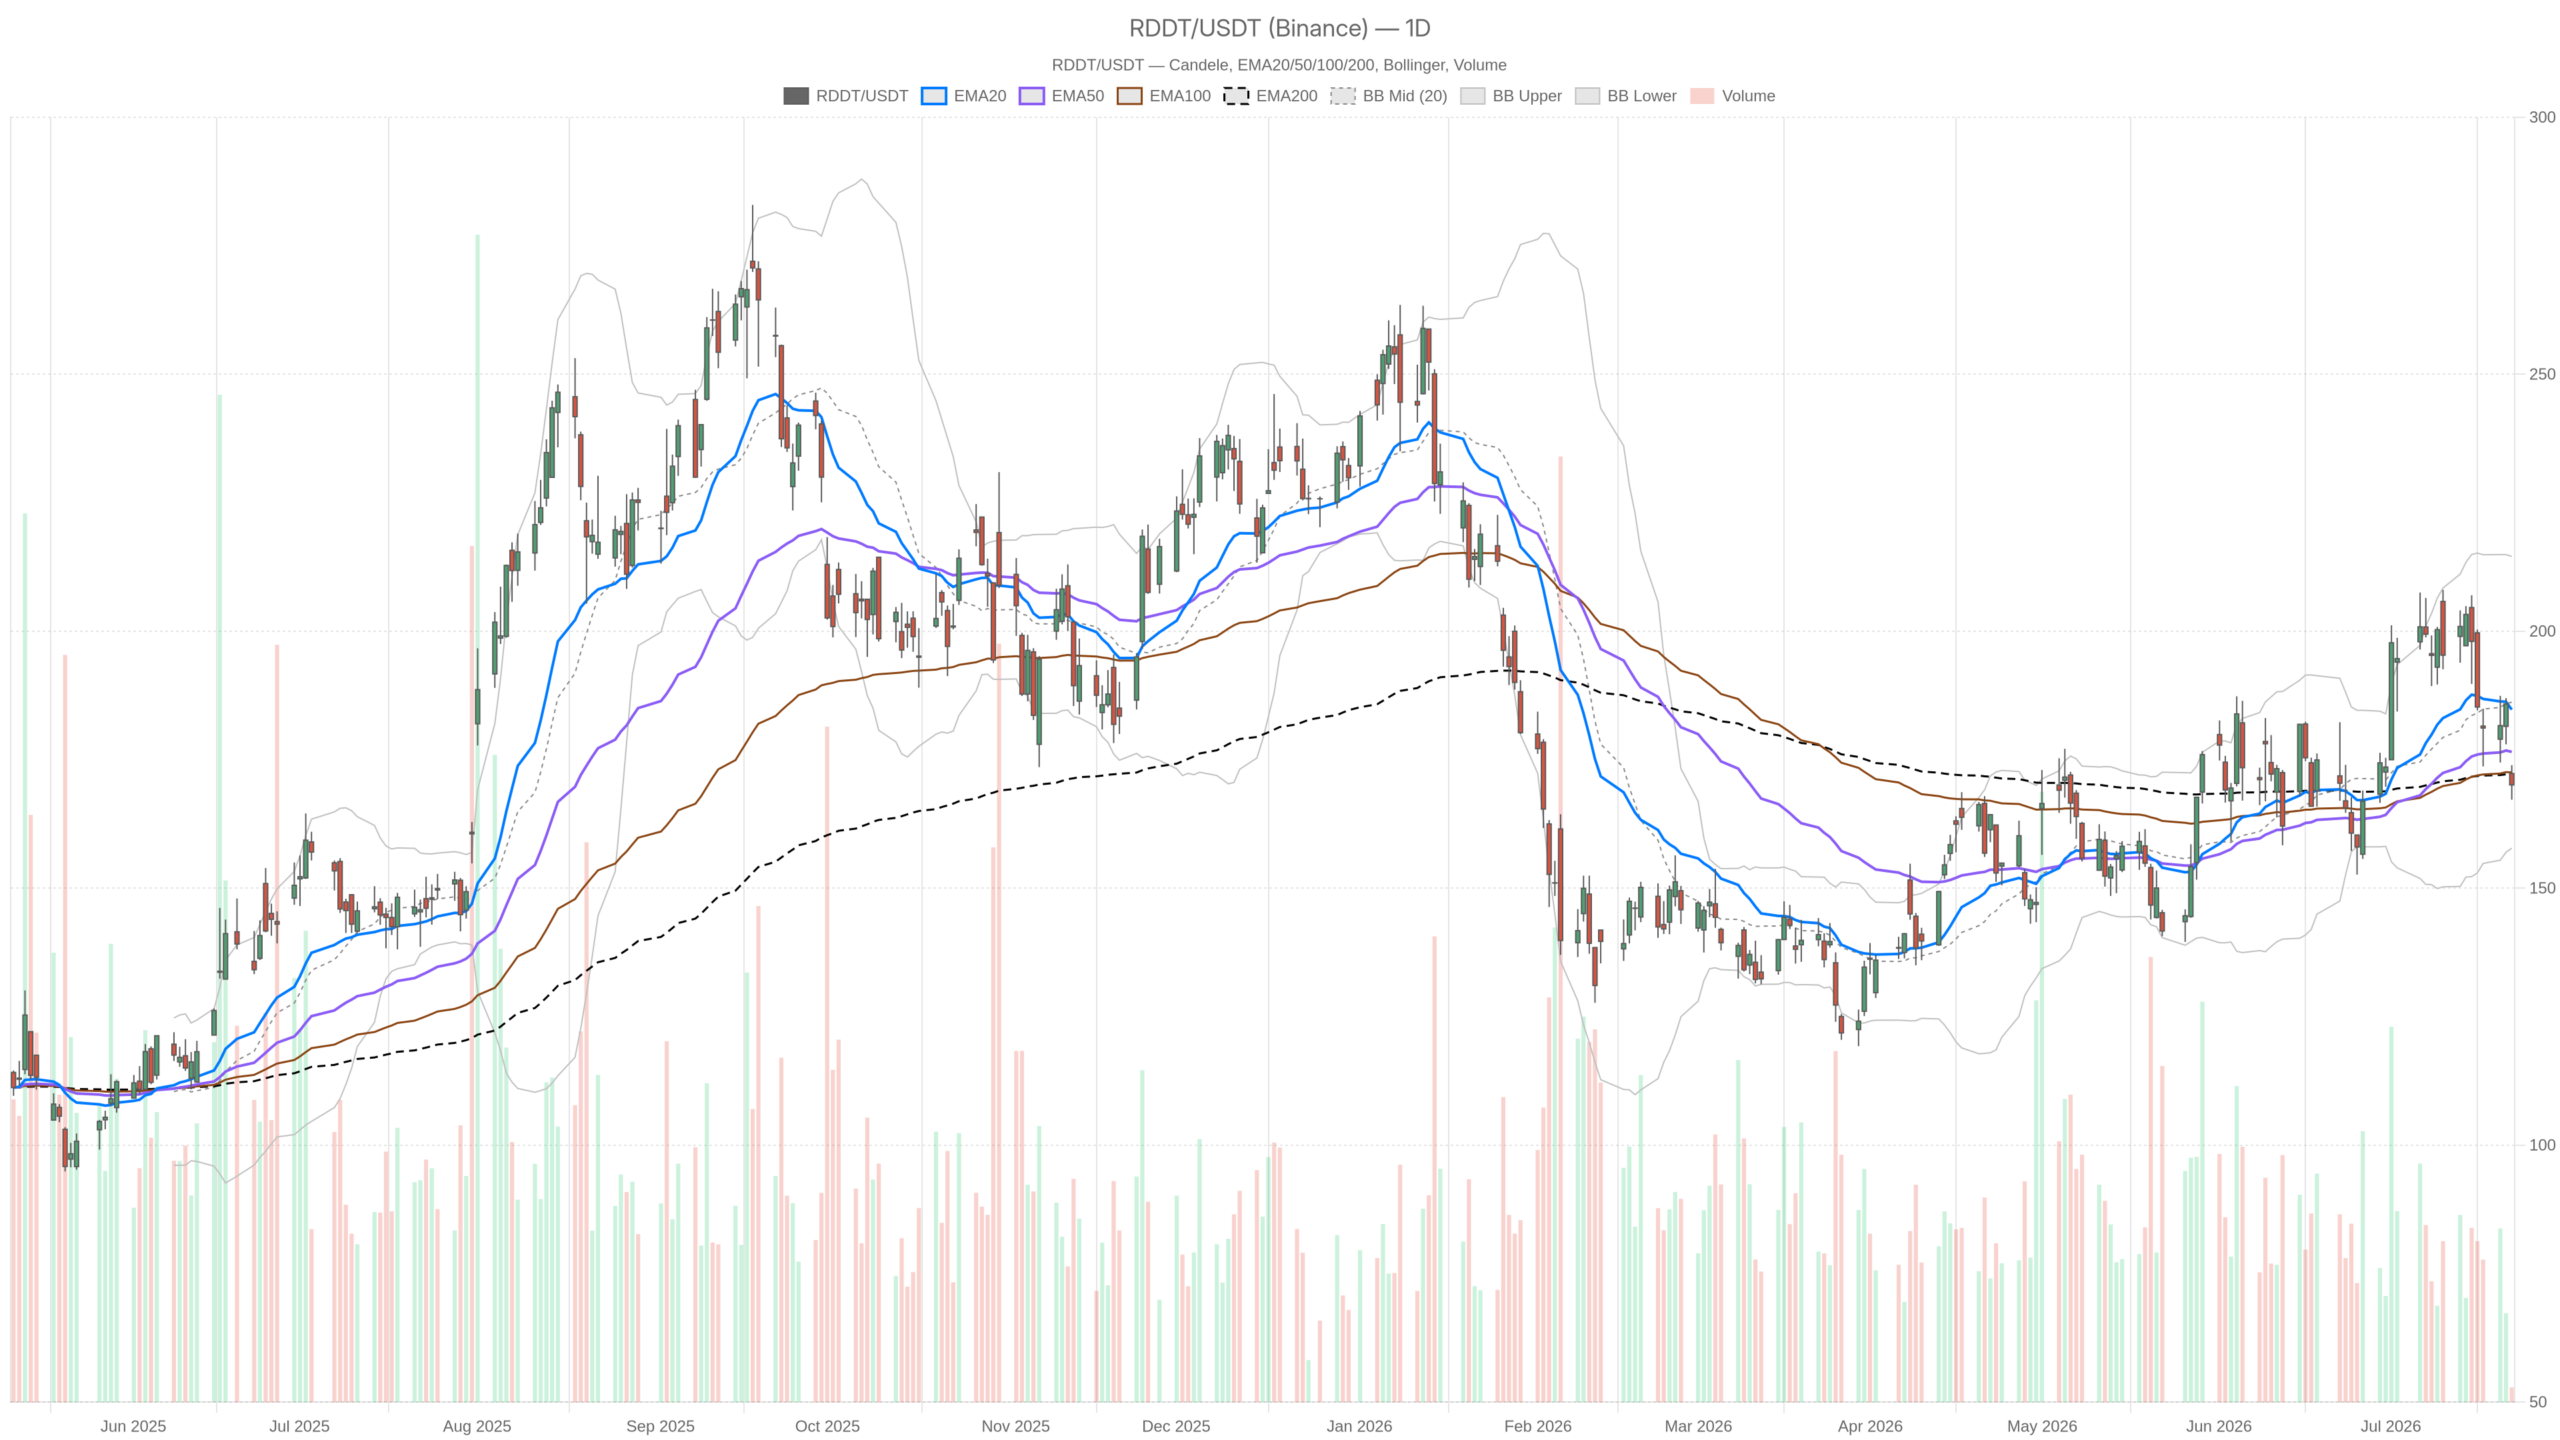
Reddit, Inc. stock closed at $170.10 on July 22, sliding below the daily pivot of $170.42. RDDT now trades beneath all key moving averages. The daily chart signals a steady erosion of bullish momentum — not a collapse, but a setup demanding caution.
Summary
Key takeaways
- RDDT closed at $170.10, below the EMA200 ($172.14), EMA50 ($176.53), and EMA20 ($184.75) — a bearish alignment across all three averages.
- The daily RSI sits at 42.5 and the MACD histogram reads -3.08, confirming that downward momentum is accelerating rather than stabilizing.
- The daily Bollinger lower band at $157.79 represents the next structural floor, with ATR at $12.47 signaling wide daily swings.
- DCF-based analyses suggest a 41% to 47% upside for Reddit, Inc. stock, though market-based multiples paint a more expensive picture.
- CEO Steve Huffman sold 18,000 shares at $181.64 via a prearranged Rule 10b5-1 plan — a price roughly $12 above current levels.
Daily Bias: Bearish Drift Below Key Moving Averages
RDDT is trading below all three exponential moving averages. This configuration typically signals the path of least resistance is lower. Price sits beneath the EMA20 at $184.75, the EMA50 at $176.53, and the EMA200 at $172.14 — a meaningful breakdown across every standard lookback period.
The daily RSI at 42.5 reinforces this view. It is not yet oversold, but it reflects sustained selling pressure without a credible recovery attempt. Meanwhile, the MACD histogram at -3.08 confirms the same dynamic. The signal line at 5.81 runs well above the MACD line at 2.73, and the widening gap indicates downward momentum is accelerating.
The Bollinger Bands add important context. The midline sits at $186.18, and price has broken cleanly below it. The lower band at $157.79 represents the next structural floor on the daily chart. With ATR at $12.47, daily swings remain wide. Any move toward that lower band could materialize quickly if selling continues.
Overall, the daily regime is classified as neutral. However, the weight of evidence tilts bearish. The regime label reflects the absence of a confirmed trend breakdown — not the absence of risk.
Hourly Timeframe: Oversold Conditions Complicate the Bearish Case
The hourly RSI has plunged to 24.12, deep in oversold territory. This does not reverse the daily thesis, but it raises the probability of a short-term technical bounce. Oversold readings at this level often precede at least a temporary relief rally.
However, the hourly MACD remains negative. The line at -2.61 sits below the signal at -2.40, with a histogram of -0.21. The bearish cross is still intact. Price also trades below the 1H EMA20 at $183.85, EMA50 at $187.97, and EMA200 at $183.07. A full stack of resistance sits overhead.
In contrast to the daily picture, the hourly regime is also classified as neutral. The combination of extreme RSI compression and a still-negative MACD creates genuine tension. The tape is stretched to the downside, yet there is no technical evidence of buyers stepping in with conviction. That ambiguity is itself a warning sign for aggressive short entries at current levels.
15-Minute Execution Context: Bearish Regime Confirms Intraday Weakness
The 15-minute regime is explicitly bearish. The RSI has dropped to 20.25 — an extreme reading even on this compressed timeframe. The MACD histogram at -1.48 reflects sharp intraday selling. All three short-term EMAs — 20 at $182, 50 at $183.50, and 200 at $189.73 — are stacked well above current price.
Notably, the 15m pivot sits at $169.97, with S1 at $169.69 and R1 at $170.37. Price at $170.10 is essentially pinned between pivot and R1, unable to reclaim even intraday resistance. This tight compression near support suggests exhaustion rather than accumulation.
For short-term traders, the execution context points to continued selling pressure. Limited immediate upside exists unless price can close back above $170.37 and hold. Even then, the hourly and daily resistance structures remain formidable.
Reddit, Inc. Stock and the Valuation Narrative
Fundamental analysis on Reddit, Inc. stock is genuinely split. Two separate analyses have flagged RDDT as potentially undervalued. One cites a 41% discount, while another points to 47% upside — both based on discounted cash flow models. At the same time, both analyses acknowledge that market-based multiples paint a different, more expensive picture.
The AI initiative is cited as a key growth driver. RDDT’s push into AI-powered tools, platform upgrades, and advertising solutions is reportedly gaining traction through major partnerships. That narrative supports the bullish fundamental case. Still, the stock delivered a 30% return over the past year, meaning much of the optimism may already be priced in at recent levels.
Meanwhile, CEO Steve Huffman sold 18,000 shares at $181.64 through a prearranged Rule 10b5-1 plan. Insider sales via 10b5-1 arrangements are automated and pre-scheduled, reducing their direct informational value. However, the sale occurred at a price nearly $12 above current levels — a gap the stock now needs to recover before the insider narrative turns constructive again.
On July 16, RDDT fell 6.45% in a single session, closing at $185.26. Shares also dropped 3.8% in afternoon trading the same day, after tech sector profit-taking overshadowed a bullish rating from Wedbush. That two-day episode reflects a stock caught between institutional optimism and market-wide momentum headwinds.
Bullish Scenario: What Would Need to Change
For bulls to regain control, RDDT must first reclaim the daily EMA200 at $172.14 and hold above it. That level is the nearest meaningful test. Second, the daily MACD histogram would need to reverse and begin narrowing, signaling that selling momentum is fading. Third, a close above the EMA50 at $176.53 would meaningfully shift the daily structure.
On the fundamental side, any positive catalyst linked to the AI partnership pipeline could serve as the trigger. Stronger-than-expected ad revenue data would have a similar effect. The DCF-based undervaluation thesis provides a floor for long-term investors willing to absorb near-term volatility.
Bearish Scenario: What Would Invalidate the Bull Case
A daily close below the EMA200 at $172.14 would confirm that even long-term trend support has been lost. Current price has already approached this level. The next technical target would shift toward the daily Bollinger lower band at $157.79. With ATR at $12.47, that move could unfold over just a few sessions.
The failure to hold the daily pivot at $170.42 on multiple occasions would reinforce this path. Additionally, any deterioration in the broader tech sector — similar to the July 16 sell-off — could accelerate the move. RDDT has demonstrated clear sensitivity to sector-wide momentum shifts.
Positioning, Volatility, and Final Assessment
Reddit, Inc. stock sits at a technically fragile level. The daily bias is effectively bearish, the hourly is deeply oversold but unconfirmed, and the 15-minute regime is explicitly bearish. That combination does not encourage aggressive long positioning. At the same time, extreme RSI compression across hourly and intraday timeframes means the risk of a sharp short-covering bounce is real.
Therefore, the near-term environment calls for caution on both sides. High ATR on the daily chart means any directional move will carry significant magnitude. Positioning into this kind of technical setup carries outsized uncertainty without a confirmed level reclaim or a clear breakdown below support. The fundamental narrative around AI and ad growth remains compelling in the long run. In the short run, however, the chart is in control.
FAQ
Is Reddit, Inc. stock currently undervalued?
DCF-based analyses suggest a 41% to 47% upside for RDDT, pointing to potential undervaluation. However, market-based multiples tell a different story and appear expensive by conventional metrics. The valuation debate remains genuinely split.
What are the key support levels for RDDT right now?
The immediate support is the daily pivot at $170.42, which price has already tested. Below that, the EMA200 at $172.14 serves as long-term trend support. The next structural floor is the daily Bollinger lower band at $157.79.
Does the CEO’s recent stock sale signal trouble for Reddit?
Not necessarily. CEO Steve Huffman sold 18,000 shares at $181.64 through a prearranged Rule 10b5-1 plan, which automates trades on a preset schedule. This reduces the direct informational value of the sale. Still, the transaction occurred roughly $12 above current levels.
What is the near-term outlook for Reddit, Inc. stock?
The near-term outlook is cautious. The daily bias is bearish, with RDDT trading below all key moving averages. However, deeply oversold readings on the hourly (RSI 24.12) and 15-minute (RSI 20.25) timeframes raise the risk of a sharp short-covering bounce. Without a confirmed reclaim of the EMA200 at $172.14, the path of least resistance remains lower.
Disclaimer: This article is for informational purposes only and does not constitute financial advice, an investment recommendation, or a solicitation to buy or sell any financial instrument or cryptocurrency. The analysis provided is not indicative of future results. Investing in crypto assets and financial markets carries a high risk of capital loss. Always do your own research (DYOR) and consult a qualified financial advisor before making any decision.
Article produced with the assistance of artificial intelligence and reviewed by the editorial team.
