



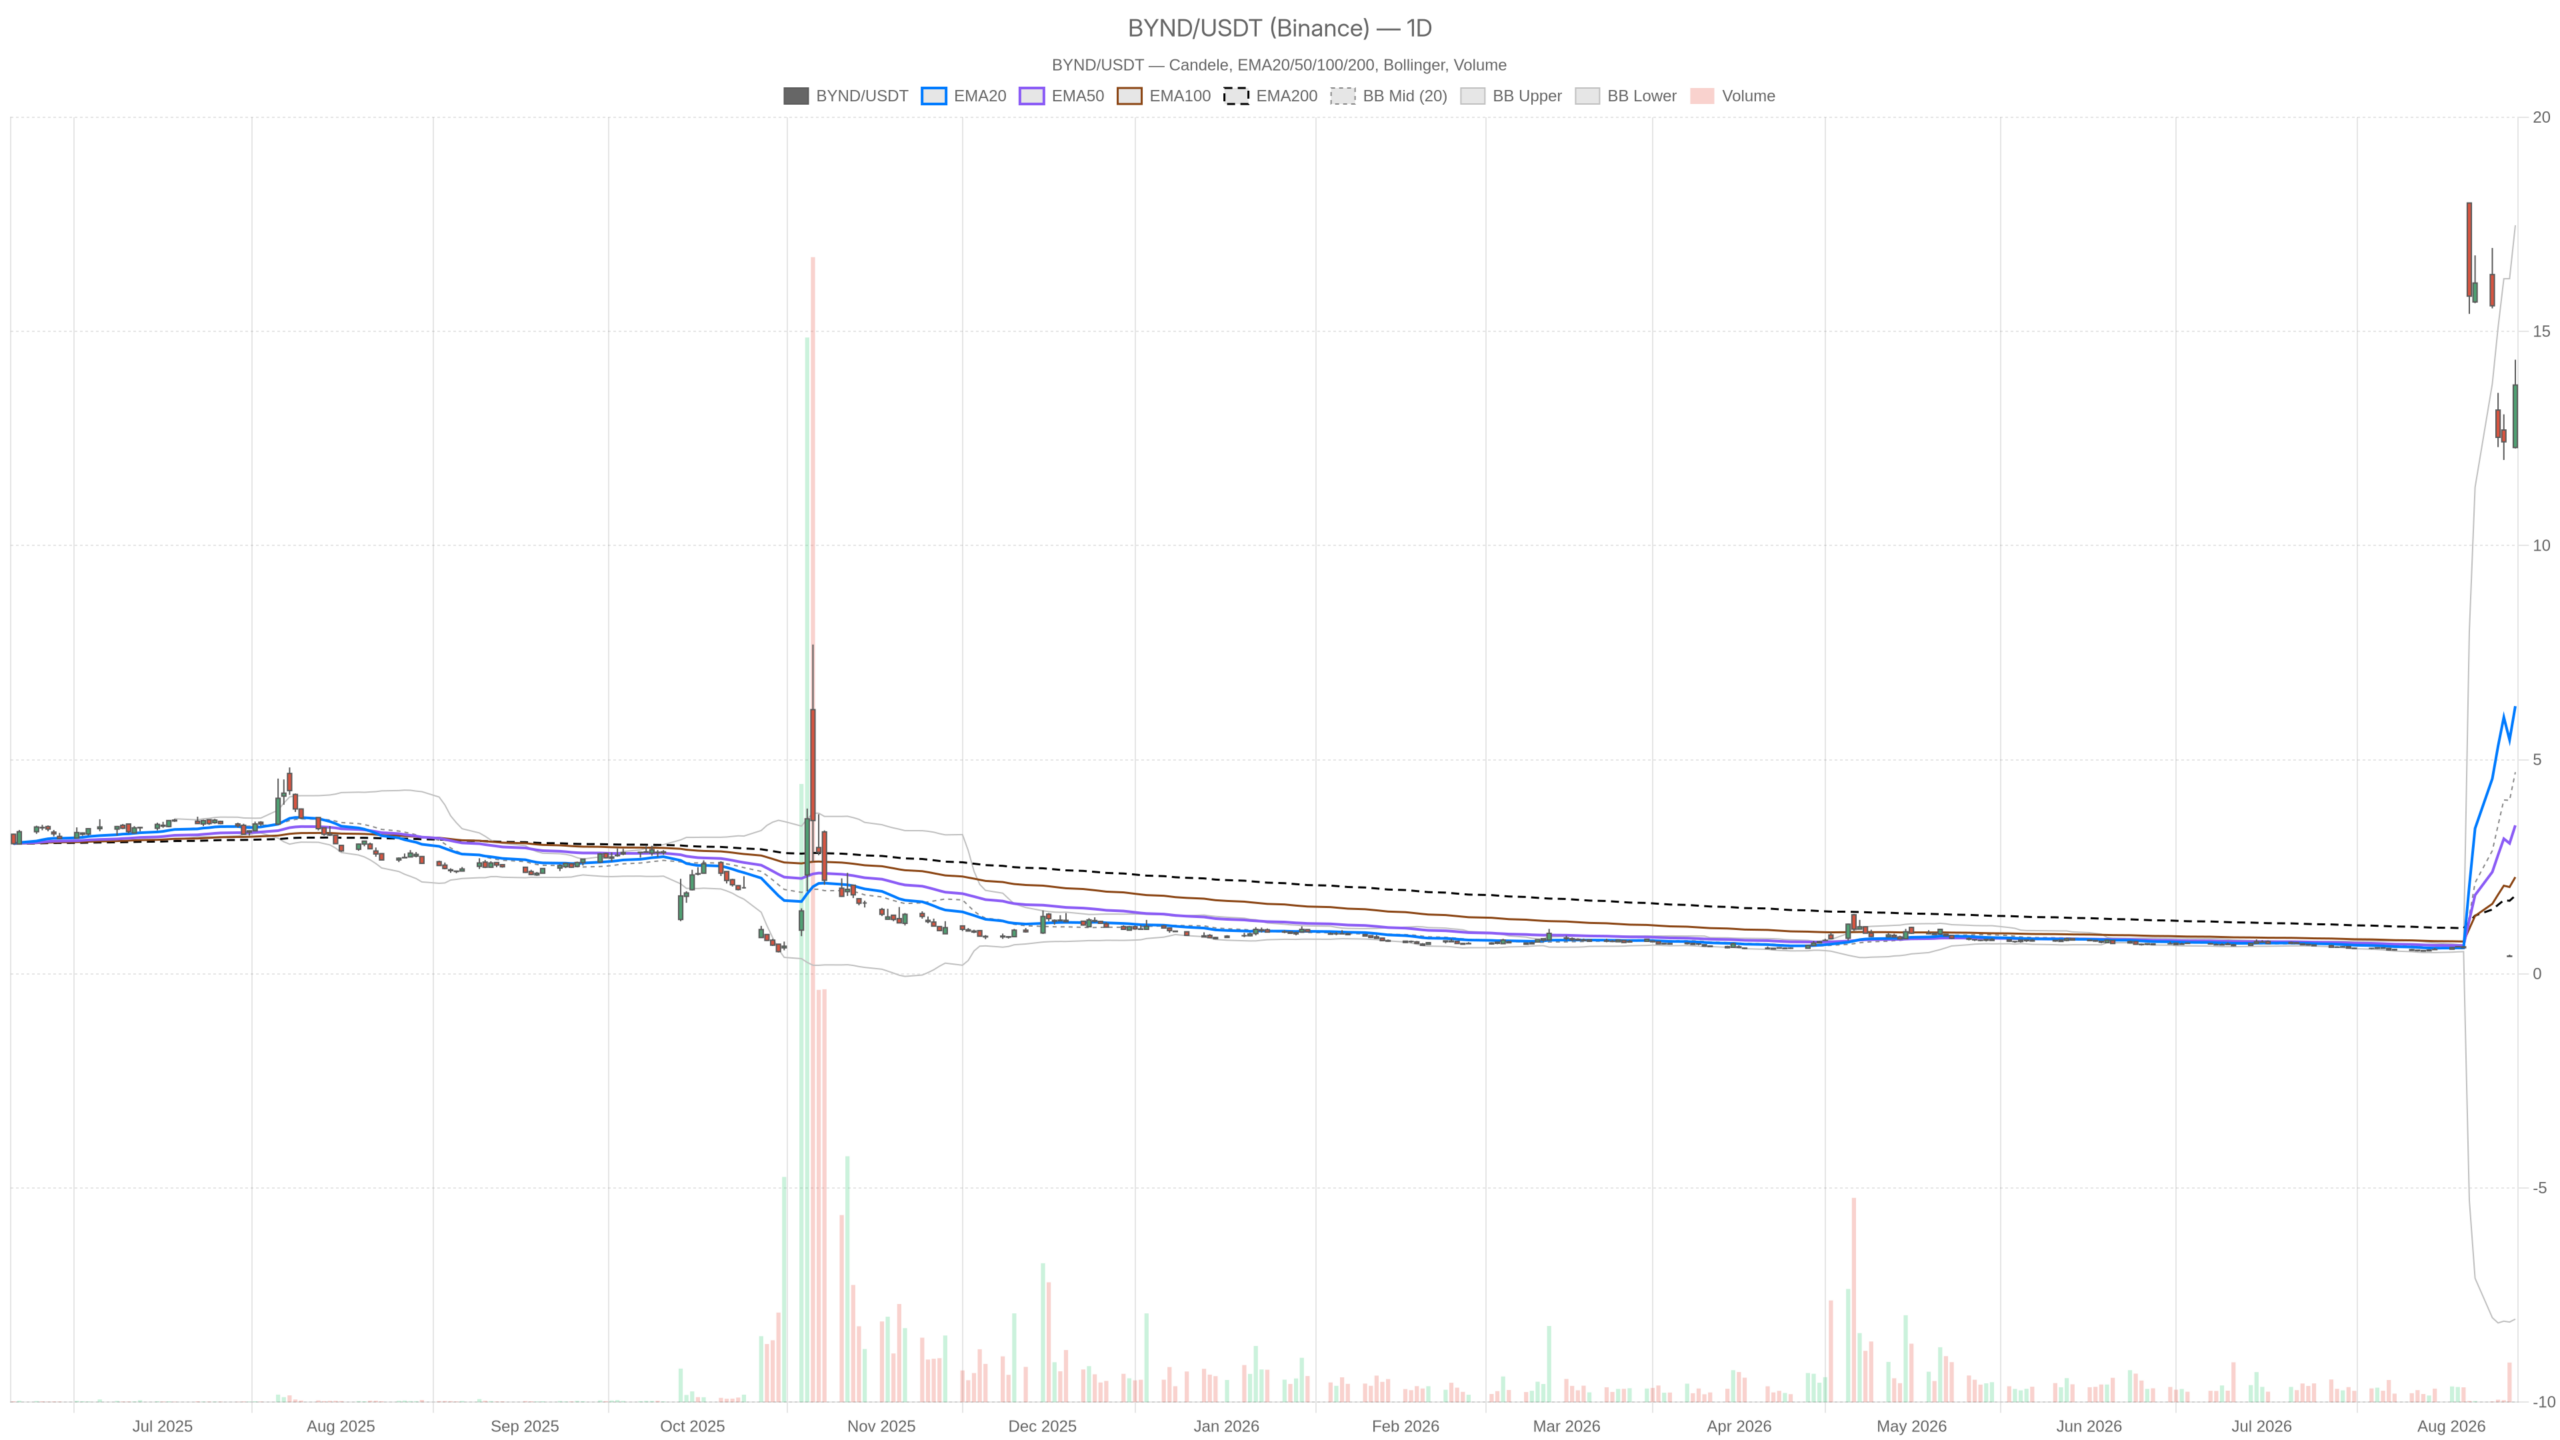
Beyond Meat, Inc. stock presents a genuinely unusual setup. The daily chart shows a clean bullish regime, with price closing at $13.75 after ranging from $12.27 to $14.34. However, shorter timeframes are flashing extreme overbought readings. That tension is the real story behind BYND stock this week.
Summary
Key takeaways
- BYND closed at $13.75 following a reverse split, with daily RSI at 62.24 and MACD signaling bullish momentum still building.
- Intraday overbought extremes are striking: H1 RSI hit 97.99 and 15-minute RSI reached 89.66, warning of near-term exhaustion.
- Daily ATR stands at 3.61, reflecting elevated post-split volatility that demands caution around position sizing.
- Q2 2026 showed a return to profitability with $16.4 million in net income, but Q3 guidance of $60–$65 million implies deceleration.
- The bullish daily structure faces resistance at $14.64, while bearish risk centers on a break below $12.57 support.
Context matters here. On August 11, Beyond Meat announced a 1-for-30 reverse stock split, aimed at restoring compliance with Nasdaq’s minimum bid price rules. That move followed a stretch where BYND, alongside names like APP and ONON, plunged to 52-week lows on weak results, analyst downgrades, and slowing growth concerns. In other words, this rally is unfolding against a backdrop of real structural stress, not a clean uptrend in isolation.
Daily Trend: Bullish Regime, But Built on Fresh Foundations
The daily indicators classify the current regime as bullish, and the raw numbers support that read. RSI14 sits at 62.24, comfortably bullish without being stretched. The MACD line at 2.75 sits above its signal line at 2.10. The positive histogram of 0.65 confirms upward momentum is still building rather than fading.
Price is also trading well above its EMA20 (6.25), EMA50 (3.47) and EMA200 (1.83). Normally that kind of separation signals an extended trend. However, given the recent reverse split, these moving averages are still catching up to the repriced stock. The gap reflects split-driven repricing as much as pure trend strength.
The daily pivot structure is more straightforward. Price closed at $13.75, above the pivot point of $13.45, with resistance at $14.64 (R1) and support at $12.57 (S1). That places BYND in the upper half of its daily range, testing toward resistance rather than defending support.
Volatility Tells Its Own Story
ATR14 on the daily chart reads 3.61, which is enormous relative to a $13.75 share price. That single data point explains a lot. This is a stock still absorbing the shock of its reverse split. The Bollinger Bands reflect that: mid at 4.71, upper at 17.48, lower deep in negative territory at -8.06. Wide, still-adjusting bands like these are typical right after a structural event like a reverse split. They argue for caution around position sizing regardless of directional view.
H1 Confirms the Trend but Warns of Exhaustion
On the 1-hour chart, the regime is also tagged bullish. The MACD reading is even stronger than on the daily: line at 2.90 versus signal at 1.28, with a histogram of 1.62. That is unambiguous short-term momentum.
At the same time, RSI14 on the H1 stands at 97.99. That is about as overbought as a reading gets. Meanwhile, the H1 pivot range is extremely tight. The pivot sits at 13.78, with R1 at 13.80 and S1 at 13.72. The last hourly candle traded in a narrow band right at equilibrium. Therefore, the H1 picture confirms the daily’s bullish direction. However, it simultaneously warns that the move has gotten ahead of itself in the short term.
15-Minute Execution Context
On the 15-minute chart, RSI14 reads 89.66, still deeply overbought. Notably, the MACD histogram has narrowed to just 0.24, down from a wider spread earlier. This suggests momentum is decelerating even as price holds near its highs. It is a classic sign that a short-term pause or pullback may develop before any push toward daily R1 at 14.64. For traders using the 15-minute chart purely for timing entries, this narrowing histogram is worth watching closely. Chasing the extended move carries elevated risk.
Fundamentals Add Nuance to the Beyond Meat, Inc. Stock Narrative
Beyond Meat’s Q2 2026 results add genuine crosscurrents to the technical picture. The company returned to profitability, posting net income of $16.4 million on sales of $68.83 million. It also hired a new COO as part of a broader leadership reshuffle. Yet the stock fell 5.0% following that news, suggesting the market was not fully convinced.
Part of the skepticism likely ties to guidance. Beyond Meat guided third-quarter net revenues to approximately $60 million to $65 million, a step down from the $68.83 million reported in Q2. On the other hand, international retail sales jumped 16.5%, even as the U.S. market faced what the company itself described as persistent headwinds. That split performance—strong abroad, weak domestically—is a genuine fundamental crosscurrent. It mirrors the technical conflict between timeframes.
Bullish Scenario
For the bullish case to extend, BYND needs to hold above the daily pivot at 13.45 and eventually clear resistance at 14.64. A daily RSI still under 65, combined with a rising MACD histogram, leaves room for continuation without immediate exhaustion on that timeframe. Renewed strength in international retail, if it persists, could give bulls a fundamental anchor beyond pure technical momentum. A cooling-off in the overbought H1 and 15-minute readings, without price breaking down, would be a healthy sign. It would suggest the rally is consolidating rather than reversing.
Bearish Scenario
In contrast, the bearish case centers on exactly what the shorter timeframes are already signaling. An RSI near 98 on the H1 and 89.66 on the 15-minute rarely resolves cleanly higher without at least a pause. If price slips back below the daily pivot at 13.45 and loses the $12.57 support level, the recent rally could unwind quickly. The elevated ATR14 reading of 3.61 amplifies that risk. On the fundamental side, the Q3 revenue guidance of $60 to $65 million implies deceleration from Q2’s $68.83 million. That alone could reignite the same growth concerns that drove BYND to 52-week lows earlier in August. Analyst downgrades already flagged in the market suggest sentiment remains fragile beneath the recent bounce.
Closing Take
Overall, Beyond Meat, Inc. stock presents a market where the daily trend is bullish, but the path there has been anything but smooth. The reverse split has reshaped the technical landscape. It inflated volatility readings and left momentum indicators stretched on the shorter timeframes. Meanwhile, the daily structure stays constructive. Fundamentals offer a similarly split picture: a return to profit and international growth on one side, decelerating guidance and lingering downgrade pressure on the other. Given the elevated ATR and extreme overbought H1 and 15-minute conditions, position sizing and patience matter more than usual here. This is a name where volatility, not direction, may be the dominant force in the sessions ahead.
FAQ
What is Beyond Meat’s stock price after the reverse split?
Beyond Meat closed at $13.75 on the daily chart, trading in a session range of $12.27 to $14.34. The stock underwent a 1-for-30 reverse split on August 11 to restore Nasdaq compliance.
Is Beyond Meat stock overbought?
The picture is split by timeframe. The daily RSI at 62.24 remains comfortably bullish and not yet stretched. However, intraday readings are extreme: H1 RSI hit 97.99 and the 15-minute RSI stands at 89.66, both signaling near-term exhaustion risk.
Did Beyond Meat return to profitability?
Yes. Q2 2026 results showed net income of $16.4 million on sales of $68.83 million. However, Q3 guidance of $60 million to $65 million implies a sequential revenue deceleration, which tempered market enthusiasm.
What are the key support and resistance levels for BYND?
The daily pivot sits at $13.45, with resistance at $14.64 (R1) and support at $12.57 (S1). Price closed above the pivot, placing BYND in the upper half of its daily range and testing toward resistance.
Disclaimer: This article is for informational purposes only and does not constitute financial advice, an investment recommendation, or a solicitation to buy or sell any financial instrument or cryptocurrency. The analysis provided is not indicative of future results. Investing in crypto assets and financial markets carries a high risk of capital loss. Always do your own research (DYOR) and consult a qualified financial advisor before making any decision.
Article produced with the assistance of artificial intelligence and reviewed by the editorial team.
