



Apple Inc. stock closed at $323.81, holding a classic daily uptrend. However, an unusual dynamic has surfaced. Its 30-day correlation to the Nasdaq-100 has turned the most inverse since 2005. The stock is now behaving as an AI-trade hedge alongside its bullish technical structure.
Summary
Key takeaways
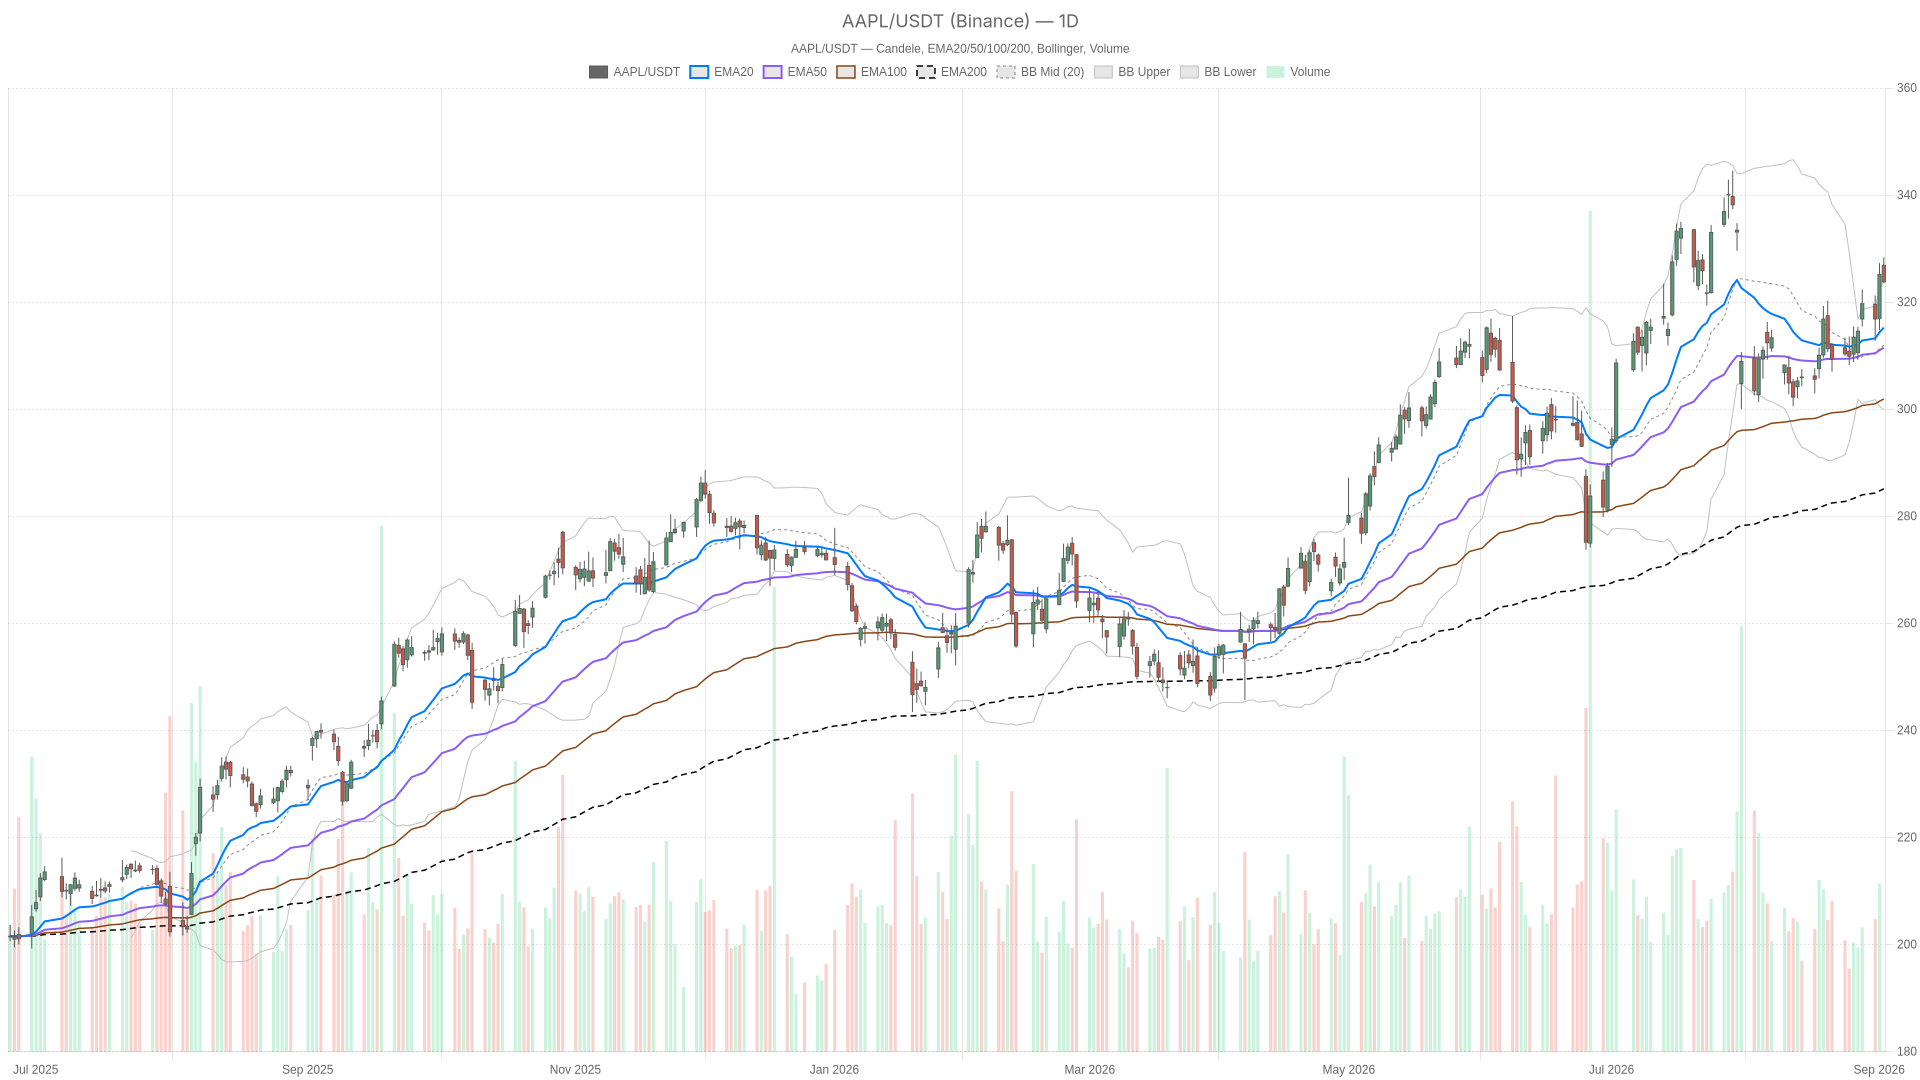
- Apple Inc. stock maintains a bullish daily structure with price above the EMA20 ($315.25), EMA50 ($311.52), and EMA200 ($285.13)
- Daily RSI14 at 59.51 leaves room for further upside before reaching overbought territory near 70
- The 15-minute chart shows a neutral regime with a bearish MACD cross, signaling a short-term pullback inside the larger uptrend
- Apple’s 30-day correlation to the Nasdaq-100 has become the most inverse since 2005, turning the stock into a hedge against AI-trade volatility
- A leadership transition is underway with incoming CEO John Ternus’s fiscal 2027 pay package including a $3 million salary and $55 million stock award target
Daily Trend: Apple Inc. Stock Remains Structurally Bullish
Apple Inc. stock is unequivocally bullish on the daily timeframe. Price sits above all key moving averages, confirming a well-established uptrend rather than a fragile bounce.
On the daily chart, price holds above the EMA20 at $315.25, the EMA50 at $311.52, and the EMA200 at $285.13. That clean bullish stack is reinforced by a bullish regime reading. Meanwhile, the daily RSI14 registers 59.51. This is comfortably in bullish territory but nowhere near overbought extremes near 70, leaving room for further upside.
The MACD line at 1.80 sits well above its signal line at 0.12, producing a histogram of 1.69. This solid positive reading confirms trend strength rather than exhaustion. Notably, daily Bollinger Bands show a midline of $311.96, an upper band at $324.04, and a lower band at $299.88. Price closed essentially at the upper band, signaling strong trending pressure but also warning the move is becoming stretched.
The ATR14 of 6.72 confirms daily ranges remain wide. This is consistent with an asset still in an active directional phase. Pivot levels reinforce the near-term battle zone: the daily pivot at $325.24 sits just above the close, with resistance at $326.93 (R1) and support at $322.11 (S1). Bulls need to reclaim that pivot to keep near-term momentum credible.
1H Timeframe: Confirmation With a Caveat
The hourly chart largely confirms the daily bullish bias. However, momentum indicators suggest intraday buying pressure is cooling even as the broader trend holds.
EMA20 ($320.98), EMA50 ($317.21), and EMA200 ($314.47) remain stacked bullishly on the 1H chart. The regime reading is again bullish, and RSI14 at 60.88 shows healthy, non-extreme buying interest. In contrast to the clean daily momentum, the 1H MACD tells a slightly more cautious story.
The MACD line at 2.76 remains above its signal at 2.35, but the histogram has narrowed to just 0.41. That is a meaningfully smaller gap than the daily chart shows, suggesting intraday momentum is fading. Meanwhile, the 1H Bollinger Bands — midline $320.43, upper $328.96, lower $311.91 — show price comfortably inside the range rather than pressing the upper band. This is a more relaxed positioning than the daily chart’s stretched look.
15-Minute Execution: Short-Term Pullback Inside the Uptrend
The 15-minute chart reveals a short-term pullback, not a trend reversal. The regime flips to neutral here, with momentum indicators pointing to a controlled pause within the larger uptrend.
RSI14 sits at 48.98, essentially at the midpoint and offering no directional edge on its own. More notably, the MACD has crossed bearish intraday: the line at 0.92 sits below its signal at 1.32, producing a negative histogram of -0.41. Price is also trading below its 15m EMA20 ($324.54) while still above the EMA50 ($322.19) and EMA200 ($316.63).
This configuration is consistent with a short-term pullback inside a larger uptrend rather than a trend reversal. The 15m Bollinger Bands are tight — midline $325.31, upper $326.53, lower $324.09 — and price is hugging the lower band. This reinforces the idea of a controlled pause rather than aggressive selling.
In contrast to the daily and hourly charts, this timeframe is purely about timing entries around the $323.17 support (S1) and $324.83 resistance (R1) pivots. It is not about defining the broader trend.
The News Backdrop: Leadership Change and a New Kind of Trade
Two fundamental storylines are shaping sentiment around Apple Inc. stock beyond the charts. First, a leadership transition is underway. Second, the stock is behaving as an AI-trade hedge — a dynamic rarely seen for a mega-cap name like Apple.
Leadership Transition Underway
Incoming CEO John Ternus’s fiscal 2027 pay package includes a $3 million salary and a $55 million stock award target. Meanwhile, Tim Cook moves into a new chairman role valued at $47 million. The Motley Fool notes Cook’s 15-year tenure generated nearly 2,300% in returns, setting a high bar for the new era.
Notably, options-market commentary has flagged that the rally pushed Apple away from a support zone near $310. The stock has moved back toward its late-July record area near $340, giving traders a defined range to work with.
Apple as an AI-Trade Hedge
Arguably more unusual is Apple’s emerging role as an AI-trade hedge. Its historically inverse correlation to the Nasdaq-100 means the stock is attracting flows less for its own growth story. Instead, it serves as a counterweight when tech volatility spikes.
As a result, that dynamic can distort normal technical behavior. Demand may be driven by portfolio hedging rather than pure conviction in Apple’s fundamentals. This makes price action harder to interpret through technical analysis alone.
Bullish Scenario
The bullish case for Apple Inc. stock rests on the daily and hourly trend structures staying intact. A reclaim of the daily pivot at $325.24 would open the door toward R1 at $326.93. Beyond that lies the record-area zone near $340 referenced in recent options commentary.
For this scenario to build conviction, the 15m MACD would need to flip back positive. RSI would need to climb back above 50, confirming the intraday pause has resolved higher. Continued EMA200 support on all timeframes underlines how far the stock would need to fall before the long-term uptrend is genuinely threatened.
Bearish Scenario
The bearish risk starts with a break of daily support at S1 ($322.11). A daily close back below the Bollinger midline at $311.96 would be a more serious warning sign. It would suggest the stretched move toward the upper band has fully unwound.
Therefore, a failure to hold the EMA20 on both the daily ($315.25) and hourly ($320.98) charts would weaken the bullish thesis meaningfully. If the 15m weakness — the bearish MACD cross and sub-50 RSI — spreads into the hourly timeframe, that would be the clearest signal the pullback is becoming something bigger than routine consolidation.
Positioning and Volatility Outlook
Apple Inc. stock remains in a bullish daily trend that the hourly chart largely confirms. However, the 15-minute tape shows a short-term momentum stall. That layered picture is a reminder that not every timeframe needs to agree for a trend to remain valid.
At the same time, the stock’s unusual role as an inverse hedge against AI-trade swings adds uncertainty that pure technical analysis cannot fully capture. With daily ATR at 6.72 pointing to still-elevated volatility and a leadership transition underway, traders should expect price swings to remain wide in both directions.
FAQ
Is Apple Inc. stock still in a bullish trend?
Yes. The daily chart shows price above the EMA20 ($315.25), EMA50 ($311.52), and EMA200 ($285.13) with a bullish regime reading. Daily RSI14 at 59.51 also supports the uptrend without being overbought.
What is the key resistance level for Apple Inc. stock?
The immediate resistance is the daily pivot at $325.24, followed by R1 at $326.93. Beyond that, the late-July record area near $340 serves as the next major zone, as flagged by options-market commentary.
Why is Apple being called an AI-trade hedge?
Apple’s 30-day correlation to the Nasdaq-100 has turned the most inverse since 2005, according to a CNBC analysis. This means the stock is attracting defensive flows as a counterweight when AI-driven tech volatility spikes, rather than purely on its own growth story.
What are the bearish warning signs to watch?
A break below daily support at S1 ($322.11) would be the first warning. A daily close below the Bollinger midline at $311.96 would signal a more serious unwind. The clearest danger signal would be the 15-minute bearish MACD cross spreading into the hourly timeframe.
Disclaimer: This article is for informational purposes only and does not constitute financial advice, an investment recommendation, or a solicitation to buy or sell any financial instrument or cryptocurrency. The analysis provided is not indicative of future results. Investing in crypto assets and financial markets carries a high risk of capital loss. Always do your own research (DYOR) and consult a qualified financial advisor before making any decision.
Article produced with the assistance of artificial intelligence and reviewed by the editorial team.
