




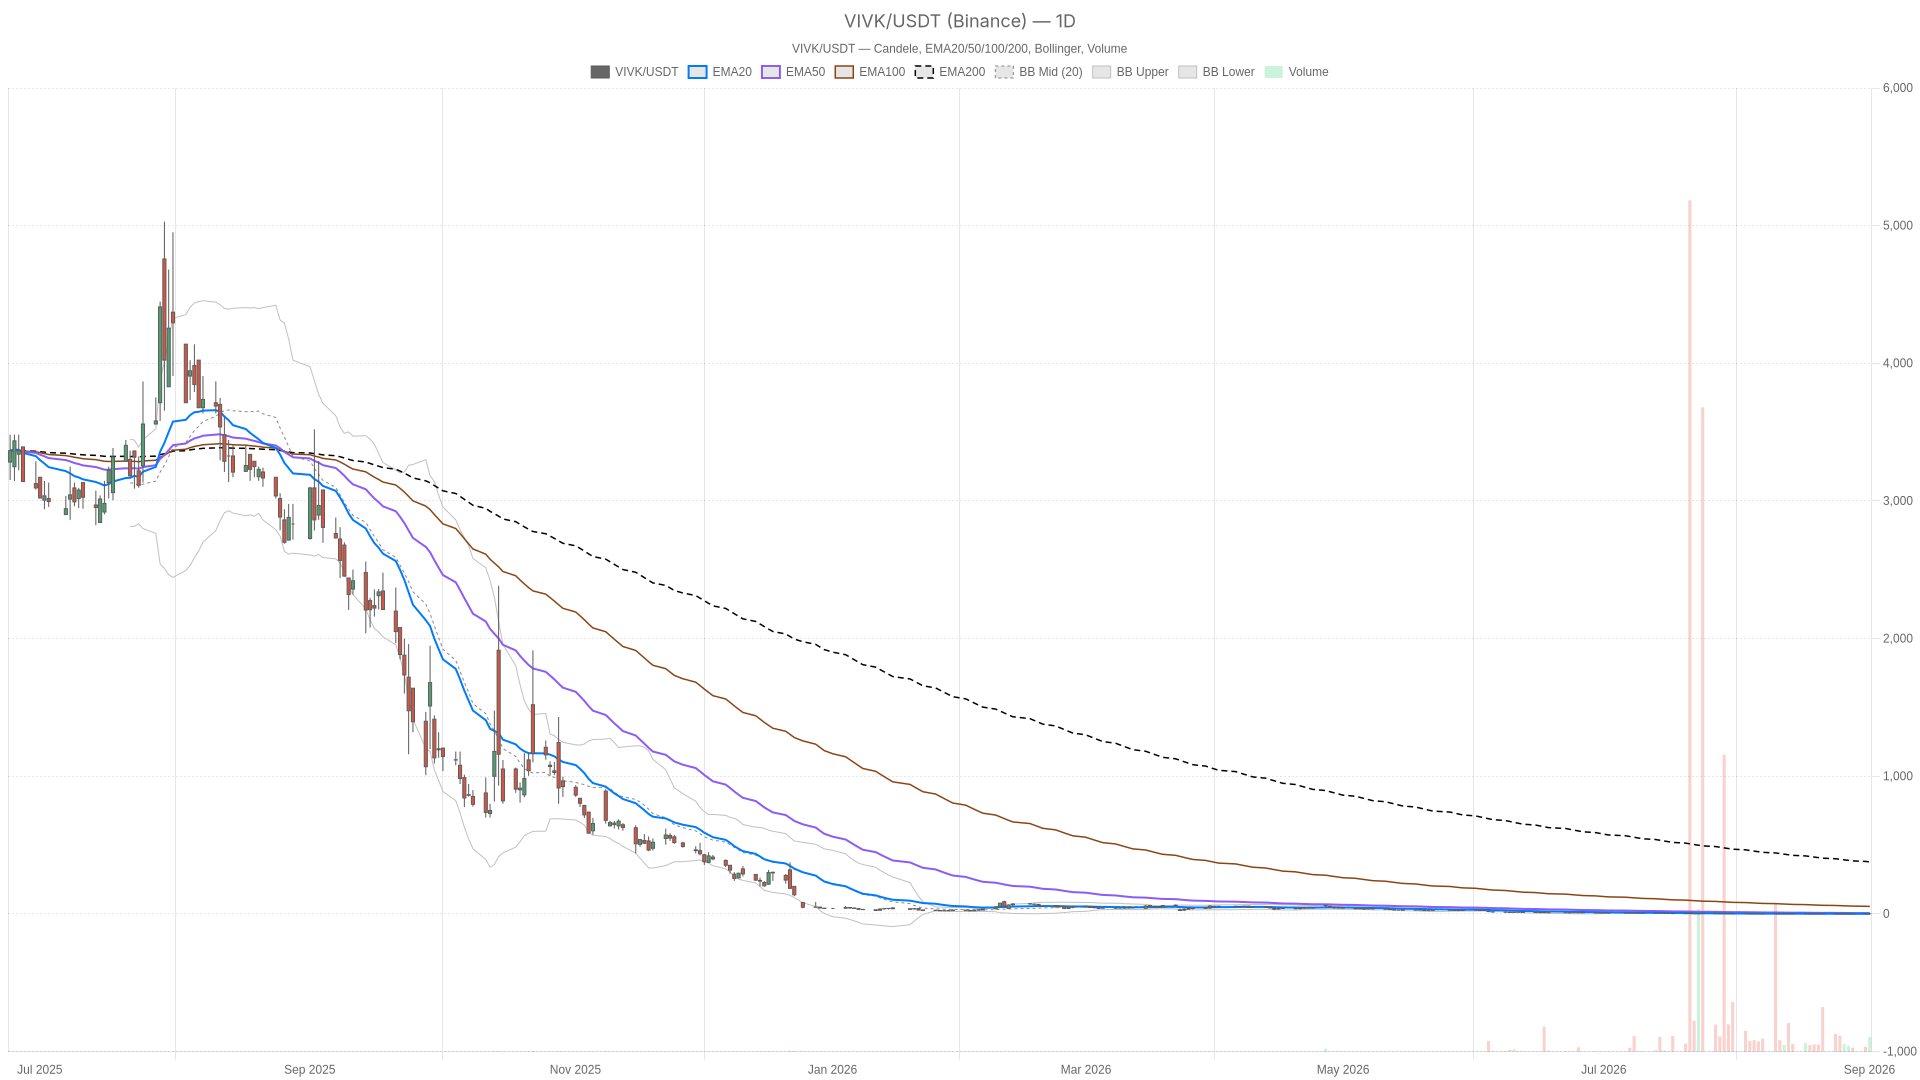
Vivakor, Inc. stock closed at $0.78 on September 1, but the daily chart remains trapped in a deep structural downtrend. Shorter-term charts hint at tentative stabilization. The tension between these timeframes defines the entire setup.
Summary
Key takeaways
- Vivakor, Inc. stock settled at $0.78 with a daily RSI14 of 25.8, deep in oversold territory.
- The daily EMA stack — 20-day at $1.37, 50-day at $6.13, 200-day at $377.72 — confirms a firmly bearish structure.
- The MACD histogram turned positive at 0.23, signaling decelerating downside momentum.
- Shorter-term charts show neutral-to-mildly-bullish conditions, but the 1-hour and daily bearish regimes remain dominant.
- Vivakor’s subsidiary guided for $270 million in Q3 2026 revenue, providing a potential fundamental catalyst.
Vivakor, Inc. Stock Daily Chart: Oversold Within a Bearish Structure
The daily chart for Vivakor, Inc. stock is unambiguously bearish. However, deeply oversold momentum readings suggest a short-term relief bounce could still emerge within the larger downtrend.
EMA Stack Defines the Downtrend
The EMA structure tells the real story. The 20-day EMA sits at $1.37. The 50-day EMA is at $6.13. Meanwhile, the 200-day EMA stands at an extraordinary $377.72. That gap between price and the longer moving averages reflects a collapse of historic proportions relative to where the stock traded in the recent past. Vivakor, Inc. stock currently trades at a small fraction of its 200-day average. This alone frames the daily regime as firmly bearish.
Price settled at $0.78 after ranging between $0.67 and $0.81. Volume reached roughly 2.45 million shares. These levels underscore the stock’s diminished standing relative to its moving averages.
Momentum and Volatility Signals
RSI14 stands at 25.8, deep in oversold territory. This level often precedes short-term relief bounces, even within a larger downtrend. At the same time, the MACD line at -0.86 versus a signal line of -1.09 still points lower overall. However, the histogram has turned positive at 0.23. That is a subtle but real signal: downside momentum is decelerating, even if it has not reversed.
Bollinger Bands reinforce the same idea. Price sits near the $0.69 lower band. The midline is at $1.12 and the upper band at $1.56. This is consistent with a stretched, oversold daily condition. Notably, daily ATR14 of $0.12 confirms this is a volatile name relative to its price. Pivot levels sit at $0.75 for the pivot point, $0.84 for R1, and $0.70 for S1. A reclaim of $0.84 would be an early sign of strength. A break of $0.70 would open the door to retesting the recent $0.67 low.
How the 1-Hour Chart Confirms — and Complicates — the Daily Bias
The 1-hour chart keeps the bearish regime label but shows notably calmer internal readings. This suggests the aggressive selling visible on the daily chart has paused, at least temporarily.
Price sits at $0.78, essentially in line with the 20-period EMA at $0.79. However, the 50-EMA at $0.87 and the 200-EMA at $1.72 both sit well above current price. This confirms a bearish stack on this timeframe as well. RSI14 at 44.58 is neutral rather than oversold. The MACD line and signal line both hover near -0.04. The histogram reads zero. In short, hourly momentum has flattened out rather than accelerating in either direction.
That flattening matters. It signals the selling pressure has paused on the hourly timeframe. Bollinger Bands show price sitting almost exactly at the $0.79 midline. The upper band is at $0.92 and the lower band at $0.67. Pivot levels are tight: the pivot point at $0.77, R1 at $0.80, and S1 at $0.75. Therefore, the 1-hour chart does not invalidate the daily bearish bias. Still, it softens the picture. It describes consolidation rather than continued acceleration lower.
Vivakor, Inc. Stock on the 15-Minute Chart: Execution Signals
The 15-minute chart shifts toward neutral, with price pressing higher. It describes a classic short-term bounce layered on a much larger daily downtrend.
Price closed at $0.78, above both the 20-EMA at $0.75 and the 50-EMA at $0.77. It remains below the 200-EMA at $0.88. RSI14 at 58.16 leans mildly bullish. Meanwhile, the MACD line at 0.01 sits just above its signal line of 0. This produces a small positive histogram of 0.01. Bollinger Bands show price pressing toward the $0.80 upper band, above the $0.73 midline.
The 15-minute pivot point at $0.77 defines a very narrow intraday range. R1 sits at $0.79 and S1 at $0.76. In other words, the execution picture is constructive for a bounce attempt. However, the broader structure above remains a significant overhead constraint. The daily EMA stack, in particular, limits the upside potential.
Fundamental Backdrop: Revenue Guidance Adds a Wildcard
Fundamental news around Vivakor, Inc. stock is notably positive. However, the stock’s technical setup will likely dictate near-term price action regardless of the fundamental narrative.
According to Seeking Alpha, Vivakor’s subsidiary is guiding for $270 million in Q3 2026 revenue from crude oil marketing. This would push year-to-date revenue to roughly $313 million. That kind of rapid scale-up in the underlying business is a meaningful fundamental data point. Notably, it stands in contrast to the technically damaged daily chart. On the other hand, markets do not always react instantly to guidance. The stock’s technical structure will likely remain the primary near-term driver.
Bullish Scenario
The bullish case rests on the daily oversold RSI reading combined with the improving MACD histogram. The revenue guidance provides a potential catalyst for upside follow-through.
A move back above the daily pivot at $0.75 and then through R1 at $0.84 would be an early technical confirmation. Beyond that, reclaiming the 1-hour 50-EMA at $0.87 would be significant. It would signal that stabilization on shorter timeframes is translating into genuine daily-level strength. The revenue guidance provides a fundamental catalyst that could support such a move. Follow-through volume confirming buyer interest above these pivot levels would strengthen the case further.
Bearish Scenario
The daily EMA stack remains the dominant bearish argument. Any bounce faces heavy technical resistance well above the current price level.
With the 20, 50, and 200-day EMAs all sitting dramatically above current price, resistance is stacked. A failure to hold daily S1 at $0.70 would be a warning sign. A subsequent break of the $0.67 daily low would invalidate the relief-bounce thesis entirely. In that scenario, the neutral tone on the 15-minute chart would likely fade quickly. It would realign with the broader bearish daily and hourly regimes. The fundamental catalyst would then take a back seat to deteriorating technicals.
Closing Take
Vivakor, Inc. stock sits at a genuine inflection point across timeframes. Disciplined attention to $0.70 and $0.84 will likely matter more than any single indicator in the sessions ahead.
The daily chart is oversold within a deeply bearish structure. The hourly chart shows momentum flattening rather than reversing. Meanwhile, the 15-minute chart displays a modest bounce attempt. Positioning here requires acknowledging that volatility, reflected in the daily ATR of $0.12, remains elevated relative to price. At the same time, the fundamental backdrop adds a layer of uncertainty. The subsidiary’s $270 million Q3 2026 revenue guidance cannot be dismissed. Given the conflicting signals across timeframes, the daily pivot levels will likely define the near-term outcome.
FAQ
Is Vivakor, Inc. stock in a bearish or bullish trend?
The daily chart for Vivakor, Inc. stock is firmly bearish. The 20-day EMA at $1.37, 50-day EMA at $6.13, and 200-day EMA at $377.72 all sit well above the current $0.78 price. Shorter-term timeframes show neutral-to-mildly-bullish signals. However, the dominant daily regime remains bearish and defines the broader trend context.
What are the key price levels to watch for Vivakor, Inc. stock?
The daily pivot point at $0.75 and R1 at $0.84 are the key resistance levels to monitor. On the downside, S1 at $0.70 and the recent low at $0.67 serve as critical support. A reclaim of $0.84 would signal emerging strength. Conversely, a break below $0.67 would invalidate the relief-bounce thesis entirely.
What fundamental catalysts exist for Vivakor, Inc. stock?
Vivakor’s subsidiary has guided for $270 million in Q3 2026 revenue from crude oil marketing. This would push year-to-date revenue to roughly $313 million. The rapid scale-up provides a potentially significant fundamental catalyst. However, the stock’s technical setup remains the primary driver of near-term price action.
What does the oversold RSI reading mean for Vivakor, Inc. stock?
The daily RSI14 at 25.8 sits deep in oversold territory. Readings at this level often precede short-term relief bounces, even within a larger downtrend. Combined with the MACD histogram turning positive at 0.23, the signal points to decelerating downside momentum. A full trend reversal has not yet been confirmed.
Disclaimer: This article is for informational purposes only and does not constitute financial advice, an investment recommendation, or a solicitation to buy or sell any financial instrument or cryptocurrency. The analysis provided is not indicative of future results. Investing in crypto assets and financial markets carries a high risk of capital loss. Always do your own research (DYOR) and consult a qualified financial advisor before making any decision.
Article produced with the assistance of artificial intelligence and reviewed by the editorial team.
