




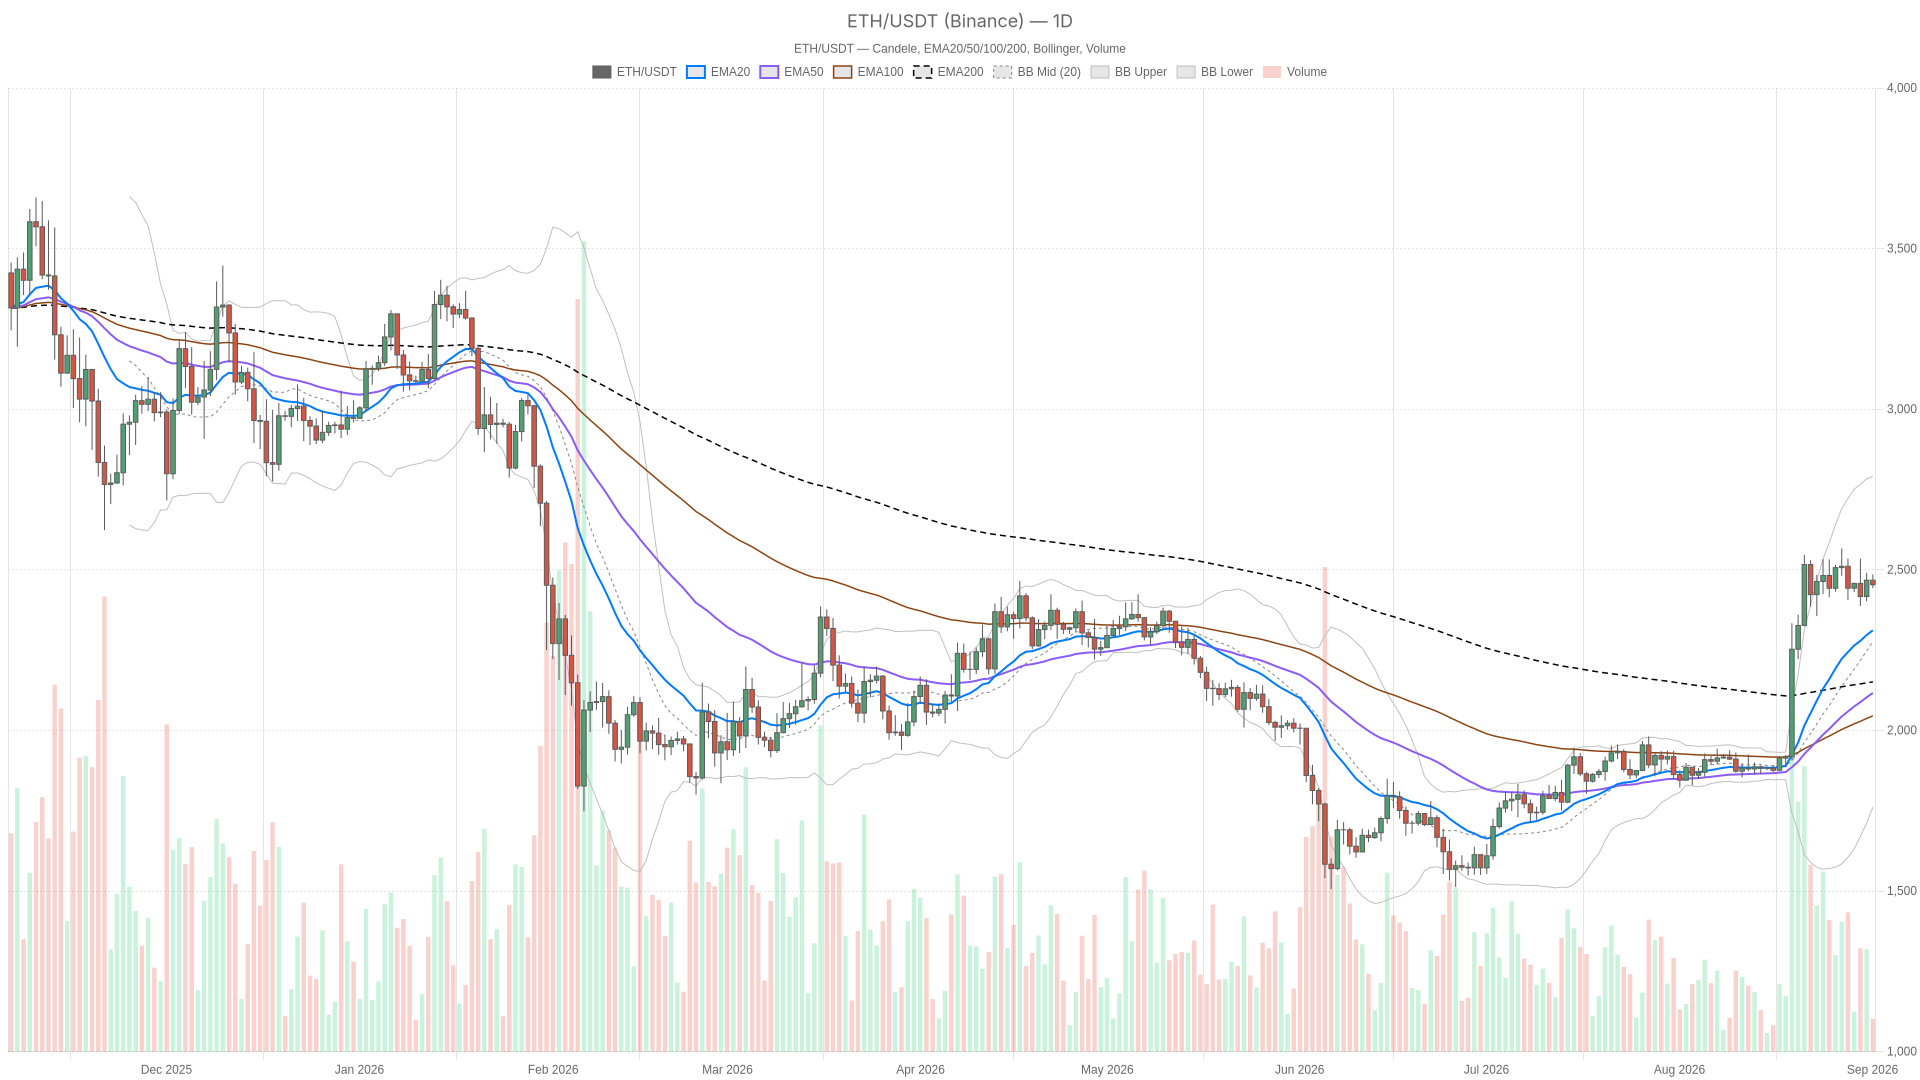
As of September 1, 2026, Ethereum price today sits at $2,453.36, wedged between a still-intact bullish structure and a short-term momentum stall. The bigger picture and the immediate picture are now telling slightly different stories.
Summary
Key takeaways
- Ethereum trades at $2,453.36 with the daily EMA20 ($2,311.74) above the EMA200 ($2,151.03) above the EMA50 ($2,116.73), confirming a structurally bullish trend.
- Short-term momentum is fading: the 1H RSI has dropped to 44.72 and the MACD histogram sits at -2.36.
- The Fear & Greed Index reads 69 (Greed) despite a 2.94% contraction in total crypto market capitalization over 24 hours.
- Uniswap V4 fees surged 116.22% in a single day, while Curve DEX fees collapsed 89.09% over the same period.
The broader crypto market is not clarifying things. Total market capitalization sits around $2.62 trillion after a 24-hour drop of roughly 2.94%, even as the Fear & Greed Index reads 69 — squarely in Greed territory. That is a contradiction worth flagging: sentiment has not caught up with the pullback yet.
This disconnect sometimes precedes a deeper flush and sometimes just reflects a market pausing before its next leg. Bitcoin dominance at roughly 59.6% also suggests capital remains concentrated in BTC rather than rotating aggressively into ETH and altcoins, which tempers any purely bullish read on Ethereum’s setup.
What the Daily Chart Reveals About ETH
On the daily timeframe, the trend structure remains constructive. Price at $2,453.36 trades above the EMA20 at $2,311.74, which sits above the EMA200 at $2,151.03, which sits above the EMA50 at $2,116.73. This structure reflects a market where the longer-term average (EMA200) has moved above the intermediate average (EMA50), a pattern that requires close monitoring for trend confirmation.
RSI14 on the daily sits at 67.41, strong without being overbought. It reflects a market grinding higher with real conviction, yet not at euphoric extremes that typically precede sharp corrections.
The MACD tells a more nuanced story, however. The MACD line at 143.29 and signal line at 143.4 are essentially identical, with a histogram of just -0.11. That is about as flat as momentum gets — it confirms neither further upside nor an imminent reversal. This is the daily chart’s way of saying pause, not reverse.
Bollinger Bands add useful context. Price sits above the mid-band at $2,276.07 with plenty of room before the upper band at $2,791.15, while the lower band rests at $1,760.99. That wide gap reflects elevated volatility, which the ATR14 of 135.18 confirms. This is not a quiet market, and swings of that magnitude deserve respect in any positioning decision.
Daily pivot levels frame the immediate battle zone: the pivot point sits at $2,460.77, with resistance at $2,478.09 (R1) and support at $2,436.03 (S1). Price closing just under the pivot at $2,453.36 is a subtle tell — the market is testing that pivot from below rather than confidently holding above it. This lines up with the momentum stall visible in the MACD.
Where the Hourly and 15-Minute Charts Disagree
On the 1H chart, price at $2,452.91 has slipped below both the EMA20 at $2,465.04 and EMA50 at $2,462.46, though it still holds above the EMA200 at $2,449.97 — barely. RSI on the hourly has dropped to 44.72, and the MACD histogram is solidly negative at -2.36, with the MACD line at 1.04 already below the signal line at 3.4. That is a short-term momentum fade, plain and simple.
The 15-minute chart does not improve the picture. Price at $2,452.38 trades below the EMA20 at $2,461.44 and EMA50 at $2,465.61, essentially glued to the EMA200 at $2,460.7. RSI at 40.03 and a MACD histogram of -2.02 confirm sellers hold the upper hand in the immediate term. While the daily chart still wears a bullish structure, both shorter timeframes show a market losing steam right into resistance — a higher timeframe uptrend digesting a short-term pullback that needs close monitoring.
On-Chain Activity Tells a Different Story
Away from price action, Ethereum’s DeFi ecosystem shows interesting rotation. Uniswap V4 fees jumped 116.22% in a single day and are up 153.89% over 30 days, while Fluid DEX posted an even sharper 215.88% one-day spike and a 122.38% monthly gain, per DefiLlama-tracked fee data.
Uniswap V3 fees rose 82.55% over 30 days despite a rough 7-day stretch of -42.28%. Curve DEX fees, however, collapsed — down 89.09% over seven days and 37.04% over the month. That marks a real shift in where trading activity concentrates on Ethereum’s rails. Fundamentals like this do not move price directly, but they matter for the medium-term thesis that the network’s activity base is still expanding.
Bullish Scenario
If ETH can reclaim the daily pivot at $2,460.77 and hold above the H1 EMA200 at $2,449.97, the path toward R1 at $2,478.09 opens up. From there, a retest of the upper Bollinger structure becomes plausible given the still-bullish EMA stack on the daily chart. This scenario requires the H1 MACD to flip positive and RSI to climb back above 50 — without that, any push higher risks being another failed attempt at resistance. The bullish case is invalidated if price cannot reclaim the $2,449–2,460 zone and instead breaks decisively below the H1 EMA200.
Bearish Scenario
A break below the daily S1 support at $2,436.03 would confirm that the short-term weakness on the 1H and 15m charts is bleeding into the bigger picture. In that case, the next real test becomes the daily EMA20 around $2,311.74. A pullback of that size would still keep the broader uptrend technically alive but would represent a meaningful give-back of recent gains. This bearish scenario loses credibility if price reclaims the $2,460–2,478 pivot zone with RSI and MACD turning back up across the shorter timeframes.
Positioning and Risk
Right now, Ethereum price today reflects a market caught between a still-intact daily uptrend and a short-term momentum fade that should not be ignored. The daily EMA structure and RSI still favor buyers on a bigger-picture basis.
However, the flattening MACD, combined with clearly bearish momentum on the 1H and 15m charts, means this is not a moment for complacency in either direction. The ATR readings across all three timeframes confirm elevated volatility, and the broader market’s 24-hour contraction alongside a Greed reading of 69 adds another layer of uncertainty.
Anyone tracking this setup should weigh the conflicting signals across timeframes rather than anchoring to a single indicator. Size any exposure with the understanding that both bullish and bearish paths remain live until price commits to one side of the pivot structure.
FAQ
What is Ethereum’s price today and what is the overall trend?
As of September 1, 2026, ETH trades at $2,453.36. The daily chart maintains a bullish structure with the EMA20 ($2,311.74) above the EMA200 ($2,151.03) above the EMA50 ($2,116.73), a pattern that reflects the current market positioning. Momentum indicators on shorter timeframes, however, are flashing caution.
Is short-term momentum turning bearish for ETH?
On the 1H chart, RSI14 has dropped to 44.72 and the MACD histogram is negative at -2.36, with price below both the EMA20 and EMA50. The 15-minute chart shows similar weakness. This suggests sellers hold the upper hand in the immediate term, even as the daily trend remains constructive.
What are the key support and resistance levels to watch?
The daily pivot sits at $2,460.77, with R1 resistance at $2,478.09 and S1 support at $2,436.03. A break below S1 would open the path toward the daily EMA20 at $2,311.74. Reclaiming the pivot zone could set up a retest of the upper Bollinger Band near $2,791.
How is Ethereum’s DeFi activity performing?
Uniswap V4 fees surged 116.22% in a single day and Fluid DEX posted a 215.88% spike, suggesting active trading on the network despite price consolidation. Curve DEX fees, however, dropped 89.09% over seven days, indicating rotation rather than uniform growth across the ecosystem.
Disclaimer: This article is for informational purposes only and does not constitute financial advice, an investment recommendation, or a solicitation to buy or sell any financial instrument or cryptocurrency. The analysis provided is not indicative of future results. Investing in crypto assets and financial markets carries a high risk of capital loss. Always do your own research (DYOR) and consult a qualified financial advisor before making any decision.
Article produced with the assistance of artificial intelligence and reviewed by the editorial team.
