




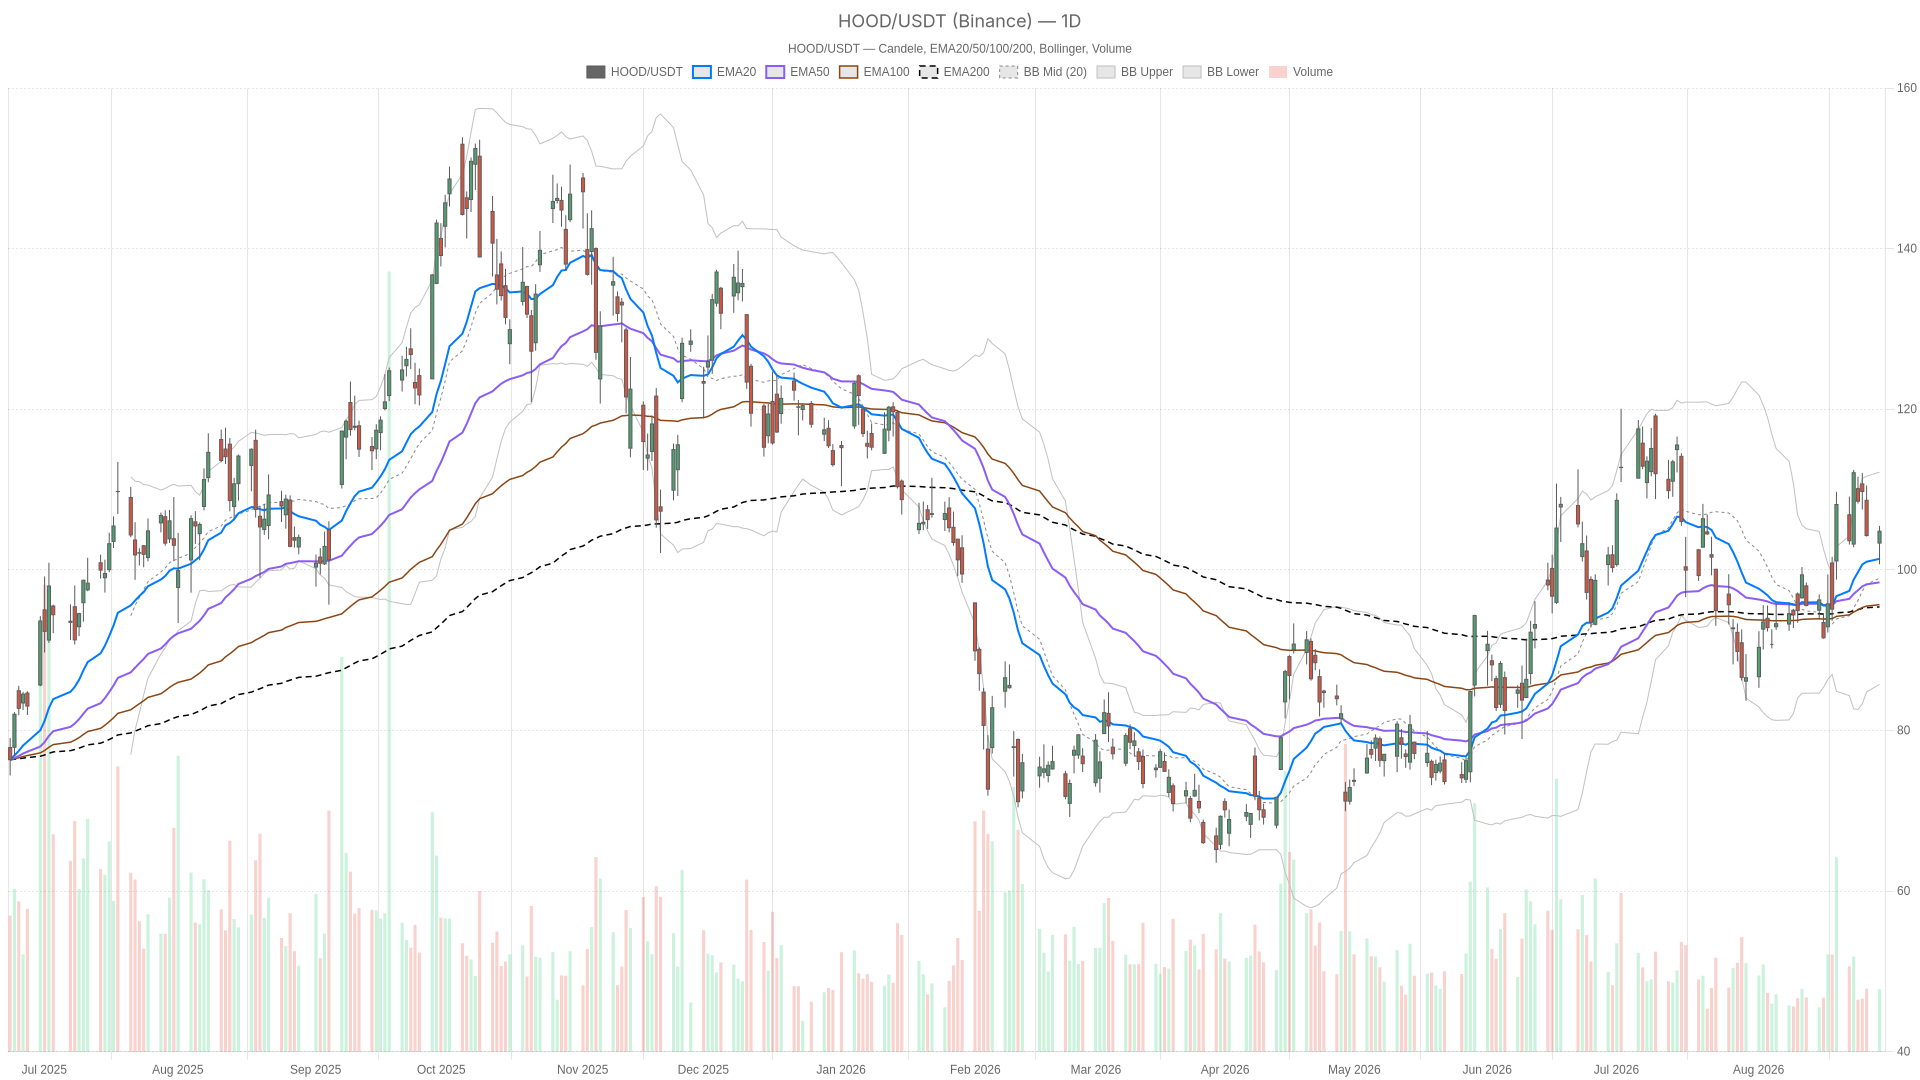
Robinhood stock enters the new session with a clear split across timeframes. The daily chart points higher, closing at $104.81 above every major moving average. Meanwhile, hourly momentum has turned negative. That tension between a strong daily trend and a tired hourly structure is the central story.
Summary
Key takeaways
- Robinhood stock closed at $104.81, above the daily EMA20 at $101.37, the EMA50 at $98.44, and the EMA200 at $95.38.
- The daily RSI14 reads 54.6, and the daily MACD histogram is positive at 1.22.
- Hourly momentum is cooling, with RSI14 at 45.76 and a negative MACD histogram of -0.2.
- Bullish continuation hinges on reclaiming $105.64 and clearing R1 at $106.62.
- Bearish risk grows if price breaks below S1 at $101.84 and the daily EMA20 at $101.37.
Robinhood Stock Daily Uptrend Still Holds
The daily uptrend in Robinhood stock (HOOD) remains intact. Price closed at $104.81, above every major moving average.
That close came after a high of $105.47. The stock sits comfortably above the EMA20 at $101.37, the EMA50 at $98.44, and the EMA200 at $95.38. This stacked moving-average alignment is a textbook bullish setup. It confirms the broader regime tagged as bullish in the data.
At the same time, momentum supports that picture. The daily RSI14 reads 54.6, constructive without being stretched. That leaves room for further upside before overbought conditions become a concern.
Daily Momentum and Volatility Context
Notably, the daily MACD reinforces the bullish tone. The MACD line sits at 2.59 against a signal line of 1.38. That produces a positive histogram of 1.22, a healthy expanding momentum reading. Bollinger Bands show price trading between the midline at $98.95 and the upper band at $112.16. The stock still has room to extend before hitting volatility-band resistance.
In addition, the daily ATR14 stands at 6.19. That is a reminder that Robinhood stock continues to trade with real daily range. Traders should treat that volatility accordingly.
Daily Pivot Levels Frame the Battle Zone
Pivot levels frame the near-term battle. The pivot point sits at $103.66, with resistance at R1 of $106.62 and support at S1 of $101.84. Price closed above the pivot but below R1. In other words, buyers are still in control but have not cleared the next hurdle.
Robinhood Stock Hourly Momentum Cools
Hourly momentum in Robinhood stock has stalled. Price closed at $104.81, below the EMA20 at $105.64 and the EMA50 at $105.29. Only the EMA200 at $101.4 remains beneath price. That keeps the longer hourly trend intact even as the shorter-term structure softens.
In fact, the hourly regime is labeled neutral, and the indicators agree. The RSI14 sits at 45.76, just under the neutral midpoint. The MACD line at -1.02 sits below its signal line of -0.82. That produces a negative histogram of -0.2. The move toward recent highs has stalled, and sellers have gained short-term traction.
Moreover, hourly Bollinger Bands add to that read. Price at $104.81 sits below the midline of $106.42. It is closer to the lower band at $100.44 than the upper one at $112.41.
Still, hourly pivot data shows indecision rather than a decisive breakdown. Price hovers around the pivot point of $104.99, between support at $104.5 and resistance at $105.29. Therefore, the hourly weakness looks like a pause within the broader daily uptrend.
The 15-Minute Chart Shows a Bounce Attempt
The 15-minute chart offers execution context for that pause. Price at $104.81 sits above its EMA20 of $104.26. However, it remains below the EMA50 at $105 and the EMA200 at $105.24. That is a mixed but improving short-term structure.
By contrast, the 15m RSI14 at 56.57 points to a short-term bounce attempt. The MACD histogram has turned positive at 0.24. The MACD line at 0.14 has crossed above its signal line of -0.1. Price is also pressing toward the upper Bollinger Band at $105.39. That level sits close to the 15m pivot resistance of $105.29. The smallest timeframe hints that buyers are trying to reassert control at the same pivot zone the hourly chart is struggling with.
Bullish Scenario for Robinhood Stock
The bullish case for Robinhood stock rests on the daily trend absorbing the current hourly pullback. If price reclaims the hourly EMA20 near $105.64, the setup improves. Pushing through daily pivot resistance at R1 of $106.62 would confirm that the consolidation was only a pause.
In turn, a daily close above $106.62 would validate continuation toward the upper Bollinger Band at $112.16. That move would need the daily MACD histogram to stay positive and RSI14 to hold above 50.
Furthermore, the broader news backdrop supports this thesis. Robinhood shares are described as up 26.7% since the last earnings report. Coverage points to record trading volumes, strong asset inflows, and a premium growth story. A Seeking Alpha piece frames the stock as a Buy with technicals signaling a potential breakout. It also notes that patience on entry is warranted. Additional strength has come from correlated crypto momentum. Coinbase and Robinhood have both rallied alongside bitcoin’s push toward its best week in months.
Bearish Scenario for Robinhood Stock
The bearish risk grows if hourly deterioration spreads into the daily chart. A failure to hold the daily pivot at $103.66 would be the first warning. A break below S1 support at $101.84 would then open the door to a retest of the EMA20 at $101.37.
Consequently, a daily close below that level would suggest the pullback is becoming more than noise. That signal would be stronger if the hourly MACD histogram stays negative and RSI14 slides further under 45.
In contrast to the bullish narrative, one Yahoo Finance piece flags that Robinhood’s premium valuation “leaves little room for execution setbacks.” That caution matters given how far the stock has already run. Should hourly momentum fail to recover, the 15-minute structure could slip back below its EMA50 at $105. That would warn short-term traders that the bounce attempt has failed.
Robinhood Stock Outlook: Timeframes in Conflict
Robinhood stock remains in a daily uptrend that has not been broken. The daily chart says trend intact. The hourly chart says momentum cooling. The 15-minute chart says buyers are testing whether that cooling period is over.
Overall, given the daily ATR14 of 6.19, swings of several dollars in a single session remain normal for this name. That volatility should shape how positioning and risk are approached. The stock still rides a strong post-earnings narrative but carries a valuation that leaves little cushion for disappointment. The coming sessions around the $104 to $106 pivot zone should offer a clearer read on which timeframe wins out.
FAQ
What is Robinhood stock’s current price relative to its moving averages?
Robinhood stock closed at $104.81. That is above the daily EMA20 at $101.37, the EMA50 at $98.44, and the EMA200 at $95.38. On the hourly chart, however, price sits below the EMA20 at $105.64 and the EMA50 at $105.29.
Is the daily trend in Robinhood stock still bullish?
Yes, the daily uptrend remains intact. The daily RSI14 reads 54.6, and the daily MACD histogram is positive at 1.22. Price also sits above the daily pivot of $103.66, though still below R1 at $106.62.
What levels matter for a bullish continuation?
Bulls need price to reclaim the hourly EMA20 near $105.64 and clear R1 at $106.62. A daily close above $106.62 would support a move toward the upper Bollinger Band at $112.16.
What would invalidate the uptrend in Robinhood stock?
A break below the daily pivot at $103.66 and S1 at $101.84 would open the door to a retest of the EMA20 at $101.37. A daily close below that level, with the hourly MACD staying negative and RSI14 under 45, would strengthen the bearish case.
Disclaimer: This article is for informational purposes only and does not constitute financial advice, an investment recommendation, or a solicitation to buy or sell any financial instrument or cryptocurrency. The analysis provided is not indicative of future results. Investing in crypto assets and financial markets carries a high risk of capital loss. Always do your own research (DYOR) and consult a qualified financial advisor before making any decision.
Article produced with the assistance of artificial intelligence and reviewed by the editorial team.
