




Nike stock closed at $39.06, grinding toward multi-year lows. Price sits well below all major daily EMAs in a textbook bearish alignment. The broader trend remains firmly pointed lower, with sellers still in control.
Summary
Key takeaways
- Nike stock closed at $39.06, near the lower daily Bollinger Band at $38.21, with all major EMAs stacked in bearish alignment.
- Daily RSI14 at 41.26 remains below neutral, while MACD continues to signal active bearish momentum.
- The stock hit a 12-year low at $38.59 recently, with analysts cutting price targets citing weak demand and China concerns.
- Hourly indicators show early stabilization, but the daily bearish regime has not been overridden.
- The next major catalyst is Nike’s Q1 fiscal 2027 earnings, scheduled for October 1, 2026.
Nike Stock Daily Chart: Bearish Structure Remains Intact
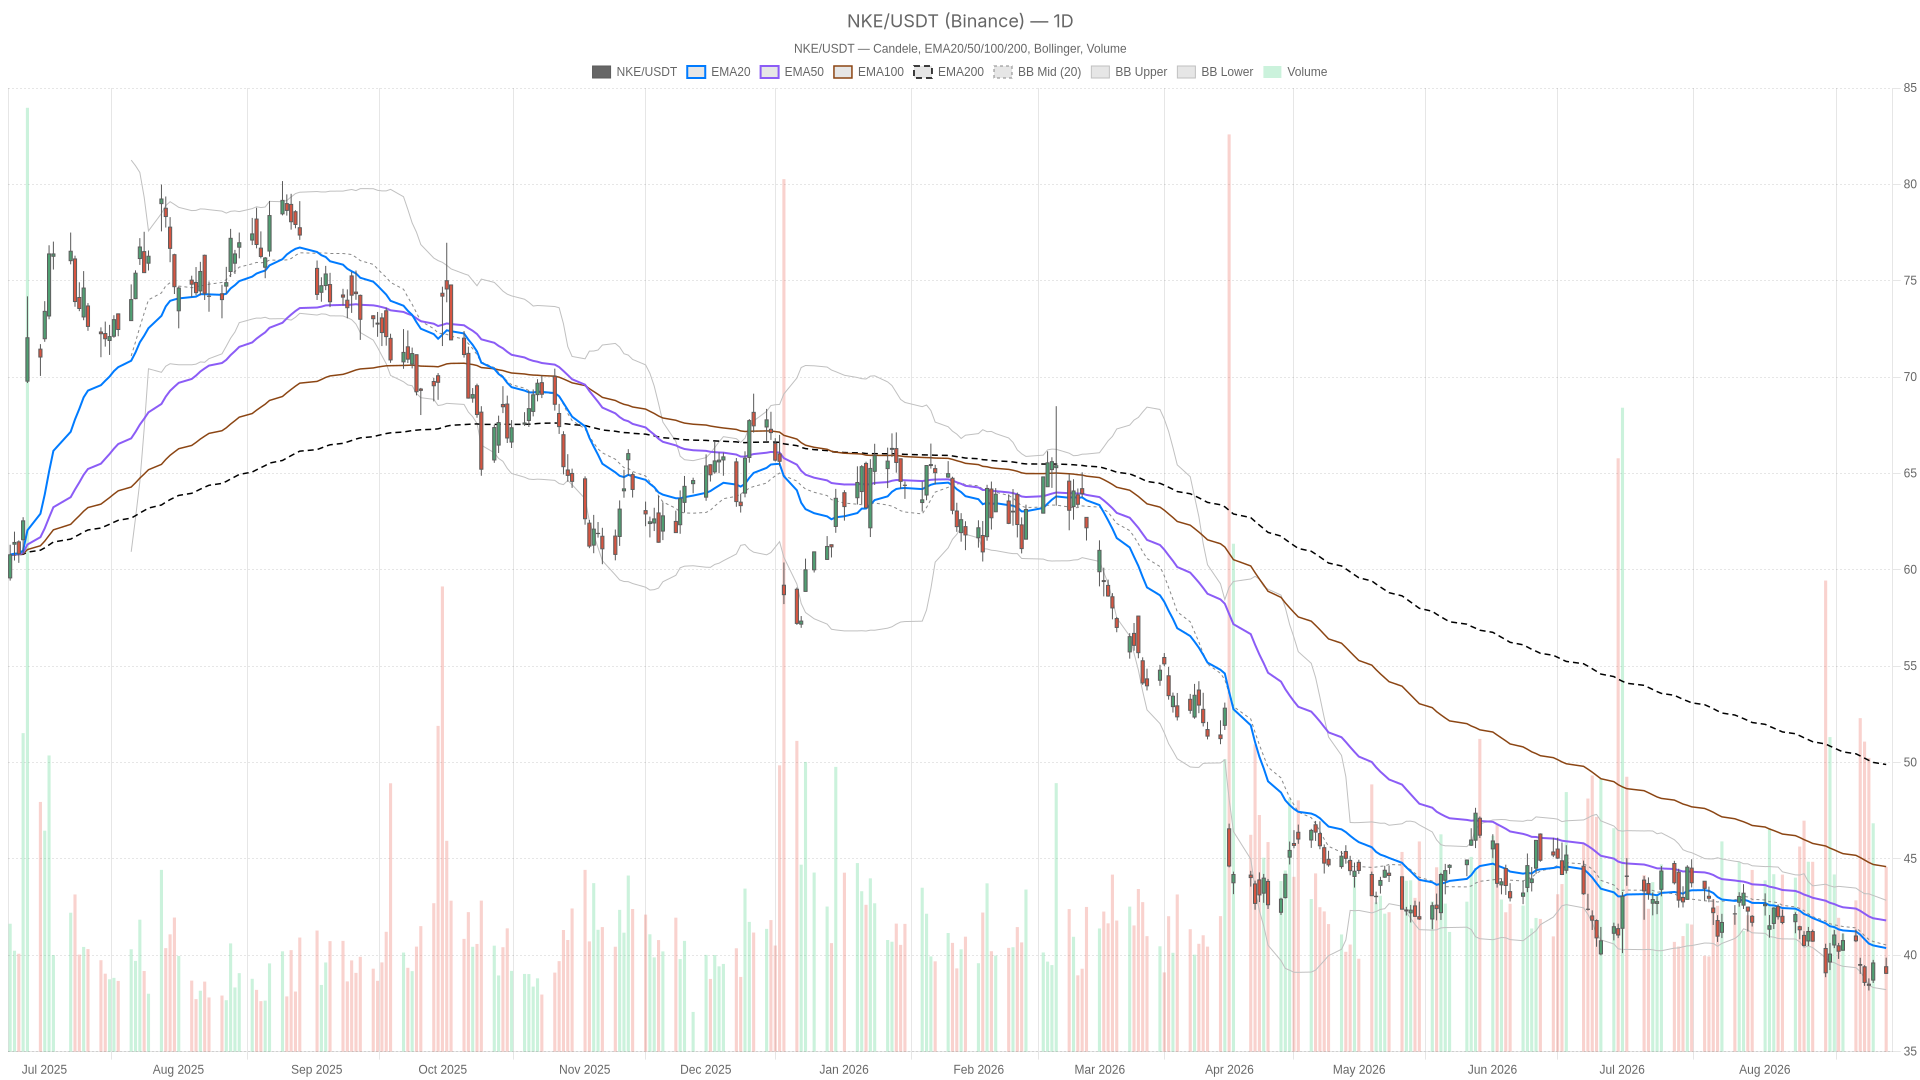
The daily chart confirms Nike stock remains locked in a firm bearish trend. Price closed at $39.06, sitting well below the 20, 50, and 200-period EMAs at 40.37, 41.81, and 49.90, respectively. This stacked EMA structure is a textbook bearish alignment. It signals that the broader trend is still pointing lower.
Meanwhile, momentum indicators reinforce that picture. RSI14 sits at 41.26, below the neutral 50 line but not yet in oversold territory. Sellers still have room to press if buyers don’t step in. The MACD line at -0.87 remains below its signal at -0.76. Its histogram of -0.11 shows bearish momentum is still active, even if not accelerating sharply.
Furthermore, Bollinger Bands add important context. Price trades near the lower band at 38.21 and well below the midline at 40.53. This signals that volatility has expanded to the downside. The path of least resistance has been south for some time.
Daily ATR14 stands at 1.11, elevated relative to recent price action. It reflects the turbulence accompanying the stock’s decline. On pivots, the daily level sits at 39.32, with resistance at 39.61 and support at 38.77. With the close already below the pivot, the immediate bias favors a retest of S1 support.
Nike Stock Hourly Chart: Early Stabilization Signals Emerge
On the 1H timeframe, Nike stock shows early signs of stabilization rather than continued decline. Price closed at 39.07, essentially in line with the daily close. However, the hourly EMAs are tighter: EMA20 at 39.13, EMA50 at 39.44, and EMA200 at 40.78. Price is hugging the EMA20 rather than being sharply rejected by it. This suggests the intraday downtrend has lost some force.
Notably, RSI14 on the 1H reads 47.38. That’s much closer to neutral than the daily reading. At the same time, the MACD histogram has flipped slightly positive at 0.05. However, the MACD line at -0.04 remains just below its signal at -0.09. This is where the timeframes start to disagree. The daily structure is unambiguously bearish. Yet the hourly momentum indicators show stabilization rather than continued acceleration lower.
In other words, the broader downtrend in Nike stock is intact. But the immediate pressure behind it may be easing on a short-term basis. That’s a meaningful nuance for intraday price action. It doesn’t change the primary trend, though it does shift the near-term risk profile.
The 1H Bollinger Bands, with a midline of 38.97 and upper band at 39.77, show price trading just above the middle of the range. The hourly pivot at 39.12 sits almost exactly where price is now. Resistance stands at 39.21 and support at 38.98. This tight, compressed structure suggests the market is pausing to digest the recent decline.
Nike Stock 15-Minute Chart: Tight Consolidation Signals Indecision
On the 15-minute chart, the regime reads neutral rather than bearish. This aligns with the idea that short-term momentum has cooled. Price closed at 39.07 with EMA20 at 39.19 and EMA50 at 39.15. These are essentially overlapping. Meanwhile, EMA200 sits higher at 39.47. RSI14 at 42.3 and a nearly flat MACD histogram of -0.01 both point to indecision rather than conviction.
Meanwhile, Bollinger Bands on the 15m are notably tight. The upper band sits at 39.37 and the lower band at 39.04. ATR14 of just 0.09 confirms intraday volatility has dried up. Traders appear to be waiting for a fresh catalyst before committing capital. The 15m pivot at 39.11, with support at 38.99, reinforces the broader consensus. The $39.00 area remains the level to watch for any near-term directional move.
What’s Driving the Nike Stock Price Action
The fundamental backdrop explains why sentiment remains so cautious around Nike stock. The shares hit a 12-year low at $38.59 recently. This puts the company on pace for its worst year since Michael Jordan’s first retirement in 1993. Alongside NIO and McDonald’s, Nike shares fell to 52-week lows. Cautious consumers and rising competition continue to squeeze profit margins across the sector.
At the same time, Wall Street has grown increasingly wary. Analysts have cut price targets on both Nike and Lululemon. They cite weak demand, softer store traffic, and lingering concerns over China. However, valuation work suggests the picture isn’t entirely one-sided. One analysis found Nike stock looks undervalued when measured against earnings. Yet it appears roughly fairly valued against cash flow. This indicates a split message rather than a clean directional signal.
Looking ahead, Nike is scheduled to report first quarter fiscal 2027 earnings on October 1, 2026, after market close. That date now stands as the next major catalyst. It could resolve the current standoff between deteriorating fundamentals and technically oversold-adjacent conditions.
Nike Stock Bullish Scenario
For a bullish case to develop, Nike stock would need to reclaim the daily pivot at 39.32 and push through resistance at 39.61. A move back above the daily Bollinger midline near 40.53 would provide a stronger signal. It would confirm that selling pressure has genuinely paused.
On the momentum side, daily RSI would need to climb back above 50. The MACD histogram would need to flip positive rather than simply narrowing. The early stabilization already visible on the 1H MACD histogram could be an early tell. However, it would need to persist and extend into a broader shift.
In addition, a positive surprise around the October 1 earnings release would help shift sentiment more durably. The same goes for any change in the current narrative around weak demand and China exposure.
Nike Stock Bearish Scenario
The bearish case remains the path of least resistance for Nike stock right now. A break below daily support at 38.77 would open the door to a retest of the recent 12-year low near $38.59. Should price fail to hold the daily Bollinger lower band at 38.21, that would confirm sellers are still firmly in control. It would signal the downtrend has further room to run.
Meanwhile, continued analyst downgrades would reinforce this scenario. So would persistent weak consumer traffic data or fresh concerns tied to China demand. Given that the daily regime is already classified as bearish, any failure to stabilize above the 39.00 area would likely accelerate the move lower. The shorter timeframes would then align with the dominant trend.
Nike Stock Outlook: Key Levels to Watch
Overall, the technical picture for Nike stock remains skewed to the downside on the daily timeframe. Shorter-term indicators, however, hint at a pause rather than fresh acceleration. This divergence between timeframes is worth watching closely. The 1H chart’s mild momentum stabilization doesn’t yet override the daily bearish regime. But it does suggest the market is catching its breath near multi-year lows.
With elevated daily ATR reflecting ongoing volatility, positioning around current levels carries real uncertainty in both directions. The October 1 earnings date approaches as a key event risk. Traders and investors alike will likely be watching the 39.00 area and daily support at 38.77 closely. Either level could define the next meaningful move in Nike stock.
FAQ
Is Nike stock in a bearish or bullish trend right now?
The daily chart shows a clear bearish trend. All three major EMAs—20, 50, and 200-period—are stacked above price in a textbook bearish alignment. RSI14 at 41.26 remains below neutral, and MACD continues to signal active bearish momentum.
What is the next major catalyst for Nike stock?
Nike is scheduled to report first quarter fiscal 2027 earnings on October 1, 2026, after market close. This stands as the next major event capable of resolving the current tension between weak fundamentals and oversold technical conditions.
What key levels should traders watch on Nike stock?
The $39.00 area and daily support at 38.77 are the immediate levels to monitor. A break below 38.77 could open the door to a retest of the 12-year low at $38.59. On the upside, reclaiming 39.32 and pushing through 39.61 would be early bullish signals.
Are there any signs Nike stock could reverse higher?
The 1H chart shows early stabilization. The MACD histogram has turned slightly positive, and RSI14 sits near neutral at 47.38. However, these signals have not yet overridden the dominant daily bearish regime. A reclaim of the daily Bollinger midline near 40.53 would be a stronger indication of a potential shift.
Disclaimer: This article is for informational purposes only and does not constitute financial advice, an investment recommendation, or a solicitation to buy or sell any financial instrument or cryptocurrency. The analysis provided is not indicative of future results. Investing in crypto assets and financial markets carries a high risk of capital loss. Always do your own research (DYOR) and consult a qualified financial advisor before making any decision.
Article produced with the assistance of artificial intelligence and reviewed by the editorial team.
