



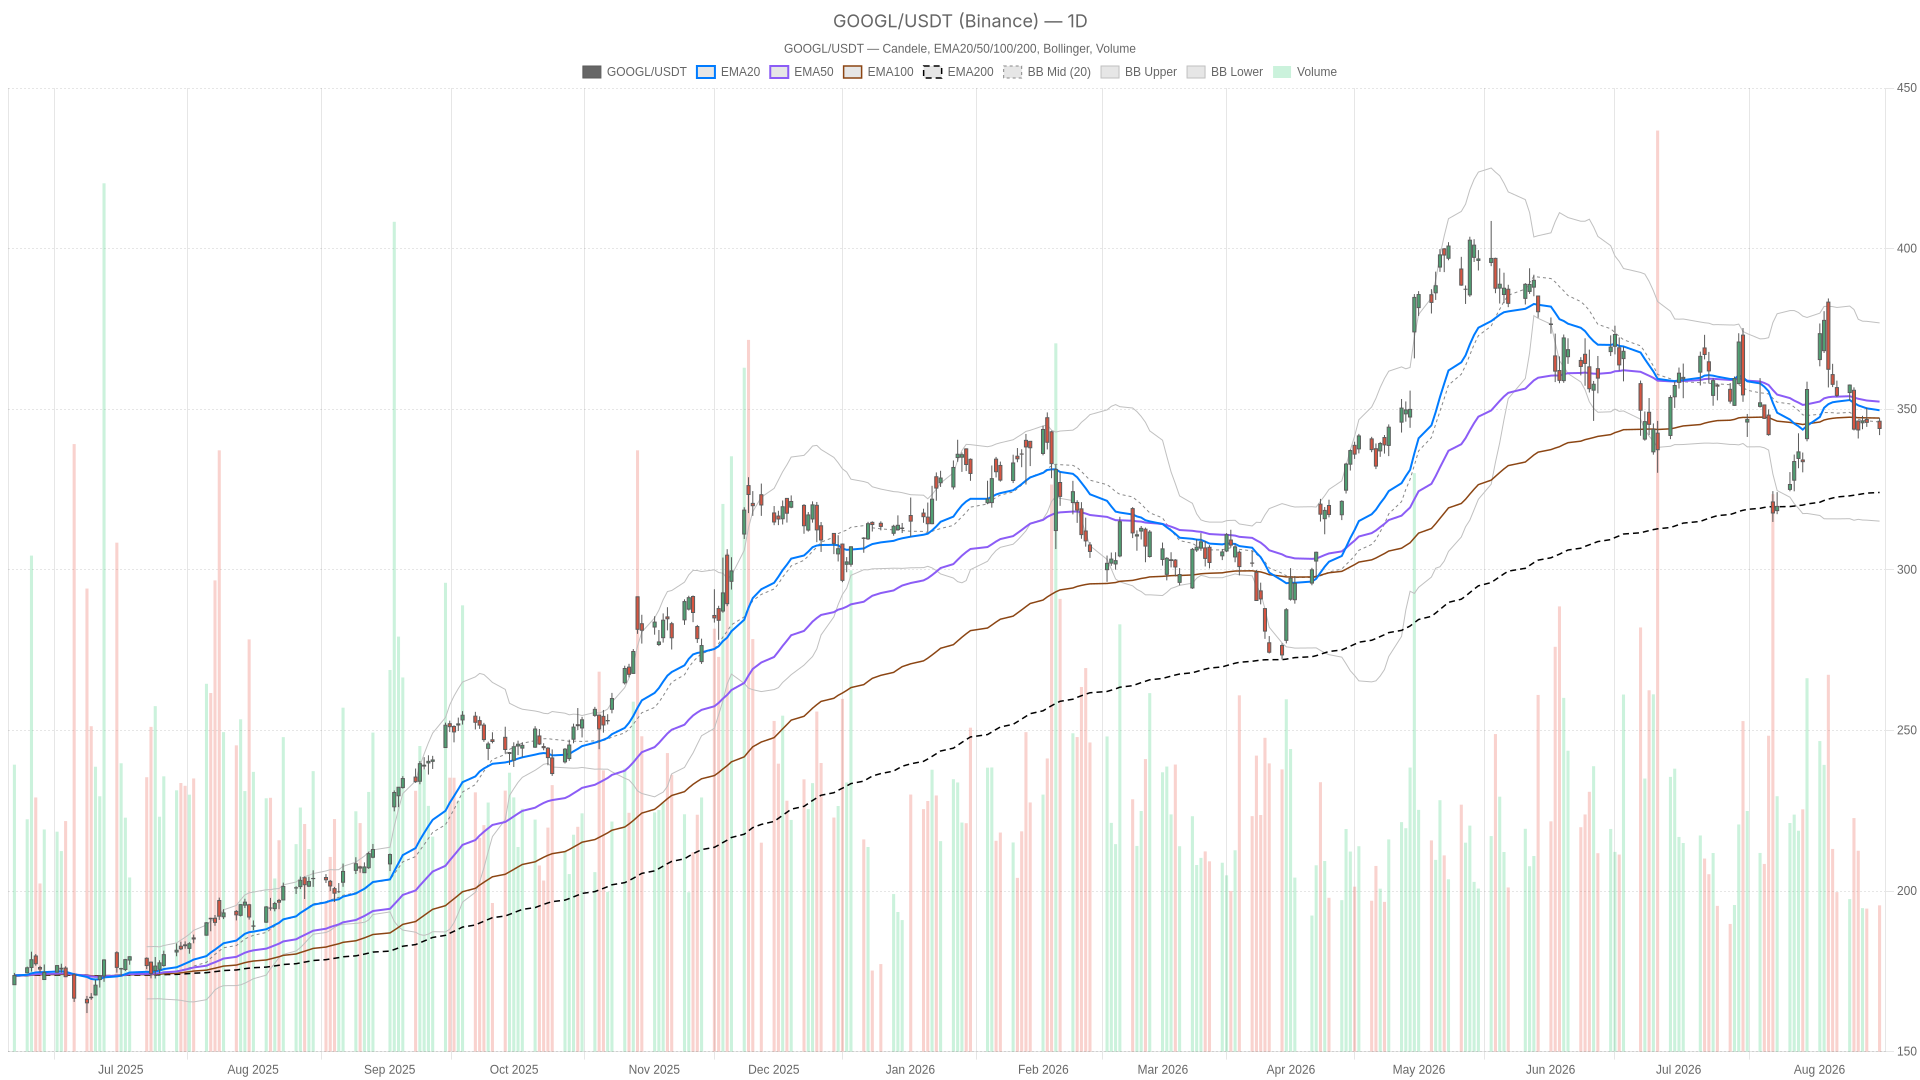
Alphabet stock is caught between two competing forces: an intact long-term uptrend and a short-term corrective phase that has pulled price below key moving averages. On the daily chart, GOOGL closed at 344.00, under both the 20-day and 50-day EMAs but above the 200-day EMA at 324.08.
Summary
Key takeaways
- GOOGL closed at 344.00 on the daily chart, below the 20-day EMA at 349.67 and the 50-day EMA at 352.36.
- The daily RSI14 at 46.03 sits in neutral territory, while the daily MACD histogram remains negative at -0.43.
- The 1-hour timeframe shows a bearish regime, with price below the 20-hour, 50-hour, and 200-hour EMAs.
- The hourly MACD histogram has turned slightly positive at +0.19, hinting that downside momentum may be losing steam.
- Berkshire Hathaway has been reported adding $17 billion worth of Alphabet shares, while cloud backlog has topped $514 billion.
Daily Timeframe: Alphabet Stock Consolidates Inside a Broader Uptrend
The daily chart frames Alphabet stock as a pullback inside a broader uptrend, not a confirmed trend reversal. GOOGL closed at 344.00, sitting under both the 20-day EMA (349.67) and the 50-day EMA (352.36). Price remains comfortably above the 200-day EMA at 324.08. That combination points to consolidation within a longer uptrend, at least for now.
Momentum Indicators Stay Neutral
The daily RSI14 at 46.03 sits in neutral territory, neither overbought nor oversold. Momentum has cooled without collapsing. Meanwhile, the daily MACD line (-1.51) remains below its signal line (-1.08), with a histogram of -0.43. This confirms bearish momentum that is not accelerating aggressively. The daily regime reading is also classified as neutral.
Volatility and Pivot Levels Frame the Decision Zone
Bollinger Bands show price near the midline at 346.01. The upper band sits at 376.87 and the lower band at 315.15. No volatility extreme is present. ATR14 of 11.15 suggests normal, orderly movement rather than panic selling. The daily pivot point at 344.39 places the stock right at a decision zone. Resistance sits at 346.86 (R1) and support at 341.54 (S1).
Hourly Timeframe: Bearish Structure With Fading Momentum
The 1-hour chart tilts more clearly bearish, though momentum signals hint that downside pressure may be losing steam. Price at 344.08 sits below the 20-hour EMA (344.97), the 50-hour EMA (347.86), and the 200-hour EMA (351.41). That is a fully bearish EMA stack. The 1H regime is explicitly labeled bearish. RSI14 at 41.8 supports the reading, with momentum leaning to the downside but not yet oversold.
MACD Nuance Hints at Slowing Downside Momentum
However, the MACD readings complicate the bearish narrative. The MACD line (-1.19) remains below the signal line (-1.38), yet the histogram has turned slightly positive at +0.19. This suggests downside momentum may be losing steam even as the hourly trend stays negative. In other words, the 1H timeframe confirms underlying weakness while hinting at possible short-term stabilization.
Compressed Volatility Precedes the Next Move
Volatility on the hourly chart is notably compressed. Bollinger Bands are tight, with the upper band at 347.01 and the lower band at 343.01. ATR14 sits at just 1.68. A low-volatility environment often precedes directional expansion. Traders should watch for a break of this range. The hourly pivot at 343.87 shows price hovering around the pivot, with resistance at 344.46 and support at 343.48.
15-Minute Chart: A Tentative Intraday Test
The 15-minute chart shows a mixed EMA alignment and a modest short-term bounce attempt, without a clear directional edge. Zooming in, price at 344.08 is trading above its 20-period EMA (343.86). However, it remains below the 50-period EMA (344.40) and the 200-period EMA (348.95). This mixed alignment reflects the real-time tug-of-war. RSI14 at 51.07 sits right at the neutral midpoint. The MACD histogram has turned slightly positive at 0.11, suggesting a modest bounce attempt.
Bollinger Bands are extremely tight on this timeframe. Price sits near the upper band at 344.50, against a lower band of 342.95. ATR14 reads just 0.69. This is a low-volatility, execution-focused environment. The 15m pivot at 343.94 and resistance at 344.39 (R1) are the levels to watch for intraday confirmation. Overall, the 15m chart is testing near-term resistance without offering a clear edge on its own.
Fundamental Backdrop Adds Nuance to Alphabet Stock
The fundamental picture for Alphabet stock is notably mixed, though it leans constructive on several fronts. Beyond the charts, reports highlight that Alphabet’s cloud growth continues to surge. Cloud backlog has topped $514 billion. The company also received a debt rating upgrade tied to its AI infrastructure spending ramp-up. At the same time, that CapEx surge is driving near-term negative free cash flow. Valuation-focused analysts have flagged this tension even while calling GOOGL one of the cheapest mega-cap tech names available.
Notably, Berkshire Hathaway has been reported adding $17 billion worth of Alphabet shares. That is a substantial vote of confidence from one of the most closely watched investors in the market. On the other hand, some top investors who profited heavily from Alphabet in the past are now publicly questioning the valuation. They describe the company as “a very different company” than it was two years ago. This contrast mirrors the technical tension seen across timeframes.
Bullish Scenario for Alphabet Stock
A bullish case for Alphabet stock would require price to reclaim the daily 20-EMA at 349.67 and eventually the 50-EMA at 352.36. If the daily MACD histogram flips positive, combined with RSI14 pushing back above 50, renewed upside momentum would be confirmed. On the hourly chart, a break above the 200-hour EMA (351.41) would flip the current bearish regime. That would align short-term structure with the still-intact long-term uptrend defined by the 200-day EMA at 324.08. Fundamentally, continued cloud growth, the $514 billion backlog, and sustained institutional buying would support this scenario.
Bearish Scenario and Invalidation Levels
The bearish case centers on a daily close below the S1 support at 341.54. Such a break, especially with an expanding ATR14 beyond its current 11.15 reading, would suggest sellers are gaining control. A daily MACD histogram widening to the downside, alongside RSI14 slipping under 40, would invalidate the pullback-within-uptrend thesis. On the hourly chart, a decisive move below the S1 support of 343.48 with volume confirmation would reinforce the bearish regime. Valuation concerns tied to negative near-term free cash flow could act as a fundamental catalyst.
Closing Thoughts
Overall, Alphabet stock presents a layered picture with no confirmed trend in either direction. Therefore, positioning around current levels demands patience. Volatility remains contained across all three timeframes rather than signaling an imminent breakout. Meanwhile, the fundamental narrative adds further uncertainty. Strong cloud backlog growth and notable institutional buying from Berkshire Hathaway sit alongside valid concerns about near-term cash flow and elevated CapEx. Until price decisively breaks the key pivot and EMA levels identified across the daily and hourly charts, the path of least resistance remains unclear.
FAQ
Is Alphabet stock in an uptrend or a downtrend?
The daily chart frames GOOGL as consolidating inside a broader uptrend. Price closed at 344.00, below the 20-day and 50-day EMAs but above the 200-day EMA at 324.08.
What are the key levels to watch for Alphabet stock?
On the daily chart, watch resistance at 346.86 (R1) and support at 341.54 (S1). On the hourly chart, resistance sits at 344.46 and support at 343.48.
What does the hourly MACD histogram signal for GOOGL?
The hourly MACD histogram has turned slightly positive at +0.19. This hints that downside momentum may be losing steam even while the hourly trend stays bearish.
Why is the fundamental backdrop considered mixed?
Cloud backlog has topped $514 billion and Berkshire Hathaway was reported adding $17 billion in shares. However, surging CapEx is driving near-term negative free cash flow, which some analysts have flagged.
Disclaimer: This article is for informational purposes only and does not constitute financial advice, an investment recommendation, or a solicitation to buy or sell any financial instrument or cryptocurrency. The analysis provided is not indicative of future results. Investing in crypto assets and financial markets carries a high risk of capital loss. Always do your own research (DYOR) and consult a qualified financial advisor before making any decision.
Article produced with the assistance of artificial intelligence and reviewed by the editorial team.
