




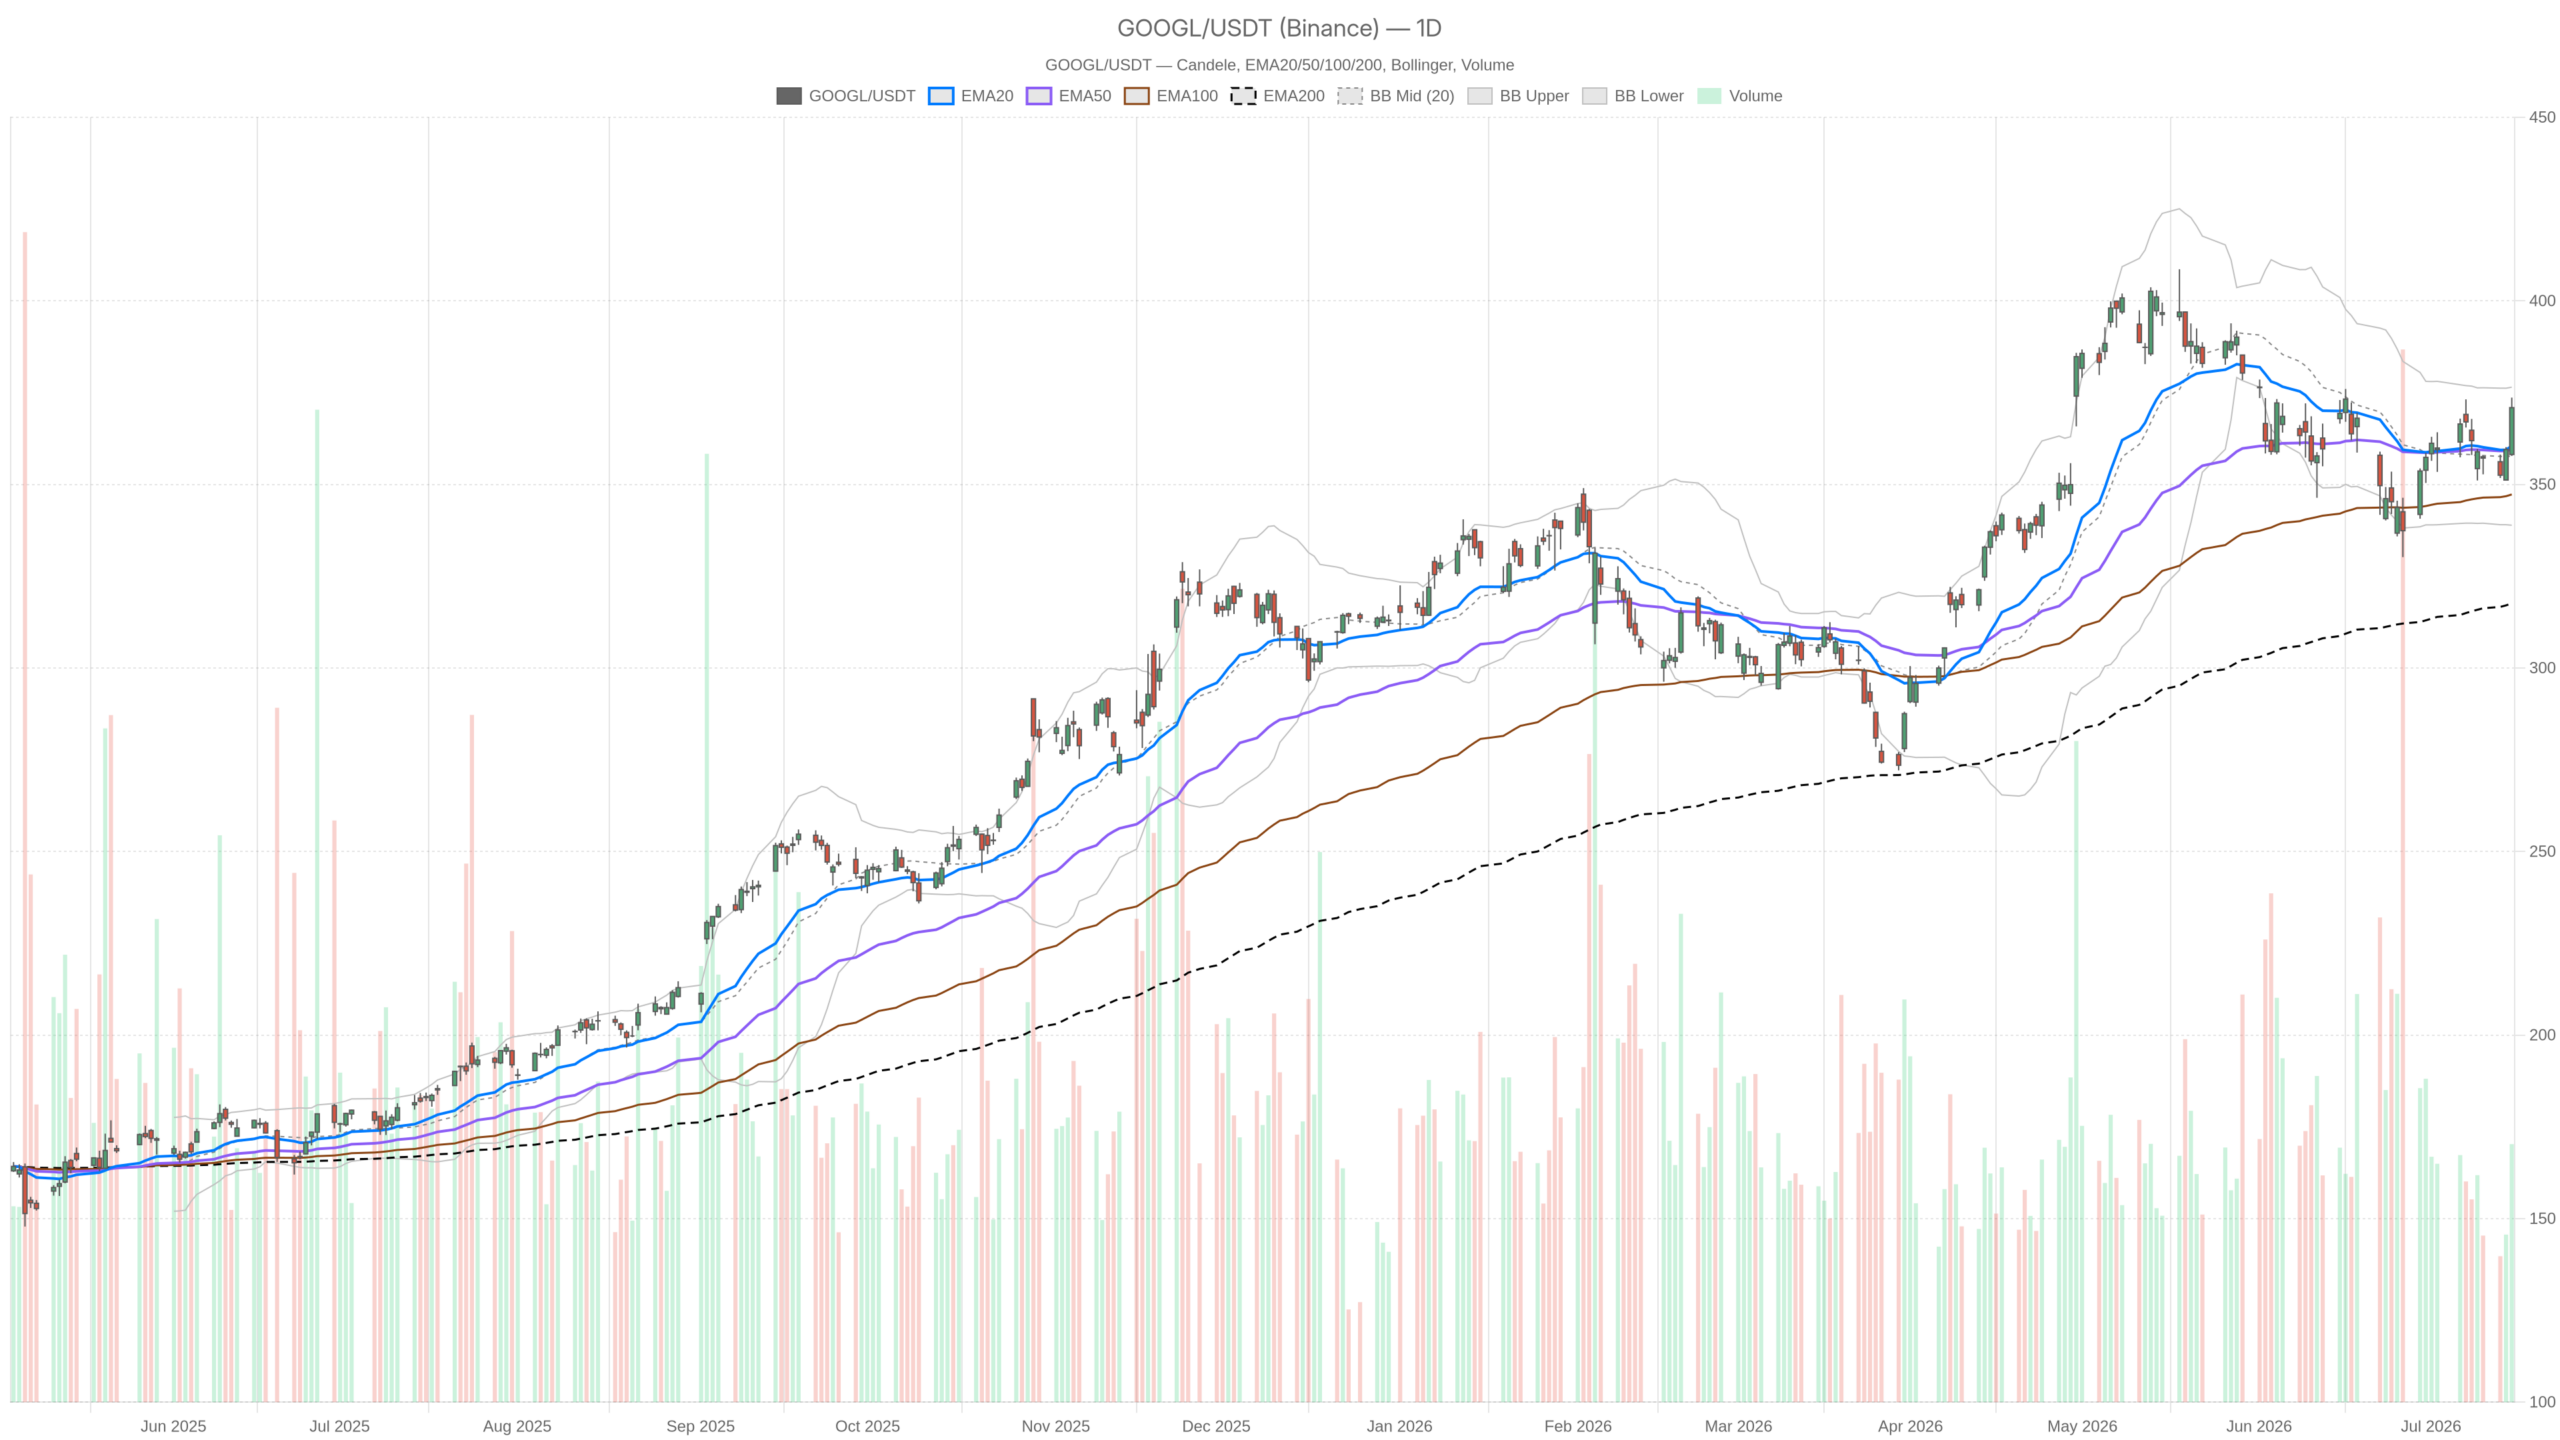
Alphabet Stock closed at $370.92 on July 15 after touching an intraday high of $373.65, keeping the daily structure firmly bullish and reinforcing a recovery that has been building since early 2026. However, the hourly chart introduces a layer of caution that short-term traders should not dismiss.
Summary
Key takeaways
- GOOGL closed at $370.92 on July 15, comfortably above the daily pivot of $367.44.
- The daily MACD histogram has turned positive at 1.48, signaling an early-stage momentum shift.
- Hourly RSI at 67.11 is approaching overbought territory, urging short-term caution.
- Warren Buffett’s Berkshire stake in GOOGL reportedly exceeds $31 billion, adding institutional credibility.
- The upside target near $377 converges with daily R1 and the upper Bollinger Band.
Daily Bias: Alphabet Stock Holds a Clean Bullish Regime
Alphabet Stock’s daily bias is firmly bullish. GOOGL trades above its EMA20 at $360.51 and EMA50 at $359.58, with the EMA200 far below at $317.59 — confirming a clean, conviction-driven uptrend.
The two shorter averages run closely together, signaling trend cohesion rather than divergence. That gap to the EMA200 confirms this is not a borderline situation. The stock has reclaimed its long-term trend structure with conviction.
Notably, the daily MACD tells an interesting story. The line at -0.78 remains marginally below zero. However, the histogram has turned positive at 1.48 and is rising above the signal line at -2.26. This is a classic early-stage momentum shift. Selling pressure is fading and buyers are gaining ground, even though the MACD has not yet crossed into positive territory.
Meanwhile, RSI on the daily sits at 56.87 — healthy, directional, and not overbought. There is room for further upside before momentum becomes stretched. The Bollinger Bands frame the picture neatly. The mid-band at $357.69 acts as a dynamic floor. The upper band at $376.50 represents the near-term ceiling. The close at $370.92 positions GOOGL in the upper half — consistent with bullish momentum without screaming overextension.
The daily ATR of 10.34 reflects meaningful volatility. Each daily swing carries real price risk. That context matters when assessing entries and stop placement.
Pivot Framework: A Key Level Has Already Been Cleared
GOOGL has already cleared the critical daily pivot at $367.44, closing well above it at $370.92. This directionally positive signal opens the path toward the first resistance at $377.13.
That resistance aligns closely with the upper Bollinger Band at $376.50. The resulting confluence zone is the immediate target for any continuation move. On the downside, support at $361.24 and the EMA cluster around $359–360 form a credible defensive base. A pullback into that zone would still be structurally benign.
Hourly View: Strong Momentum, But Approaching a Warning Zone
The hourly chart confirms upside momentum in Alphabet Stock but warns of approaching overbought conditions. The 1-hour RSI at 67.11 is nudging toward the 70 threshold, while the hourly regime reads neutral rather than bullish.
GOOGL closed the session at $370.92 with the hourly MACD solidly positive. The line at 3.77 sits above the signal at 2.32, with the histogram at 1.44. That is a clearly bullish intraday configuration. The price also trades well above the hourly EMA20 at $364.06 and EMA50 at $360.83.
However, the proximity to overbought territory on RSI is worth monitoring. The divergence between the bullish daily regime and neutral hourly regime suggests the intraday trend has been running hard. It may need to consolidate before pushing higher. This does not invalidate the daily thesis, but it warns against chasing the move aggressively at current levels.
Notably, the hourly Bollinger upper band at $375.50 echoes the daily resistance zone near $376–377. That convergence strengthens the case for a short-term pause or mild retracement before any breakout.
15-Minute Context: Micro-Signals Flag a Tactical Pause
The 15-minute chart shows Alphabet Stock in a structurally bullish posture, but micro-momentum is fading into the close. The 15m MACD histogram has dipped to -0.62, signaling a near-term cooling phase.
Price trades above all three EMAs — EMA20 at $369.93, EMA50 at $365.71, and EMA200 at $360.37 — which is structurally positive. The 15m regime is tagged bullish. Nevertheless, the RSI at 64.21 remains elevated. Together, these signals suggest GOOGL entered a brief intraday consolidation into the close. For execution purposes, this is not a reversal — it is a pause context.
The News Backdrop: A Powerful Fundamental Tailwind
Alphabet Stock benefits from an unusually strong fundamental backdrop. Warren Buffett’s endorsement — with Berkshire’s stake reportedly topping $31 billion and Buffett stating GOOGL will beat 95% of Wall Street picks — provides powerful institutional validation. That kind of backing has a way of sustaining price momentum.
At the same time, Reuters reporting indicates Alphabet aims to raise $80 billion in equity offerings. This capital move signals aggressive investment in future growth. Meanwhile, analysts are weighing whether AI growth drivers justify Alphabet’s premium valuation. The consensus leans positive: AI momentum across Search and Cloud, a surging backlog, and improving unit economics support the case.
The comparison with Amazon as an AI computing contender adds a competitive dimension but does not undermine the GOOGL thesis. In contrast, the question of heavy spending remains a live debate for longer-term valuation models.
Bullish Scenario: Momentum Carries GOOGL Toward $377
The bullish scenario targets $377.13 — the daily R1 — provided GOOGL holds above the daily pivot at $367.44 and the EMA cluster near $359–360. A clean break above the $373.65 intraday high would open that path.
Overall, the fundamental backdrop, with Berkshire’s institutional weight and AI-driven growth expectations, provides a credible floor for demand. The daily structure favors bulls as long as price remains above the Bollinger mid-band at $357.69.
Bearish Scenario: Overbought Intraday Signals and Heavy Resistance Above
The bearish case rests primarily on intraday exhaustion. The hourly RSI near 70, the neutral H1 regime, and the micro-MACD pullback on 15m suggest the stock ran hard into the close without building fresh momentum.
If GOOGL fails to hold the daily pivot at $367.44 on a pullback, the next support zone at $361.24 becomes relevant. A decisive close below the EMA cluster around $359–360 would materially weaken the short-term bullish thesis. That scenario would require a significant sentiment shift — perhaps a risk-off macro event or disappointing data around the $80 billion equity offering story.
Positioning and Volatility: A Market That Rewards Patience
Alphabet Stock sits at a technically interesting junction where patience is rewarded. The daily structure is bullish. The macro news cycle is supportive. Berkshire’s conviction adds real institutional credibility. Yet the intraday setup warns against complacency.
The H1 RSI approaching overbought, combined with a neutral hourly regime, suggests the next few sessions may involve digestion rather than a straight run higher. With a daily ATR of 10.34, intraday swings remain substantial. Traders who wait for a modest pullback toward the $364–367 zone may find a more favorable risk-reward entry. The upside target near $377 is clear. The path to get there, however, may not be linear.
FAQ
What is the daily bias for Alphabet Stock?
Alphabet Stock’s daily bias is firmly bullish. GOOGL trades above both its EMA20 at $360.51 and EMA50 at $359.58, with the EMA200 far below at $317.59, confirming a clean uptrend. The daily RSI at 56.87 remains healthy and leaves room for further upside before momentum becomes stretched.
What are the key levels to watch for GOOGL?
The daily pivot at $367.44 is the immediate reference point. Resistance sits at $377.13, which aligns closely with the upper Bollinger Band at $376.50. Support rests at $361.24, with the EMA cluster near $359–360 forming a stronger defensive base. A close below that cluster would weaken the bullish thesis.
Is Alphabet Stock overbought?
Not on the daily timeframe, where RSI reads 56.87 — healthy and directional. However, the hourly RSI at 67.11 is approaching overbought territory, and the hourly regime reads neutral rather than bullish. This suggests a short-term pause or consolidation may be near, though it does not invalidate the broader bullish structure.
What fundamental factors are driving Alphabet Stock?
Warren Buffett’s Berkshire Hathaway holds a stake reportedly exceeding $31 billion, with Buffett stating GOOGL will beat 95% of Wall Street picks. Additionally, AI momentum across Search and Cloud, a growing backlog, and improving unit economics support the bullish thesis. Reuters also reports Alphabet aims to raise $80 billion in equity offerings, signaling aggressive growth investment.
Disclaimer: This article is for informational purposes only and does not constitute financial advice, an investment recommendation, or a solicitation to buy or sell any financial instrument or cryptocurrency. The analysis provided is not indicative of future results. Investing in crypto assets and financial markets carries a high risk of capital loss. Always do your own research (DYOR) and consult a qualified financial advisor before making any decision.
Article produced with the assistance of artificial intelligence and reviewed by the editorial team.
