



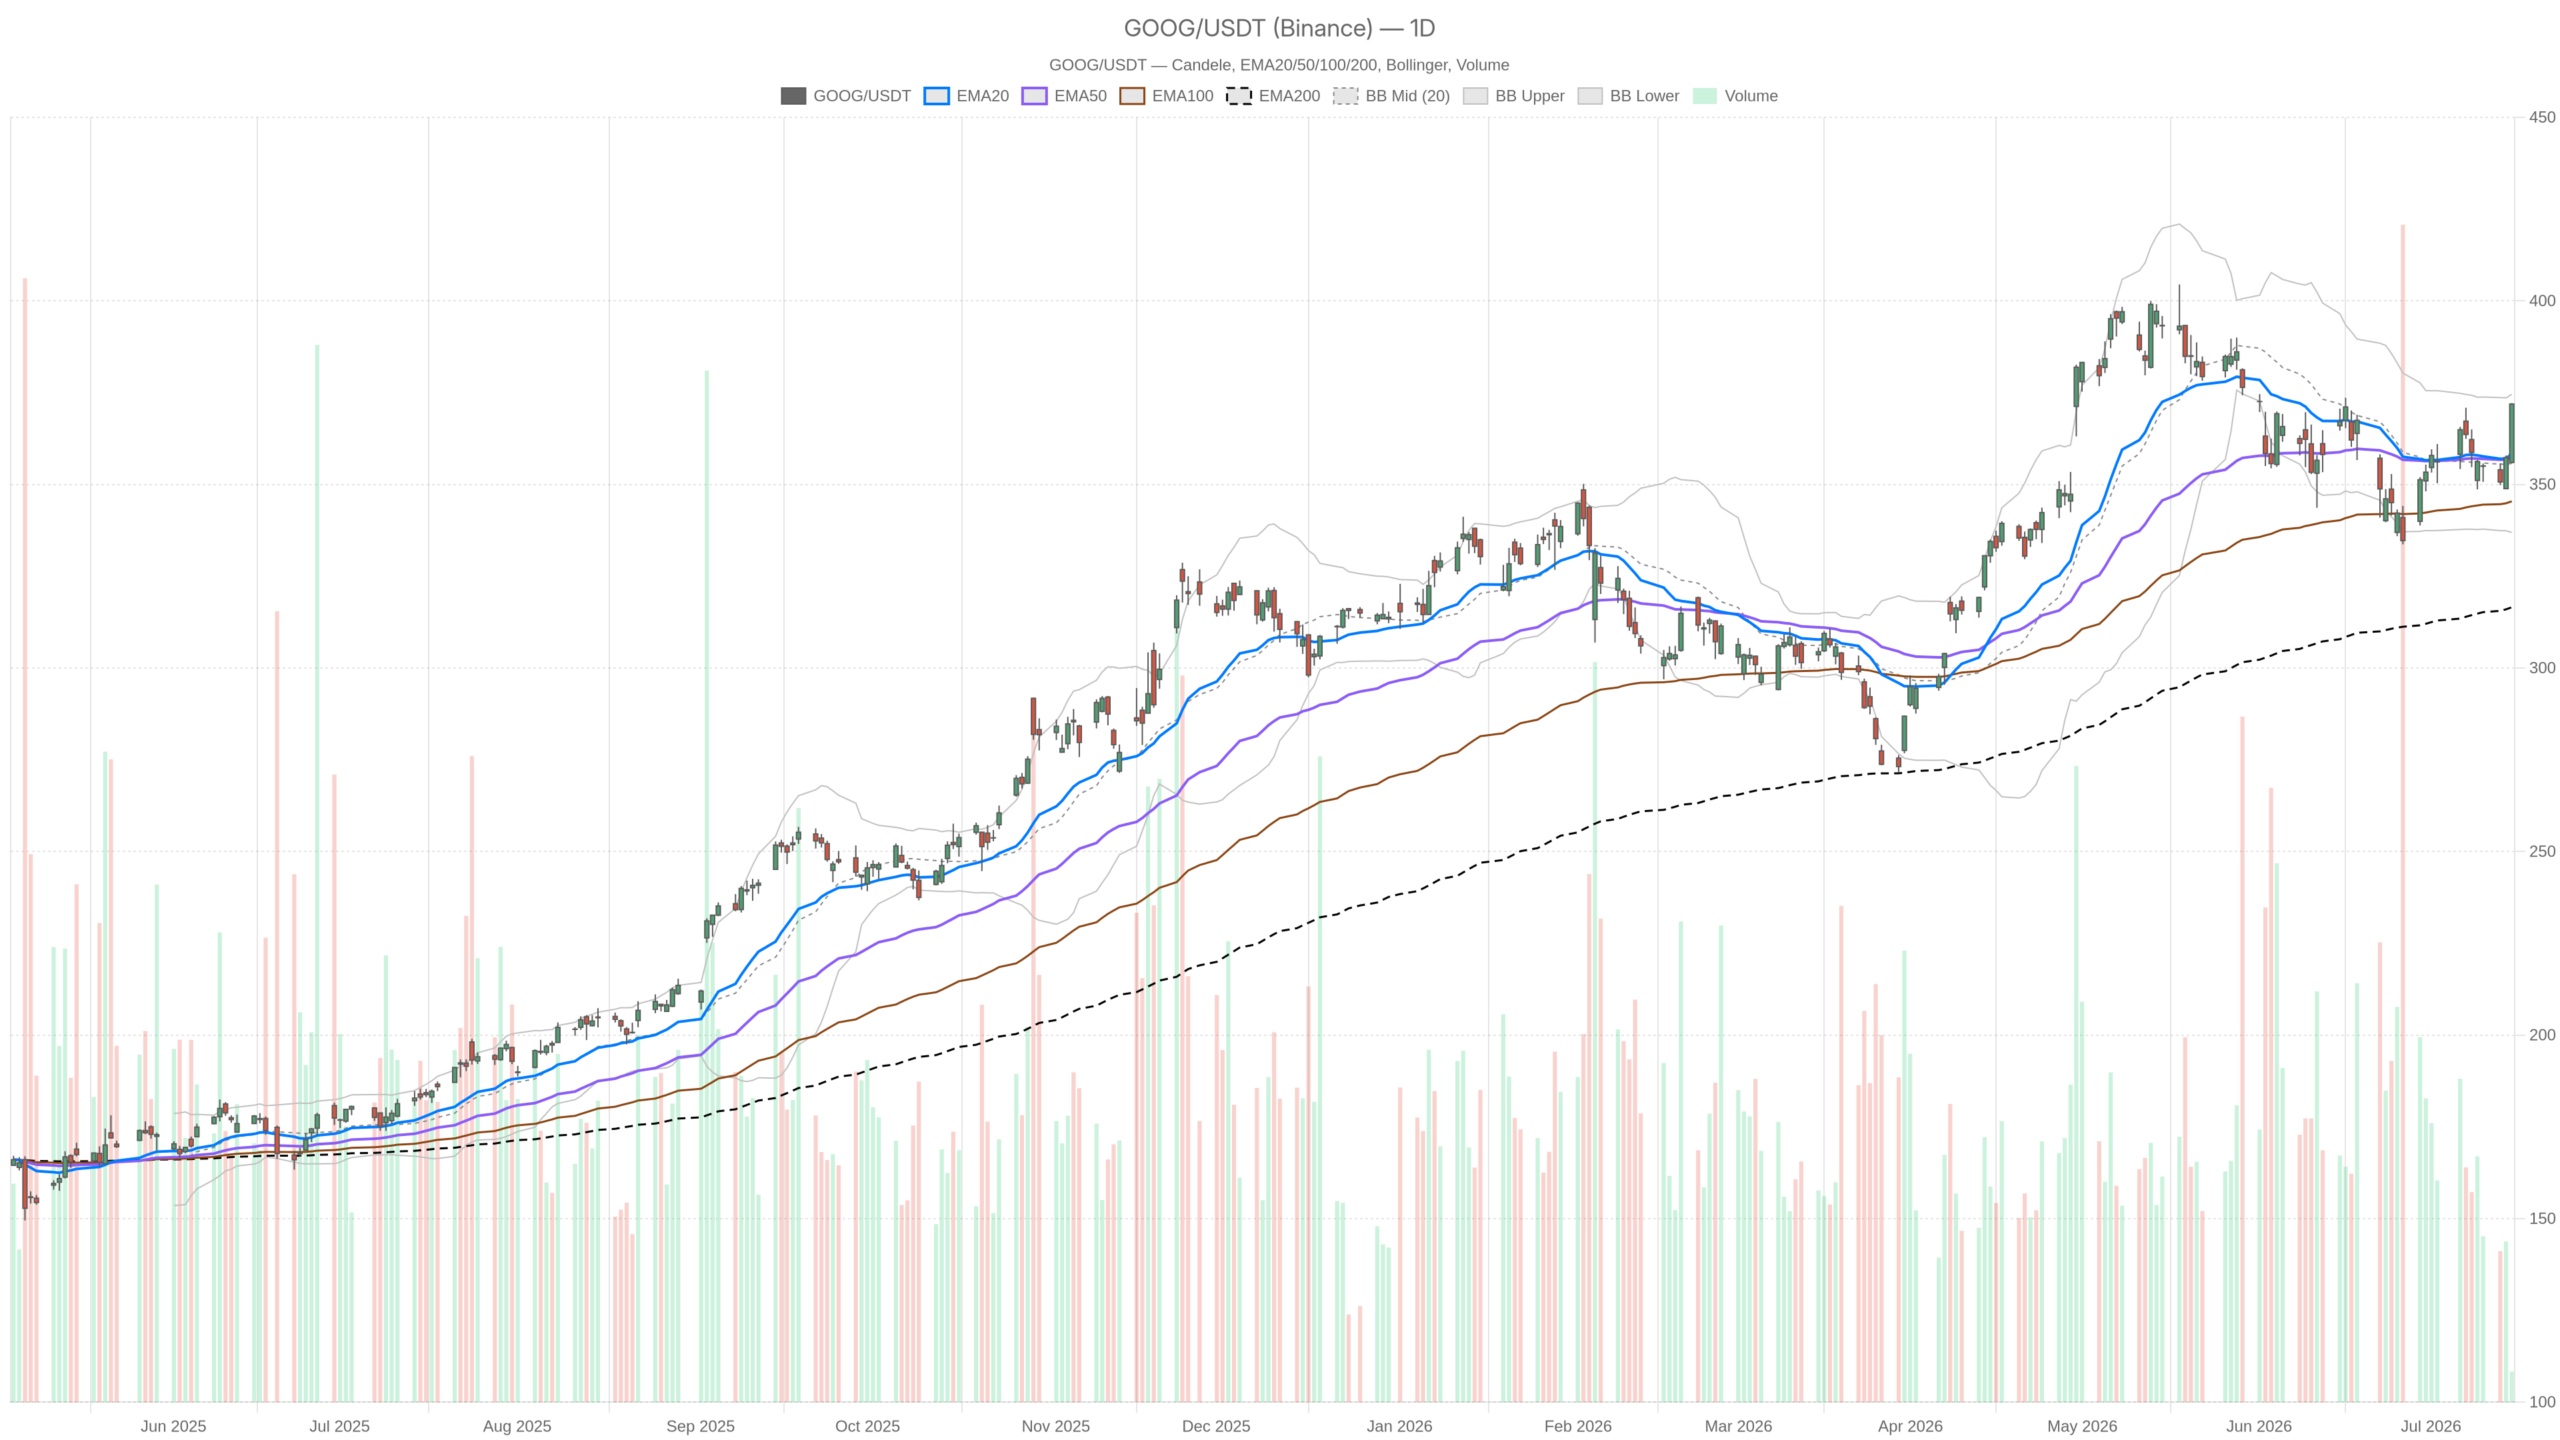
Alphabet Inc. stock delivered a powerful session on July 15, with GOOG closing at $371.89 — up sharply from $357.33. Volume exceeded 2.1 million shares, confirming genuine buying conviction behind the move.
Summary
Key takeaways
- GOOG closed at $371.89 on July 15, up from $357.33, on volume above 2.1 million shares.
- The daily RSI14 at 58.59 leaves meaningful room before reaching overbought territory.
- Alphabet’s $84.75 billion equity raise for AI infrastructure was upsized due to strong demand.
- The daily pivot structure targets R1 at $377.44 as the next logical upside objective.
- Hourly RSI14 at 73.6 and 15-minute RSI at 81.79 flag near-term exhaustion risk.
Alphabet Inc. Stock: Daily Structure Confirms Uptrend Acceleration
The daily chart for Alphabet Inc. stock leaves little room for doubt — the trend is bullish and gaining momentum. Price sits comfortably above all three key exponential moving averages, with the EMA stack confirming an established uptrend.
Notably, the EMA20 at $358.43 and the EMA50 at $357.33 are tightly stacked and rising. The EMA200 sits further below at $316.53. GOOG at $371.89 trades well above all three — a configuration that reflects momentum building within a mature trend.
Meanwhile, the MACD is at a critical inflection. The MACD line reads -0.50 against a signal line of -2.19. The histogram has turned positive at +1.69. The lines are crossing upward from below zero. This signals that buying pressure is only beginning to assert dominance on a daily basis.
Oscillator and Volatility Context
The daily RSI14 reads 58.59 — notably not overbought. There is meaningful room to run before the oscillator reaches stretched territory. Bollinger Bands place the upper boundary at $374.55, with the midline at $355.73. Price is pushing toward the upper band but has not tagged it yet.
In addition, the daily pivot structure is constructive. The pivot point sits at $366.61, with R1 resistance at $377.44 and S1 support at $361.07. At $371.89, GOOG stands above the daily pivot. This points toward R1 as the next logical target. ATR14 at $9.88 confirms daily swings near $10 are the norm, not the exception.
Intraday Charts Flash Exhaustion Signals for GOOG
While the daily picture is decisively bullish, the intraday timeframes for Alphabet Inc. stock tell a more nuanced story. Hourly and 15-minute oscillators are flashing overbought readings that demand attention.
Hourly Overbought Conditions
On the 1H chart, RSI14 has climbed to 73.6 — firmly in overbought territory. The MACD remains strongly positive, with the line at 3.83 against a signal of 1.73 and a histogram of +2.10. However, the hourly regime is classified as neutral rather than bullish.
That divergence between strong indicators and a neutral regime classification is meaningful. It suggests the intraday trend has extended significantly without consolidation. The 1H Bollinger upper band sits at $371.70 — essentially at the current close. Price at the edge of the envelope means the easy momentum trade may be temporarily exhausted.
Furthermore, the hourly pivot structure shows PP at $370.84, R1 at $373.20, and S1 at $369.54. On the upside, $373.20 is the immediate target. On the downside, $369.54 marks the first natural support to watch.
15-Minute Fading Momentum
On the 15m timeframe, RSI has reached 81.79 — deep in overbought territory. The MACD histogram has turned slightly negative at -0.20, even as the MACD line remains elevated. That is an early sign of short-term momentum fading at current levels.
At the same time, the 15m regime remains classified as bullish. All three EMAs are stacked in ascending order beneath price. The overall picture is one of a strong trend running into near-term exhaustion. It is not a reversal signal, but a warning of potential choppiness ahead. The 15m pivot places R1 at $372.37, closely aligned with the session high. That convergence of resistance with an overbought oscillator creates a natural friction zone.
Bullish Scenario for Alphabet Inc. Stock: Targets and Catalysts
The bullish case for Alphabet Inc. stock is well-supported by daily structure and fundamental catalysts. A clean break above $372.15 would open the path toward higher targets.
Specifically, a close above today’s high would open the door toward the daily upper Bollinger Band at $374.55 and eventually the daily R1 at $377.44. Both are realistic targets if the AI capital raise narrative continues to drive institutional flows. The $84.75 billion equity raise, upsized due to strong demand, signals the company is building infrastructure at scale.
Notably, 265 hedge funds hold stakes in the company. Any broad market risk-on shift — particularly around Federal Reserve pivot expectations — could act as a meaningful tailwind. On a technical basis, continued RSI daily expansion above 60 toward 65–70 would confirm accelerating momentum. A rising MACD histogram would provide the cleaner confirmation bulls need.
Bearish Scenario for Alphabet Inc. Stock: Invalidation Levels
In contrast, the risks to Alphabet Inc. stock merit clear mapping. The hourly overbought RSI and negative 15m MACD histogram create conditions for a near-term pullback.
However, if GOOG fails to break above $372.15 on follow-through volume, a drift toward hourly S1 at $369.54 becomes the path of least resistance intraday. On a more meaningful timeframe, a daily close below $361.07 — the daily S1 — would signal that today’s strong candle lacked confirmation. That would shift the picture from bullish continuation to range consolidation.
Furthermore, a break below $357.33 — where the EMA50 and the prior closing price coincide — would mark more serious technical deterioration. The equity offering itself carries structural risk. Dilutive capital raises of this magnitude can temporarily weigh on price if post-raise enthusiasm fades or deployment timelines disappoint.
Positioning and Volatility Outlook
Overall, Alphabet Inc. stock sits in a clearly defined bullish trend. Today’s price action provided a decisive upward push. The technical structure is strong, but short-term discipline remains essential.
On a structural level, the daily framework is compelling: price above all EMAs, a turning MACD histogram, and an RSI with room to run. The fundamental backdrop — the AI infrastructure raise, Berkshire’s disclosed conviction, and broad institutional ownership — provides a credible narrative behind the numbers. Still, hourly overbought conditions and the 15m MACD stall suggest the next move may not be straight up.
Meanwhile, volatility as measured by the daily ATR of $9.88 remains elevated. Both opportunity and risk are amplified at current levels. Traders watching for entries would be better served waiting for a modest hourly pullback toward support. Chasing a candle that has already moved nearly $16 on the day carries unnecessary risk. The trend is intact — but execution timing matters here.
FAQ
What is the next resistance level for Alphabet Inc. stock?
The daily R1 resistance sits at $377.44, with the daily upper Bollinger Band at $374.55 acting as an intermediate cap. A clean break above $372.15 — the July 15 session high — would be required first.
Is GOOG overbought on the daily timeframe?
No. The daily RSI14 reads 58.59, which is well below the traditional overbought threshold of 70. This leaves meaningful room for further upside before the oscillator reaches stretched territory.
What are the key risks to the bullish thesis for GOOG?
The primary near-term risk is the hourly RSI14 at 73.6 and the 15-minute RSI at 81.79, both signaling overbought conditions. A daily close below $361.07 would invalidate the immediate bullish continuation case. The $84.75 billion equity raise also carries dilutive risk if post-raise enthusiasm fades.
What is driving bullish sentiment around Alphabet?
Alphabet’s $84.75 billion AI infrastructure equity raise — upsized due to strong demand — is a major catalyst. Additionally, Warren Buffett confirmed his personal conviction in the stock. Meanwhile, 265 hedge funds hold positions, reinforcing institutional confidence behind the name.
Disclaimer: This article is for informational purposes only and does not constitute financial advice, an investment recommendation, or a solicitation to buy or sell any financial instrument or cryptocurrency. The analysis provided is not indicative of future results. Investing in crypto assets and financial markets carries a high risk of capital loss. Always do your own research (DYOR) and consult a qualified financial advisor before making any decision.
Article produced with the assistance of artificial intelligence and reviewed by the editorial team.
