




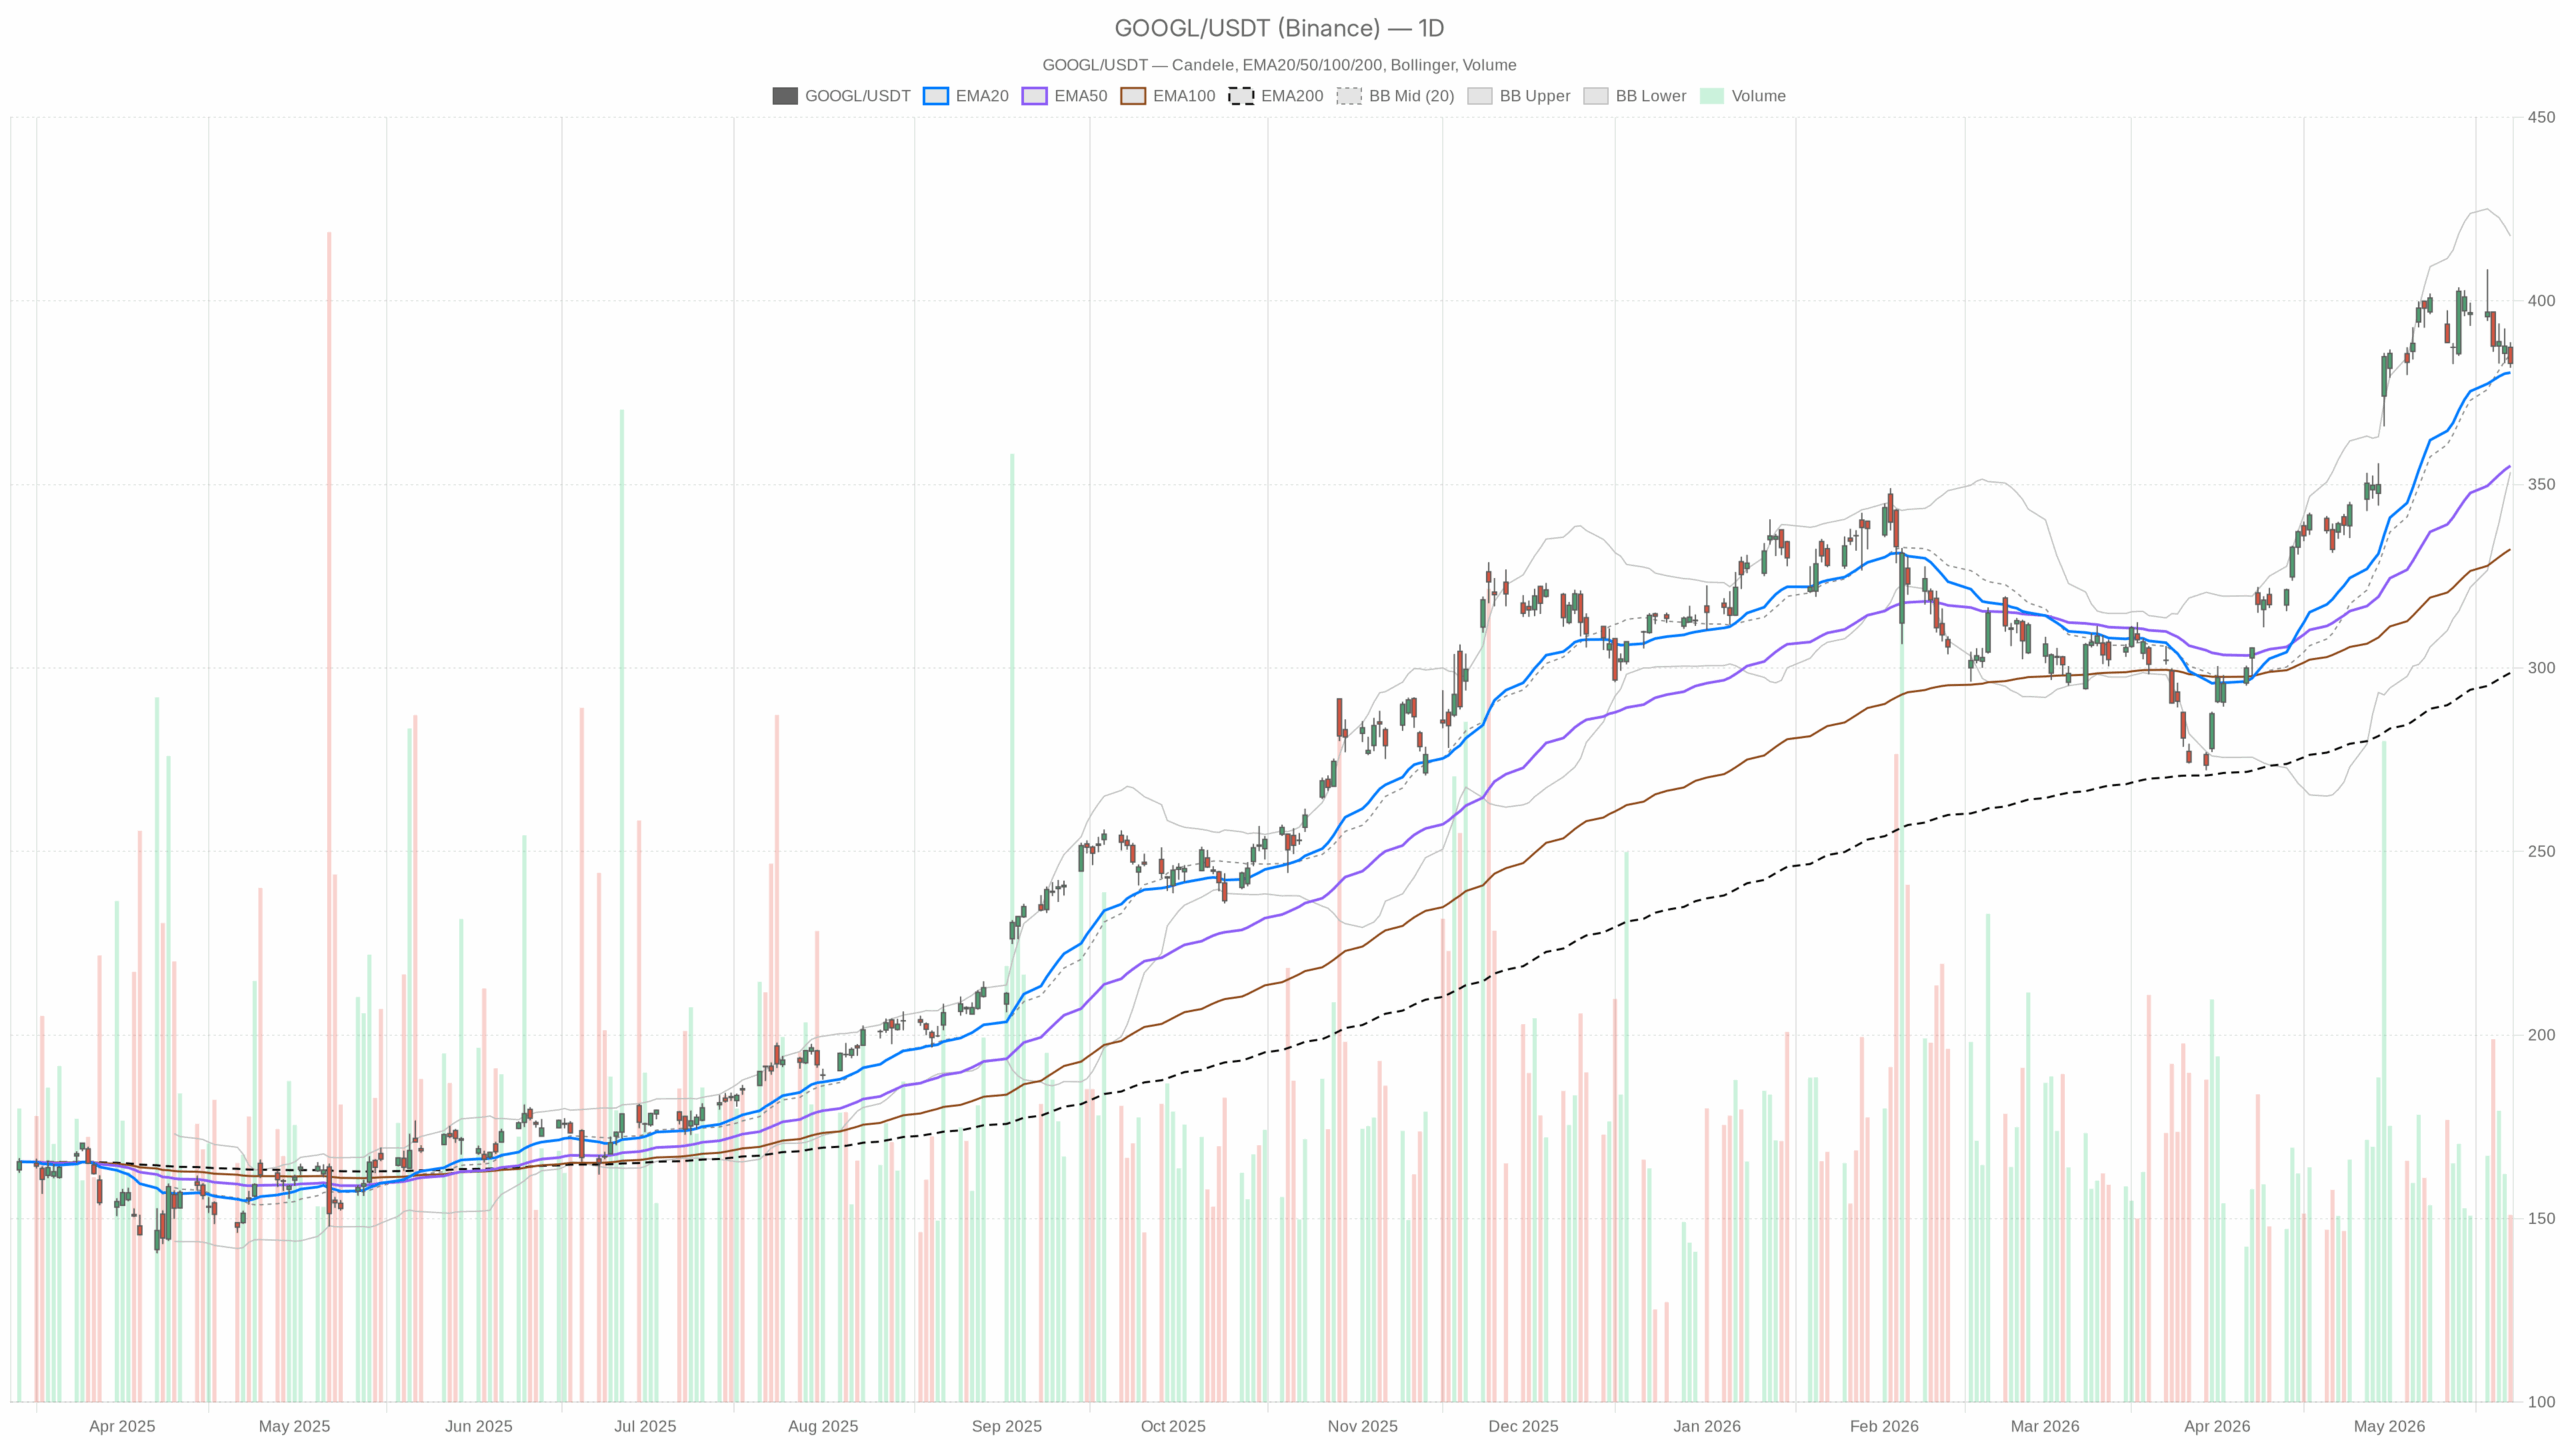
Alphabet Stock remains in a primary uptrend, though momentum has cooled into nearby support, keeping the near-term tone cautious while the broader structure stays constructive.
Summary
Alphabet Stock Daily Trend: Uptrend Intact, Momentum Cooling
Trend and Moving Averages
Price closed at 382.97 on May 22 and remains above key moving averages, yet it slipped under short-term reference levels. The tone is cautious rather than weak. Price sits above the 20-day EMA (380.45), the 50-day EMA (355.09), and the 200-day EMA (298.69). That alignment keeps the trend bullish and pullbacks buyable while those levels hold.
Momentum, Range, and Pivots
Meanwhile, the daily RSI(14) at 57.49 is constructive without being stretched. That shows positive momentum with room before overbought. The daily MACD line (13.62) is below its signal (17.15) with a negative histogram (-3.53), pointing to waning momentum and a consolidation phase within the uptrend.
Daily Bollinger Bands have a mid-line at 385.48 with price closing below it, and bands spanning 353.32 to 417.65. That indicates digestion below the mean within a wide range. The ATR(14) at 9.89 implies active but manageable daily volatility. The daily pivot is 384.49 with R1 at 387.22 and S1 at 380.25, placing immediate resistance just overhead and first support close by.
Hourly Chart: Short-Term Weakness Within the GOOGL Uptrend
Intraday Trend and Momentum
On the 1-hour chart, price near 383 trades below the 20-hour EMA (387.15) and 50-hour EMA (389.74) but above the 200-hour EMA (370.90). That mix says sellers control the tape intraday while the bigger trend remains intact. The hourly RSI(14) at 34.79 is soft but not oversold, reflecting pressure with rebound potential if catalysts emerge.
In addition, the hourly MACD line (-2.07) is below its signal (-1.81) with a slightly negative histogram (-0.26). That setup keeps downside pressure alive for now.
Bands, Volatility, and Pivot
Hourly Bollinger Bands center at 386.80 with the lower band near 382.38, and price is hugging that lower edge. That shows short-term stretch and scope for mean-reversion attempts. The ATR(14) at 2.79 frames a roughly $2–$3 intraday swing.
Meanwhile, the hourly pivot sits at 382.68 with R1 at 383.60 and S1 at 382.09. Price is straddling the pivot with very nearby support and resistance.
15-Minute Execution Layer: Tactically Bearish Bias
On the 15-minute view, the bias is tactically bearish. Price is below the EMA20 (384.89), EMA50 (386.45), and EMA200 (390.68). That signals a micro downtrend until those are reclaimed. The RSI(14) at 34.66 shows weak momentum with only modest dip-buying attempts.
Furthermore, the MACD line (-1.22) is below its signal (-0.98) and the histogram is negative (-0.24), saying the turn has not arrived yet. Bollinger Bands show the mid at 385.25 and the lower band at 382.09, with price just above that lower band. That favors bounces fading unless the 20-EMA is recaptured. The ATR(14) at 0.98 indicates roughly $1 swings. The intraday pivot is 382.68 with R1 at 383.60 and S1 at 382.09, defining a tight battlefield for entries and stops.
Fundamental Cross-Currents Shaping Alphabet Stock
Notably, fundamentals and headlines are mixed and help explain the intraday hesitation in GOOGL shares:
- Google cut prices on its Gemini enterprise offering by about 20% to undercut rivals. That supports adoption but raises margin questions near term.
- Reports that a prominent hedge fund largely exited Alphabet in favor of another AI heavyweight can cap rallies as investors reassess positioning.
- In contrast, a new Google Cloud–Thales partnership to launch a sovereign cloud in Germany could bolster European enterprise traction.
- Meanwhile, commentary highlighting rising CapEx and the risk of a “reset” offsets bullish takes that point to strong 12‑month performance.
Trading Scenarios, Triggers, and Validation for Alphabet Stock
Therefore, the main scenario remains cautiously bullish on the daily timeframe, but it requires confirmation. A push back above the daily pivot at 384.49 and the daily Bollinger mid near 385.48 would be the first step. That would be stronger if the 1-hour chart reclaims the 20-hour EMA at 387.15, and it decisively clears hourly R1 at 383.60. The interpretation is simple: get back above the near-term means and let momentum rebuild.
Bullish triggers and follow-through: A sustained hourly close back above 385–387 that tilts hourly RSI through 50 and flips the hourly MACD positive would validate the rebound. That would open a run toward daily R1 at 387.22 and, if momentum broadens, toward the hourly upper band area near 391. This sequence would show buyers retaking control without stretching risk.
On the other hand, bearish scenario: The case gains traction if supports break. A loss of hourly S1 at 382.09 followed by a daily close below 380.25 (daily S1) and the 20-day EMA at 380.45 would undercut the bullish case. That would shift risk toward the lower portions of the daily Bollinger envelope over time at 353.32. The interpretation is that failed mean reversion turns into trend pressure.
Validation terms: The bullish view is invalidated on sustained closes below the 380 area with hourly EMAs acting as firm resistance and MACD remaining negative. Conversely, the bearish case loses steam if price quickly reclaims 384.5–385.5, resets above the hourly 20-EMA, and sees RSI stabilize above 50. Those would argue the pullback was simply a pause.
Overall, positioning favors respecting the primary uptrend but acknowledging short-term softness. Volatility is active across timeframes, and nearby pivots are tight. Until the hourly chart turns up, expect two-way trade and fading strength into resistance. Once reclaimed, the path of least resistance can re-align higher within the broader Alphabet Stock uptrend.
