
NVIDIA keeps delivering blockbuster earnings, yet NVDA has gone nowhere for months. That disconnect defines the tension right now. As of June 12, shares closed at $205.19 — below both the 20-day and 50-day EMAs. The narrow range signals investor fatigue more than confidence. The daily regime is neutral.
Summary
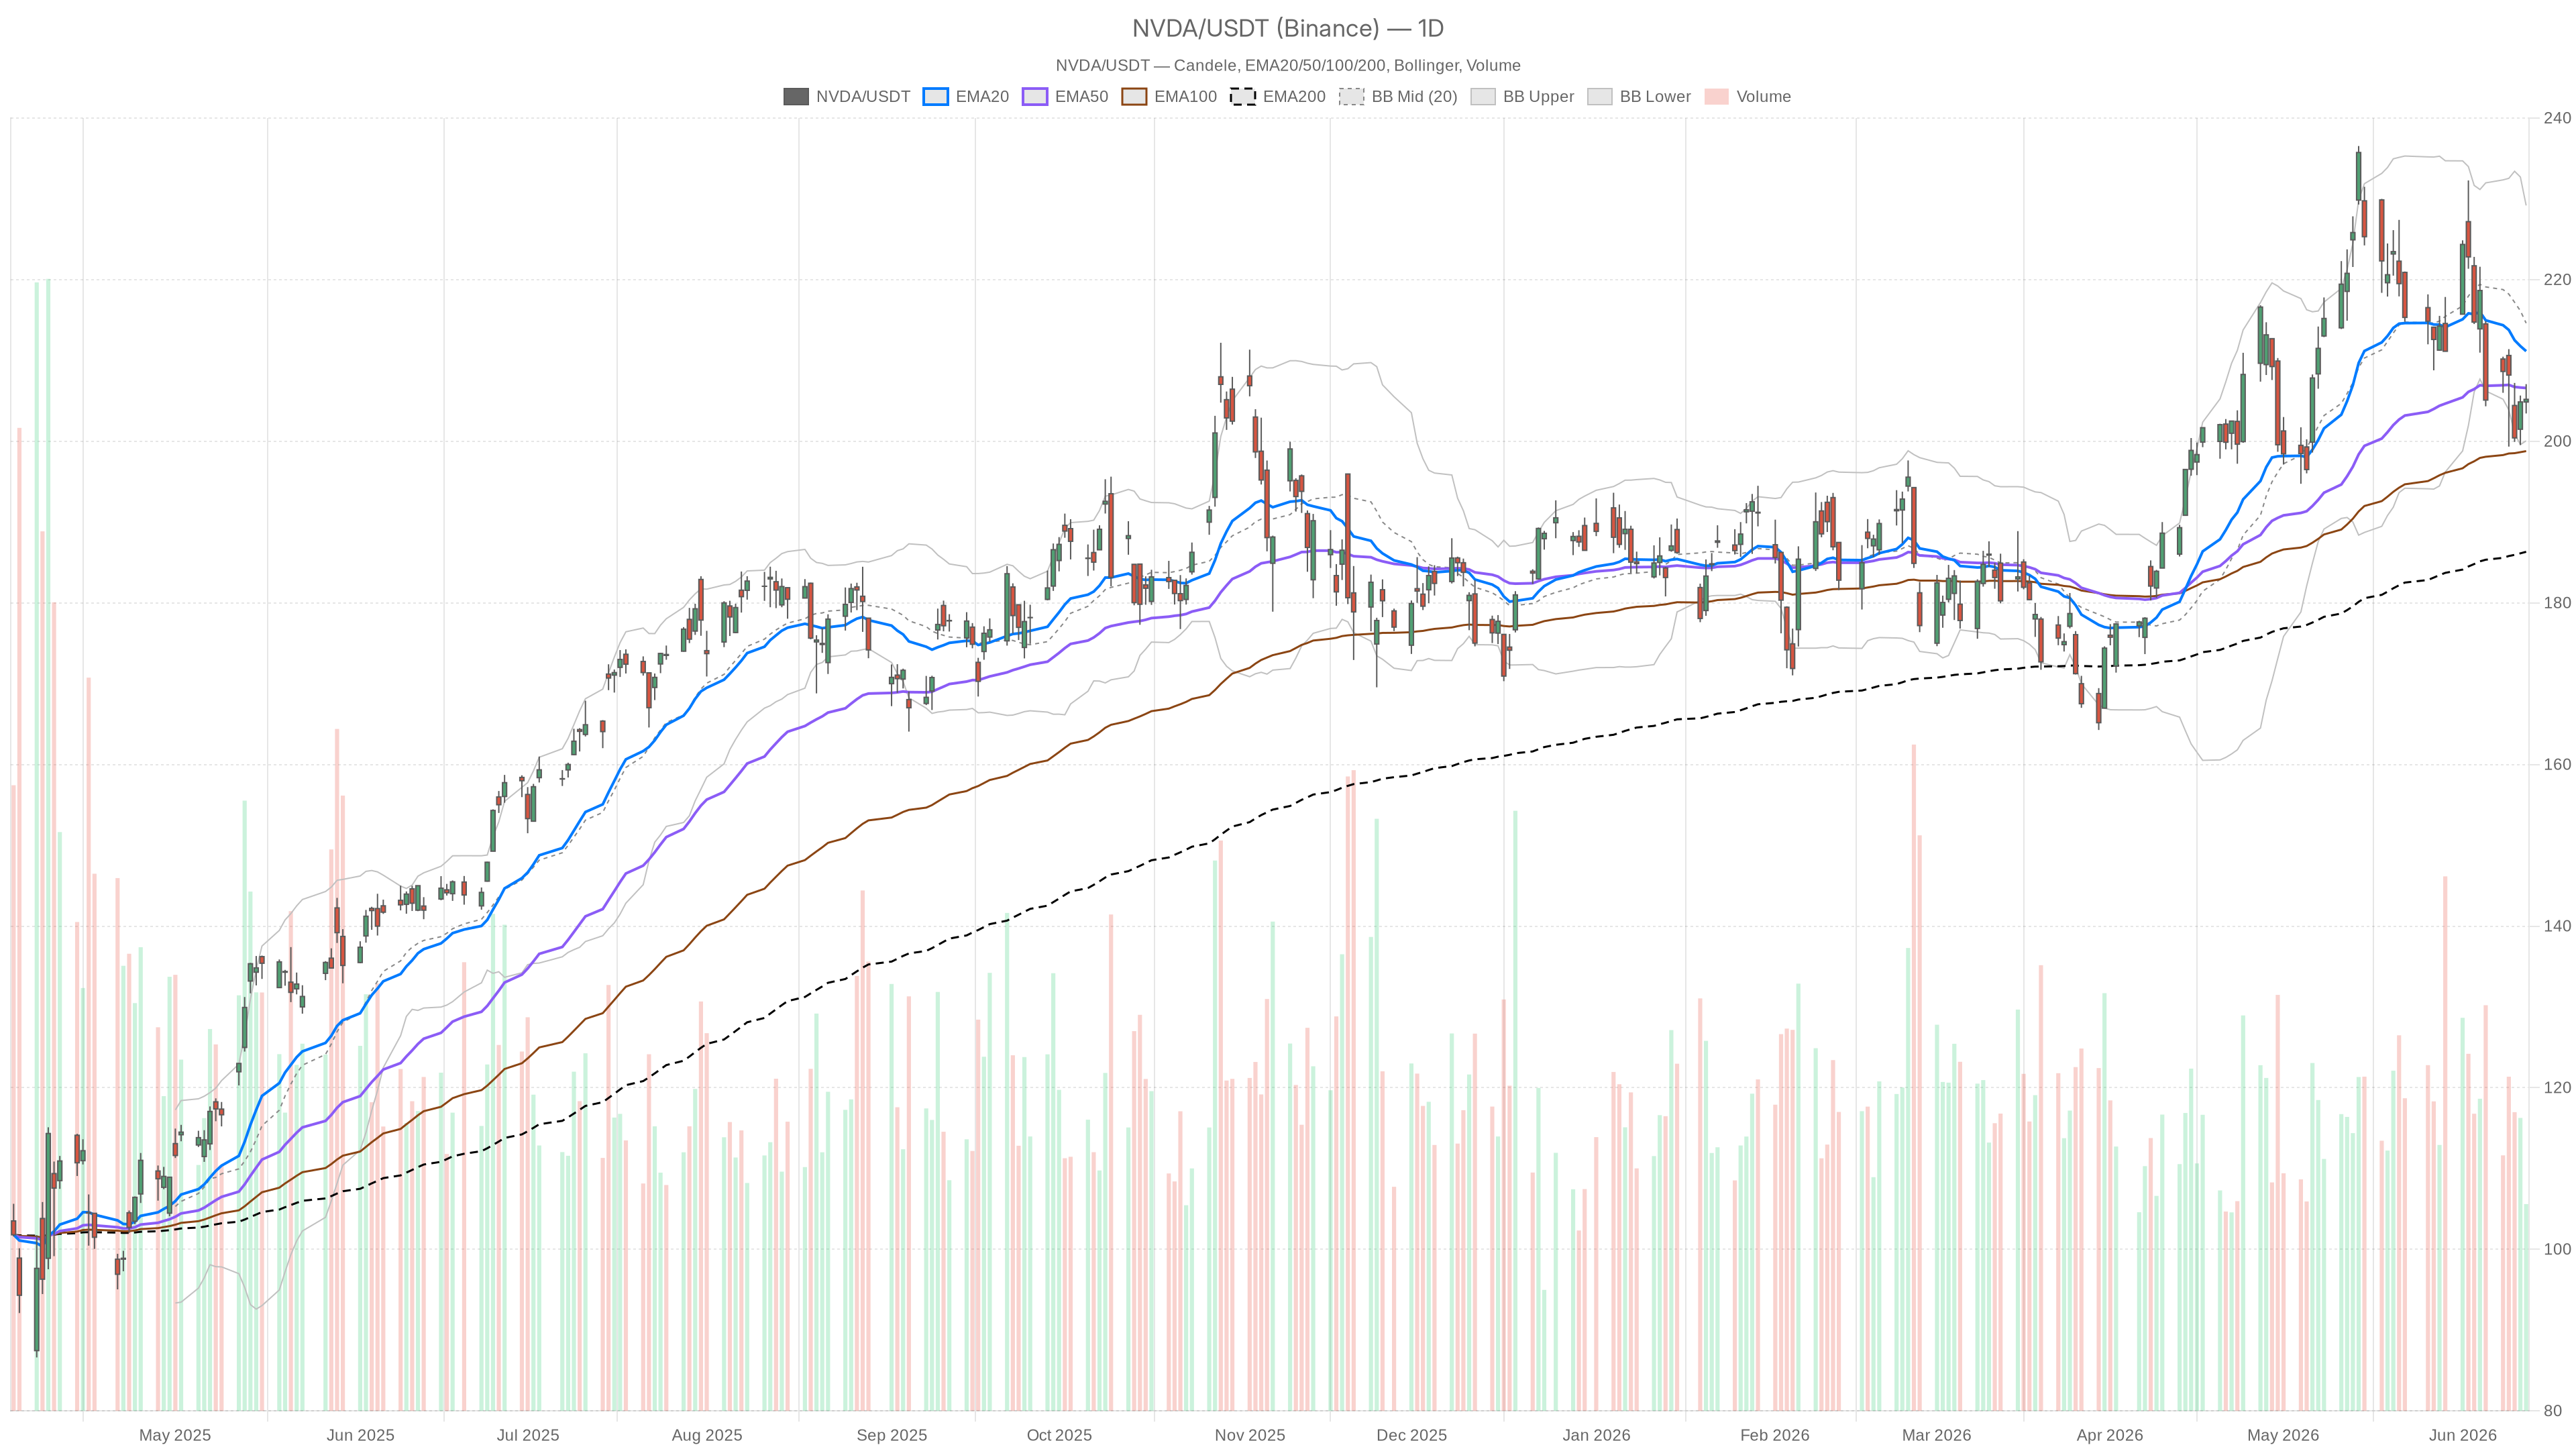
Daily Technical Structure Signals Distribution
On the daily timeframe, the main bias leans modestly bearish. Price is trading beneath the EMA20 at $211.15 and the EMA50 at $206.59. This means the market is struggling to reclaim its own short-term and medium-term moving averages. NVDA remains well above the EMA200 at $186.32, which preserves the longer-term structural uptrend. However, in the near term, sitting below both the EMA20 and EMA50 is a meaningful sign of distribution rather than accumulation.
Meanwhile, daily pivot analysis places the pivot point at $205.23, resistance R1 at $207.03, and support S1 at $203.40. NVDA closed at $205.19 — a fraction below the daily pivot. That marginal miss is telling. It suggests the market lacks conviction to hold above even a basic equilibrium level. A failure to reclaim $207 with volume would confirm the bears remain in control on this timeframe.
Momentum and Volatility Indicators Flash Caution
The daily MACD reinforces this concern. Currently, the MACD line stands at -1.10 and the signal at +1.26, producing a deeply negative histogram of -2.36. That reading reflects sustained downward momentum — not a brief oscillation, but a genuine bearish trend. RSI14 at 45.24 is sub-neutral and declining. Together, these indicators point to controlled selling pressure rather than panic, but selling pressure nonetheless.
Bollinger Bands on the daily chart add another layer to this narrative. The midline sits at $214.62, well above current price, and the lower band at $200.06 is approaching. Price trading in the lower half of the Bollinger envelope confirms the bearish bias. Meanwhile, daily ATR at $8.33 highlights that NVDA is not a low-volatility name. Any directional move can cover meaningful ground quickly — which matters enormously around nvidia earnings catalysts.
Lower Timeframes Show Stabilization Without Confirmation
Shifting to the 1-hour chart, the picture grows more complicated — but not necessarily more hopeful. Price at $205.13 sits just above the EMA20 at $204.63 on the hourly, which is a marginal positive. However, the EMA50 at $207.24 and the EMA200 at $211.25 are both overhead and declining relative to price. That descending EMA stack is a structural headwind. It means any intraday rally faces layered resistance.
Hourly Chart Shows Stabilization Without Conviction
On the other hand, the hourly MACD histogram has turned positive at +0.54, even as the MACD line at -0.41 remains below zero. This crossover marks a short-term improvement, suggesting the pace of selling is decelerating on the hourly basis. Hourly RSI at 50.18 sits exactly at the midpoint, offering no directional edge on its own. The regime on this timeframe is also flagged as neutral, confirming what the daily is saying: there is no clean trend to trade in either direction right now.
Meanwhile, the 15-minute timeframe adds limited strategic value, but it does provide useful execution context. Price closed at $205.13, with MACD nearly balanced — line at +0.20, signal at +0.32, histogram at -0.12. The RSI at 53.84 is mildly constructive. ATR at $0.67 indicates tight intraday ranges. In practical terms, the very short-term tape is modestly firm but lacks any meaningful momentum. This is a market waiting for a catalyst, not building toward one.
The NVIDIA Earnings Paradox: Strong Fundamentals, Stagnant Price
Meanwhile, the narrative surrounding NVDA is rich with anticipation. Multiple sources point to the second half of 2026 as a potentially defining period. The company is expanding into new multibillion-dollar markets beyond data center GPUs. Harvard University’s endowment holds a $129 million position, and NVDA remains a near-consensus AI stock pick among institutional investors.
Year-to-date the stock has gained approximately 8% — broadly in line with the S&P 500. That is remarkable underperformance for a company still posting record nvidia earnings. This is the core paradox: strong fundamentals, stagnant price action.
NVDA Scenarios: Key Levels to Watch
Bullish Case: Reclaiming $207–$211
For the bullish scenario to materialize, NVDA needs a decisive reclaim of the $207–$211 zone. Specifically, a close above the EMA50 at $206.59 on the daily would begin to neutralize the current bearish technical setup. A follow-through above the EMA20 at $211.15, accompanied by a daily MACD histogram turning positive, would flip the bias. Any earnings-driven catalyst or AI demand acceleration in H2 2026 could serve as the trigger. Institutional ownership provides a structural demand floor that limits downside in a meaningful correction.
Bearish Case: Breakdown Below $200
In contrast, the bearish scenario centers on a failure to hold the $203.40 support level. This level corresponds to daily S1 and approaches the lower Bollinger Band at $200.06. A close below $200 would represent a psychologically significant breakdown. Given the daily ATR of $8.33, such a move could develop within one or two sessions if sentiment turns sharply negative. Continued underperformance relative to the broader market — while earnings remain strong — would signal a deeper re-rating of AI growth expectations.
Overall Assessment: Sideways to Lower Until Proven Otherwise
Overall, NVDA sits at a genuine inflection point. The daily timeframe is technically soft but not broken. The hourly is stabilizing without confirming any recovery. The 15-minute chart shows a quiet market bracing for direction. With volatility capable of delivering $8+ daily moves, positioning here carries real risk in both directions. The nvidia earnings story remains compelling, but the price structure, for now, does not. Until the stock reclaims its short-term moving averages with conviction, the path of least resistance remains sideways to lower. Patience is likely the most defensible posture.
Disclaimer: This article is for informational purposes only and does not constitute financial advice, an investment recommendation, or a solicitation to buy or sell any financial instrument or cryptocurrency. The analysis provided is not indicative of future results. Investing in crypto assets and financial markets carries a high risk of capital loss. Always do your own research (DYOR) and consult a qualified financial advisor before making any decision.