

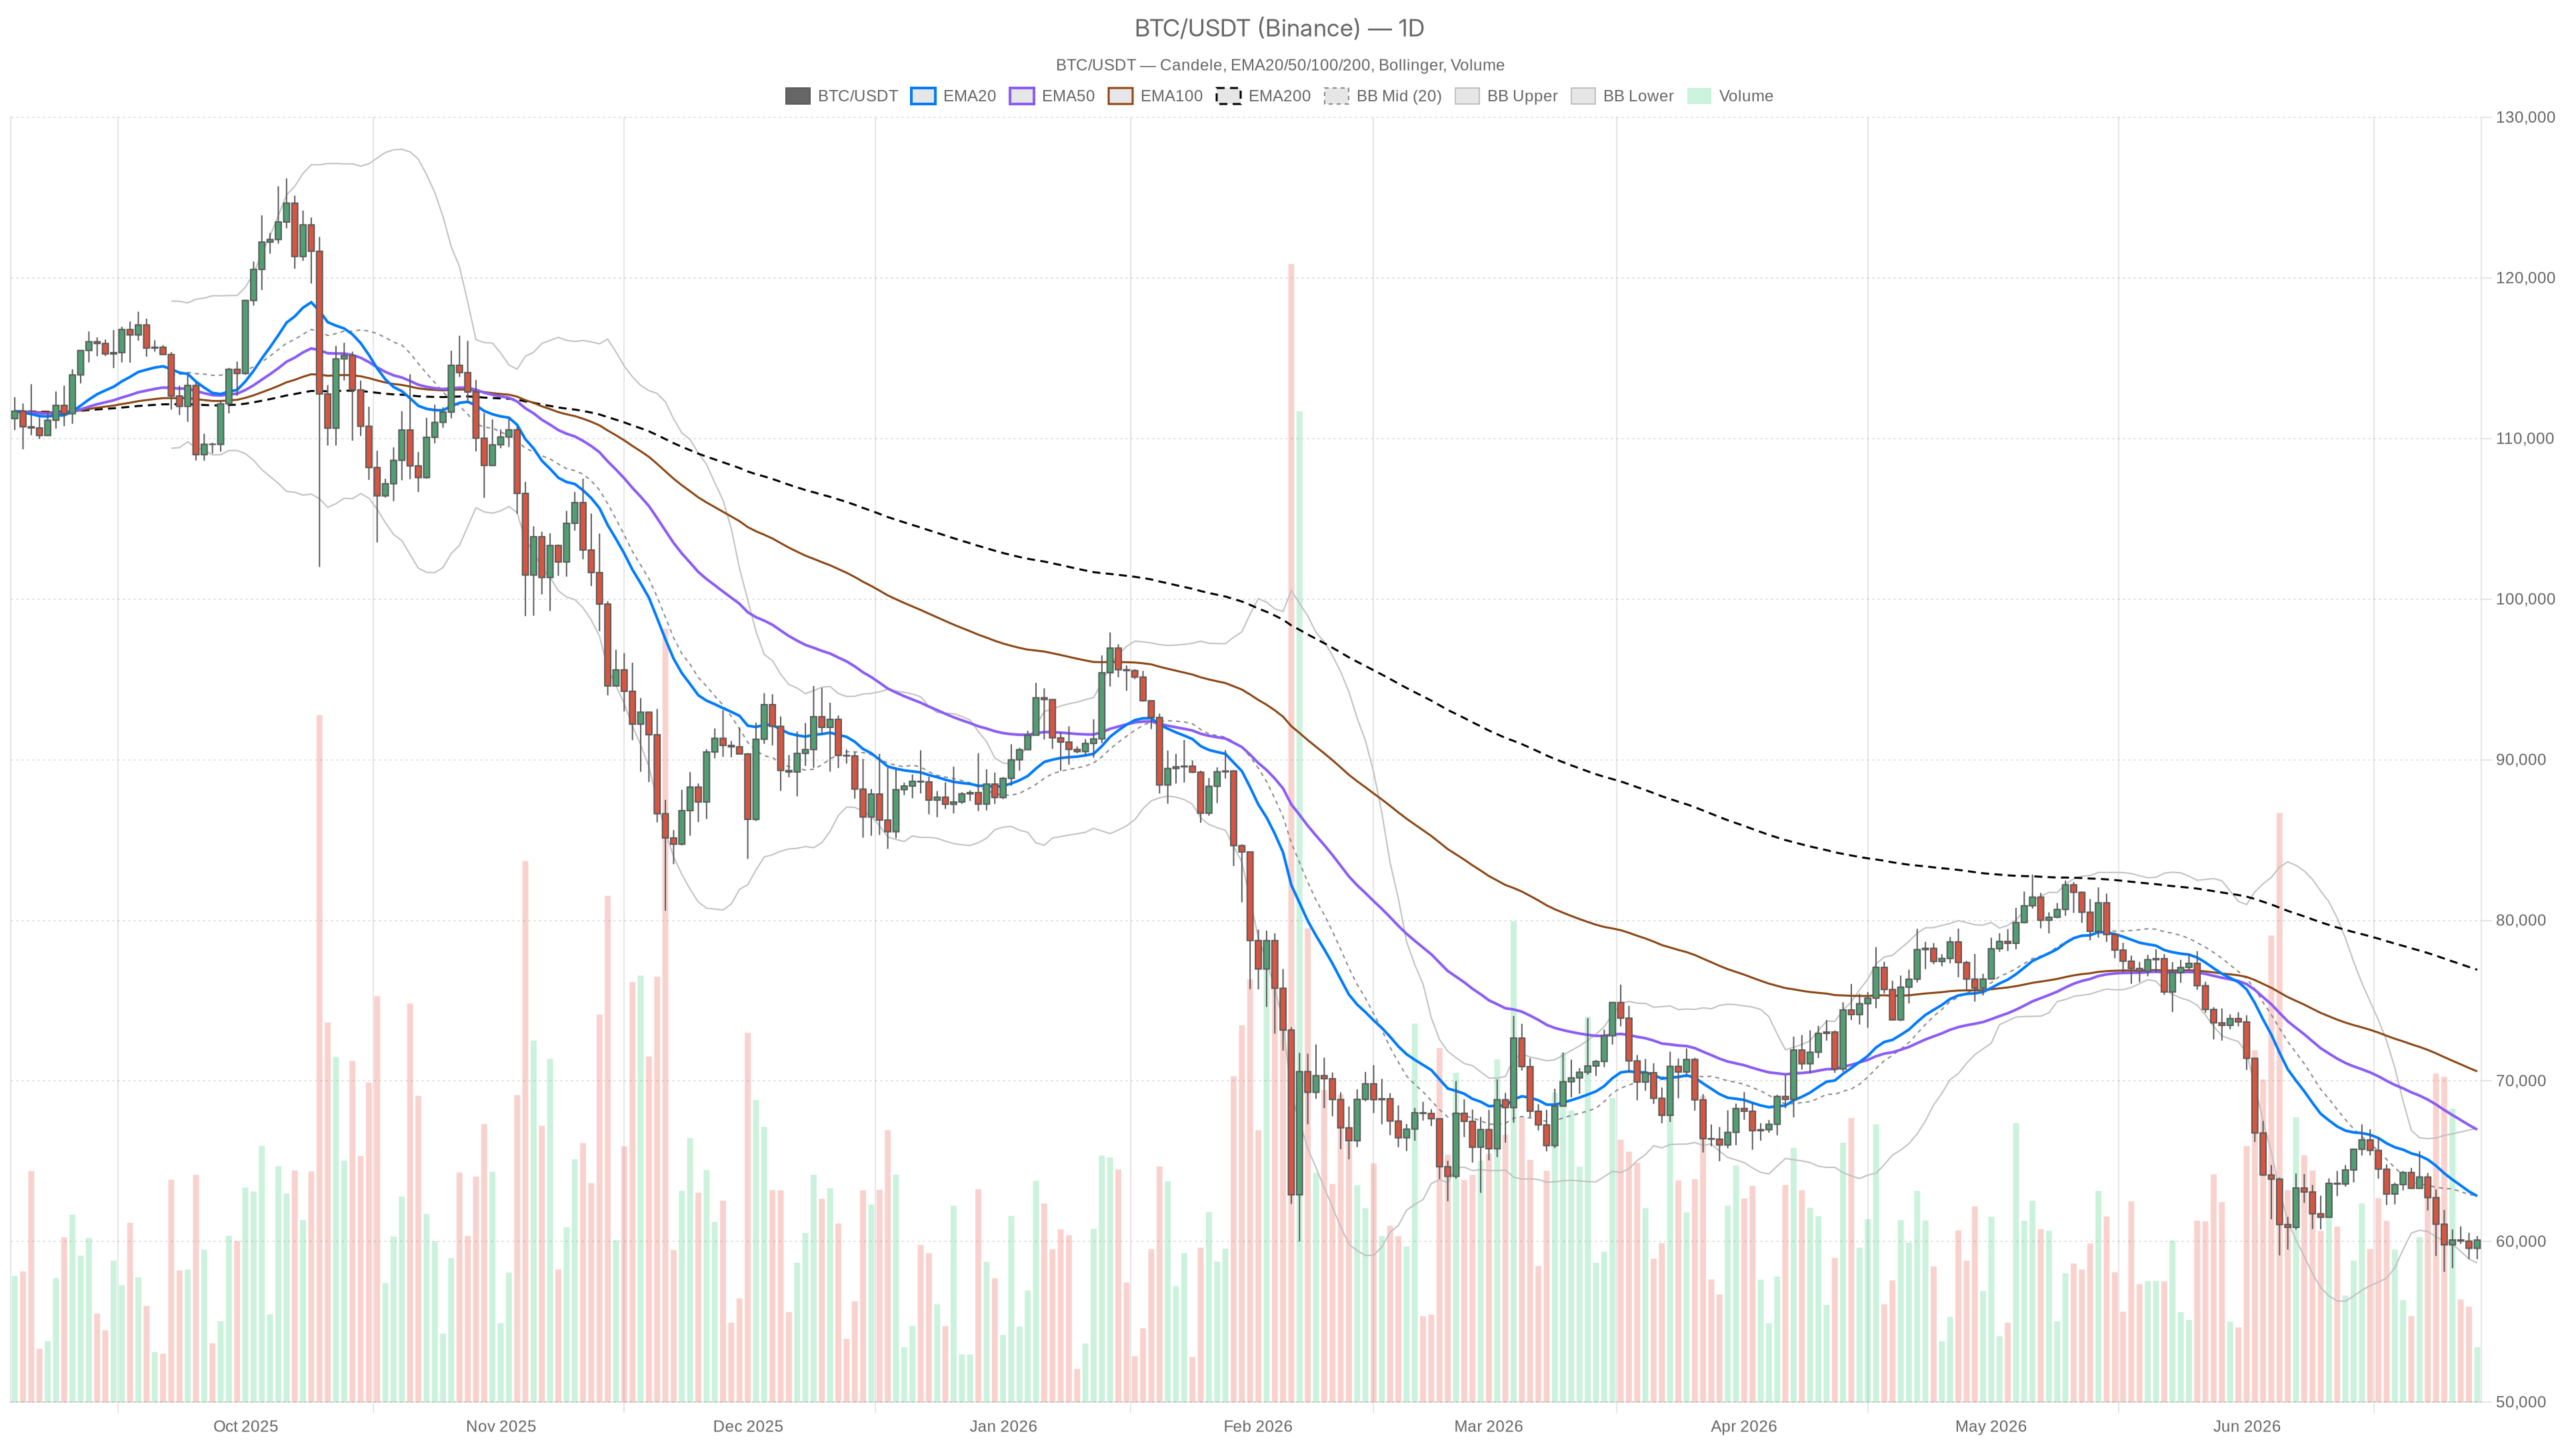
As of June 29, 2026, the Bitcoin price today sits at the $60,000 psychological threshold — a level that feels less like a floor and more like a final line of defense. Sustained selling pressure dominates the daily chart, with every major moving average sitting well above current price.
Summary
Key takeaways
- Bitcoin is trading at $60,090 on June 29, 2026, clinging to the critical $60K psychological level.
- The daily structure remains bearish, with price below the 20-day, 50-day, and 200-day EMAs.
- Daily RSI sits at 33.52, approaching but not yet touching oversold territory below 30.
- Fear & Greed Index reads 12, deep in Extreme Fear — historically consistent with both bottoms and continued selling.
- The $59,200 support and $62,800 resistance define the immediate range traders must monitor.
The Daily Chart: Structurally Bearish
The D1 regime is confirmed bearish — price at $60,090 trades below the 20-day EMA at $62,828, below the 50-day at $66,970, and dramatically below the 200-day EMA at $76,924. That stacking, with price under every major dynamic level, is not a warning sign; it is a confirmation that the trend remains firmly downward.
The daily RSI at 33.52 hovers just above oversold territory. It has not cracked below 30 yet, which means the kind of panic reading that historically precedes sharp reversals has not materialized. However, oversold conditions can persist for extended periods in a trending bear market. This reading suggests the selloff is maturing — not ending, but becoming stretched on the downside.
The MACD on the daily is negative, with the line at -2,313 and the signal at -2,308. The histogram at -5.55 is essentially flat, meaning bearish momentum has not accelerated recently, yet it has not turned either. This is a market bleeding out slowly rather than crashing violently — for now.
Bollinger Bands place the midline at $62,848 and the lower band at $58,670. Price is well below the midline and compressing toward the lower band, signaling elevated volatility with a persistent downward bias. The ATR of $2,128 confirms this is a high-volatility environment where daily swings of $2,000 or more are entirely normal. Any position sizing that ignores that figure is asking for trouble.
Daily pivot mechanics offer a thin constructive layer: the pivot point sits at $59,779, with R1 at $60,657 and S1 at $59,211. Bitcoin currently hovers between the pivot and R1, which means the short-term structural reference is neutral-to-slightly-constructive on a micro level. That said, this is a very narrow zone in the context of a deeply bearish macro picture.
The Hourly Chart: A Bounce, Not a Reversal
The 1H picture offers a brief respite. Price at $60,095 has reclaimed both the 20-EMA at $59,866 and the 50-EMA at $60,007, which counts as a short-term positive. The 1H RSI at 54.41 sits in neutral-bullish territory, and the MACD histogram is clearly positive at +80 — a meaningful swing from negative readings earlier in the session. The hourly regime is classified as neutral, which fits: this is recovery behavior, not trend reversal.
The 200-EMA on the 1H at $61,323 is the level to watch. Until price can clear and hold above that threshold, the intraday bounce remains noise inside a larger downtrend. Buyers showing up around $59,800-$59,900 is encouraging, but enthusiasm should be kept firmly in check. The 1H Bollinger midline at $59,771 now sits below price, confirming at minimum that short-term momentum has shifted upward.
15-Minute: Execution Context Only
On the 15-minute timeframe, all three EMAs — 20, 50, and 200 — are clustered tightly between $59,825 and $59,957, with price above all of them at $60,097. The RSI at 56.88 and a positive MACD histogram at +9.88 confirm very short-term bullish momentum. For traders looking to time entries, the 15m structure supports the current bounce, but it is a granular tool, not a thesis driver.
Market Breadth and Sentiment
According to CoinGecko data, total crypto market cap stands at approximately $2.155 trillion, down a marginal 0.12% in 24 hours. Bitcoin dominance holds at 55.8%, which is notable. When dominance stays elevated during a downturn, it typically signals that altcoins are bleeding even harder — not a sign of broad market health, but rather capital concentration into the perceived safest large-cap crypto.
The Fear & Greed Index reads 12, deep in Extreme Fear territory. Historically, such readings have coincided with bottoming processes, but they are also entirely consistent with continued selling in the early stages of a bear phase. Moreover, DEX volumes on Uniswap V3 have spiked 31% in the past 24 hours per DefiLlama data, likely reflecting panic swaps and defensive repositioning rather than fresh risk appetite. When DeFi volumes jump during a price drop, it is rarely bullish.
The Bull Case
For a credible recovery to begin, Bitcoin needs to reclaim the $62,800 area — the D1 20-EMA and Bollinger midline — and hold it on a closing basis. Above that, $66,900, the 50-EMA, becomes the next real target and the level that would start repairing the trend structure. A catalyst that could force shorts to cover would help: a surprise ETF inflow reversal, a macro shift such as rate cut expectations or dollar weakness, or simply time allowing the RSI to reset further.
If the $58,670 lower Bollinger band holds on any retest, and the daily RSI dips below 30 before bouncing, the setup for a mean-reversion trade toward $63,000-$65,000 becomes interesting. However, that scenario requires patience and precise timing — neither of which the current volatility environment accommodates easily.
The Bear Case
Losing $59,211 — the S1 daily support — on a closing basis would represent a meaningful deterioration. Below that level, limited technical structure exists until roughly $56,000-$57,000. If the macro narrative around ETF outflows accelerates or confidence in institutional Bitcoin treasury strategies erodes further, the demand side simply is not there to absorb disciplined selling.
The CNBC-cited 30% downside scenario would place Bitcoin somewhere around $42,000. That is not the base case, but the chart structure does not allow anyone to dismiss it outright either. The daily trend is broken, and fighting it without confirmation of a reversal carries asymmetric risk.
Positioning and Final Thoughts
Bitcoin is at the kind of level where conviction needs to be earned, not assumed. The daily structure is broken, while the hourly chart is showing signs of life. Those two conditions can coexist for days or weeks before one of them definitively wins. The ATR above $2,100 on the daily means this market will punish tight stops and reward patience. Extreme Fear at 12 suggests the crowd is scared — which is often where the best opportunities eventually emerge — but eventually can be a frustrating timeline when price keeps making lower lows.
The clearest read right now: the dominant force is bearish momentum meeting an oversold bounce. Neither side has full conviction. Anyone operating in this environment should size positions accordingly, respect the volatility, and treat the $59,200 support and $62,800 resistance as the two lines that define which scenario is actually unfolding. Everything between those two levels is noise.
FAQ
What is Bitcoin’s current price and why does the $60K level matter?
Bitcoin is trading at approximately $60,090 as of June 29, 2026. The $60,000 threshold is a psychological battleground — losing it on a closing basis, particularly below the S1 support at $59,211, would open the door to limited technical structure until the $56,000-$57,000 range.
Is the Bitcoin price structure currently bullish or bearish?
The daily structure is firmly bearish. Price sits below all three major moving averages — the 20-day EMA at $62,828, the 50-day at $66,970, and the 200-day at $76,924. The hourly chart shows a short-term bounce, but that remains noise within the larger downtrend until price reclaims at least the $62,800 level.
What key levels should traders watch right now?
The two critical lines are $59,200 as support and $62,800 as resistance. A closing break below $59,211 (S1) would signal meaningful deterioration. Conversely, reclaiming $62,800 on a closing basis would be the first credible step toward trend repair, with $66,900 as the next upside target.
What does the Fear & Greed Index at 12 indicate?
A reading of 12 places the market deep in Extreme Fear territory. Historically, such levels have coincided with bottoming processes, but they can also persist during extended bear phases. The reading suggests widespread capitulation among retail participants, which sometimes precedes opportunity but does not guarantee an immediate reversal.
Disclaimer: This article is for informational purposes only and does not constitute financial advice, an investment recommendation, or a solicitation to buy or sell any financial instrument or cryptocurrency. The analysis provided is not indicative of future results. Investing in crypto assets and financial markets carries a high risk of capital loss. Always do your own research (DYOR) and consult a qualified financial advisor before making any decision.
Article produced with the assistance of artificial intelligence and reviewed by the editorial team.