

As of June 23, 2026, the Bitcoin price today tells a story far more uncomfortable than the $62,425 level suggests. The broader crypto market has shed nearly 2.6% of its total capitalization in 24 hours, with total market cap now sitting just above $2.22 trillion. Bitcoin dominance holds at 56.2% — capital is simply leaving the space.
Summary
Key takeaways
- Bitcoin trades at approximately $62,425, well below all major daily EMAs including the 200-day at $77,998.
- The Fear & Greed Index sits at 23 (Extreme Fear), historically signaling either capitulation or its prelude.
- Daily RSI at 36.59 leaves room for further downside before momentum mechanically exhausts.
- The lower daily Bollinger Band at $60,587 is the critical support level defining the next significant move.
- Hourly RSI has reached 25.26 (oversold), but the MACD remains deeply negative and still accelerating.
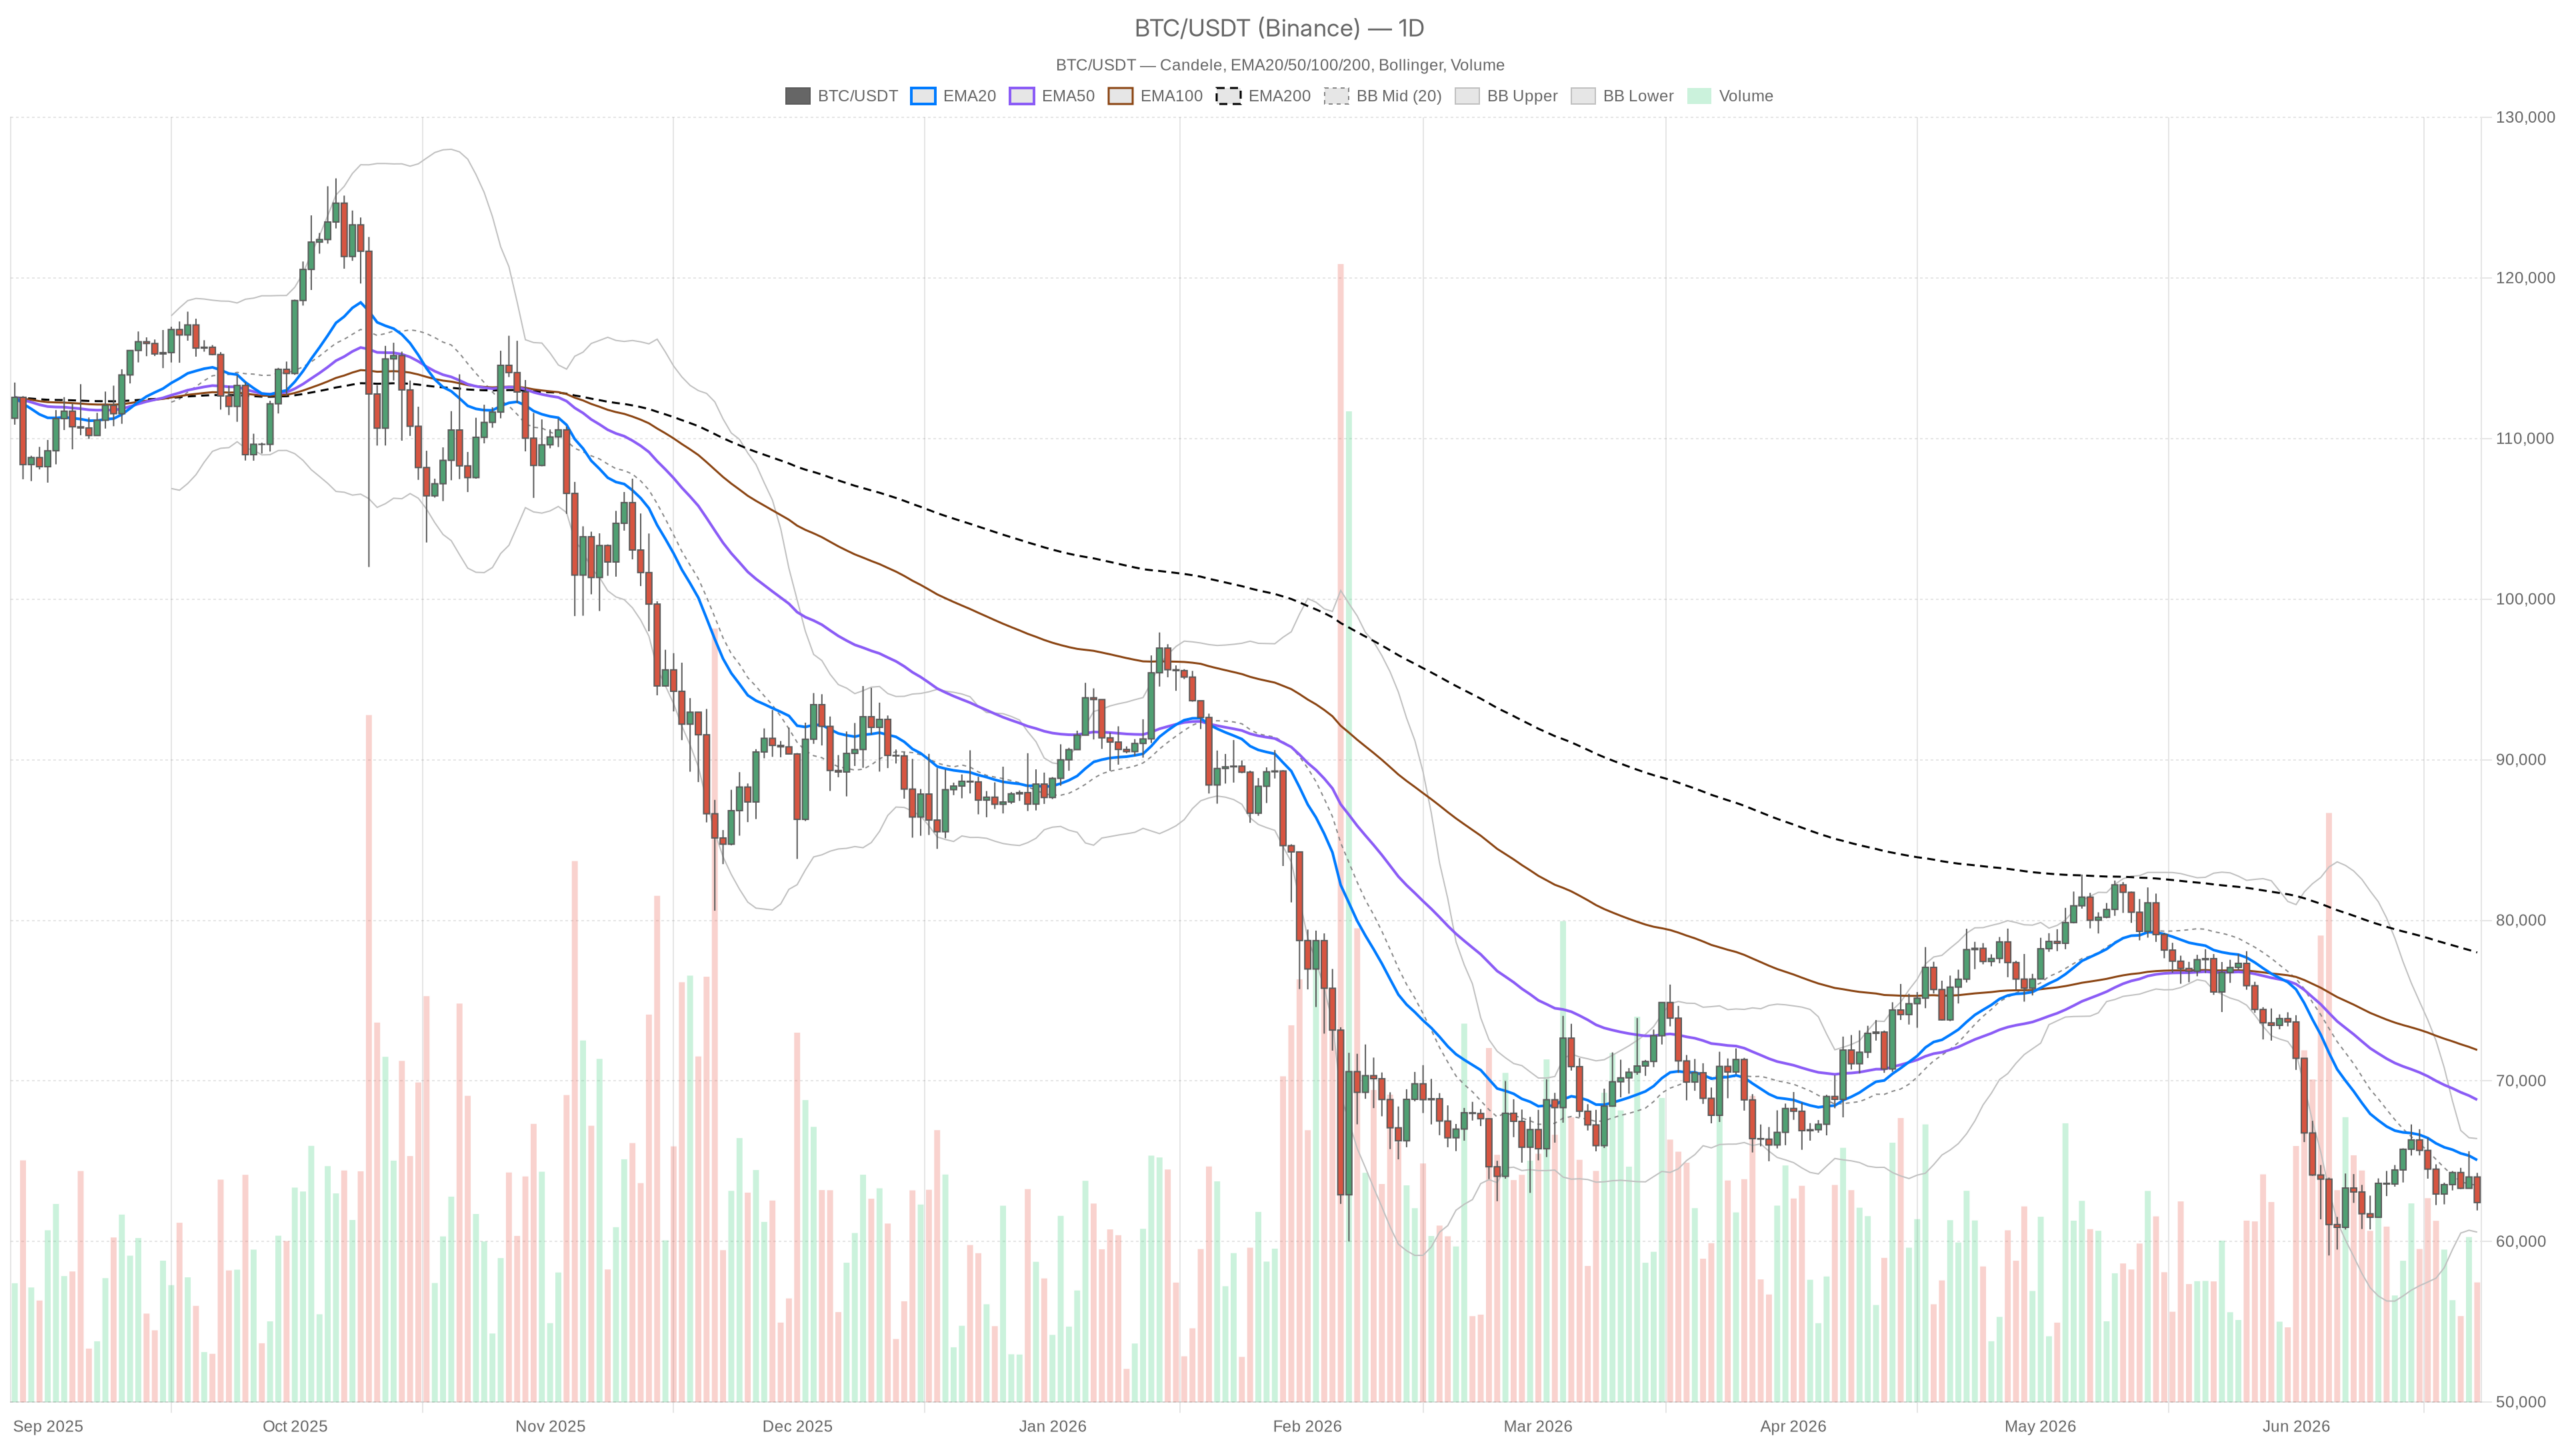
The Daily Chart: A Bearish Regime With One Thread of Hope
The daily chart confirms a sustained bearish trend with no immediate reversal signal in sight. Price closed at $62,425 — well below the 20-day EMA at $65,070, the 50-day EMA at $68,824, and dramatically beneath the 200-day EMA sitting up at $77,998. That EMA stack, fully inverted and spread wide, represents one of the most bearish structural pictures possible on a D1 chart.
Each moving average has become a ceiling rather than a floor. Moreover, the distance between price and the 200 EMA confirms this is not a short-term dip — it is a sustained downtrend that has been grinding lower for weeks. The daily RSI at 36.59 hovers in oversold-adjacent territory without actually triggering a classic oversold reading. That matters because there is still room to the downside before momentum becomes mechanically exhausted.
The MACD on the daily is negative at -2,002 on the line versus -2,372 on the signal. However, the histogram has printed a modest positive value of +370. That divergence between a deeply negative MACD line and a slightly improving histogram is the one flicker of potential on this timeframe. It hints at a slowdown in bearish momentum, not a reversal — selling pressure is losing its breath, not turning around to run the other way.
Bollinger Bands on the daily place the midline at $63,498 — currently acting as overhead resistance — with the lower band at $60,587. Price is pressing against the lower half of the channel, and a daily close below $60,587 would represent a genuine band breakdown with meaningful follow-through risk. The ATR of $1,907 tells you that $2,000 intraday swings are normal here. Consequently, positioning accordingly matters.
Daily pivot structure has the pivot point at $62,879, with R1 at $63,821 and S1 at $61,483. Price is currently sitting below the daily pivot — technically in negative territory for the session. The S1 at $61,483 is the next defined structural level before the Bollinger lower band comes into play.
The Hourly Chart: Momentum Has Collapsed
Momentum on the hourly timeframe has collapsed outright, with oversold RSI conflicting against a still-accelerating MACD. The 1H RSI has dropped to 25.26 — a genuine oversold reading, and a sharp one. Under normal circumstances, this would invite a scalp bounce conversation. However, the MACD tells a completely different story.
The histogram sits at -213, deeply negative and still diverging from the signal line. That means the hourly downmove has not even begun to exhaust itself from a momentum perspective. You have oversold RSI fighting a still-accelerating MACD — that is a conflict, and in trending markets, MACD usually wins until price structure breaks. Furthermore, the 1H EMA stack is fully compressed and inverted: EMA20 at $63,655, EMA50 at $63,944, and EMA200 at $63,995 — all clustered tightly overhead and acting as a layered ceiling.
Price at $62,436 sits roughly $1,500 below that entire resistance cloud. Any relief rally that fails to reclaim EMA20 on an hourly close should be treated as a selling opportunity, not the start of something new. Bollinger Bands on the 1H show the lower band at $62,454, and price is essentially kissing that level. A 1H close below this band would be a meaningful short-term signal.
The 15-Minute Chart: Execution Context Only
The 15-minute timeframe serves only for execution timing, showing a micro-downtrend within the larger bearish framework. RSI at 32 is not yet oversold on this timeframe, while the MACD histogram at -15 is barely negative. This suggests the recent leg down on the 15m may be losing steam. That said, the EMA stack mirrors every other timeframe — fully bearish and fully inverted.
The 15m lower Bollinger Band at $62,017 is the immediate downside magnet if sellers push through the current pivot cluster. For anyone already positioned short, bounce attempts toward $62,880–$63,000 could serve as entries to add or manage stops. For those considering a long counter-trend scalp off the 1H oversold reading, this is where you would look for the actual trigger — and keep the leash very short.
The Broader Picture: DEX Activity and Market Structure
On-chain data confirms that the current decline is driven by panic selling rather than organic demand rotation. According to DefiLlama data, Uniswap V3 fees spiked nearly 195% in a single day, while 7-day and 30-day trends remain deeply negative for most major DEXs. A single-day volume surge amid declining markets typically reflects forced liquidations cycling through on-chain venues — not organic demand. It is consistent with the broader risk-off environment, not a sign that DeFi participants are re-engaging with conviction.
Bullish and Bearish Scenarios
What the Bulls Need
Bitcoin can mount a credible recovery, but it has significant structural work to do first. The initial requirement is a daily close back above the pivot point at $62,879, followed by a push through the Bollinger midline at $63,498. That second level represents the real gatekeeping zone on the daily chart. A confirmed reclaim of $63,500 on a closing basis would suggest the lower band test is complete and a mean-reversion toward $65,000–$66,000 becomes plausible.
The bullish case is invalidated if BTC loses $60,587 on a daily close. That is the lower Bollinger Band, and a decisive close below it opens up a move toward the $58,000–$59,000 range. The MACD histogram improvement on the daily gives bulls a sliver of ammunition, but it is not enough on its own to justify aggressive positioning.
Where the Bears Lead
The path of least resistance remains lower. Every EMA on every timeframe points down, and the daily regime classification is explicitly bearish. Meanwhile, the hourly MACD has not bottomed, and a Fear & Greed reading of 23 — while contrarian-friendly — has historically been accompanied by further downside before the actual bottom registers. Sentiment can remain in fear for extended periods during structural downtrends.
A sustained break below $61,483 (daily S1) and especially below $60,587 (daily lower Bollinger Band) would accelerate the bearish thesis meaningfully. The bearish scenario is invalidated only by a strong, volume-backed reclaim of $65,000. That would require breaking above the daily EMA20 and shifting the hourly EMA structure from resistance to support — not a trivial ask given current conditions.
Positioning Into Uncertainty
Taken together, the Bitcoin price today sits at a crossroads where oversold hourly conditions could trigger a relief bounce, yet the dominant trend across all timeframes remains firmly bearish. The 1H RSI being this oversold does raise the probability of a short-term bounce — but in a downtrend, those bounces get sold. The risk for bulls is chasing a dead-cat bounce into layered EMA resistance.
The risk for bears is that an oversold 1H RSI and a modestly improving daily MACD histogram produce a sharp, uncomfortable short squeeze. The ATR of nearly $1,908 on the daily means Bitcoin can move $2,000 in either direction within a single session and still behave within normal volatility parameters. This is not an environment for oversized positions or casual conviction.
The dominant force right now is distribution pressure, and until price structure gives a clear higher low on the daily — not a wick, a close — the bears hold the advantage. Watch $60,587 on the downside and $63,500 on the upside. Those two levels will define the next significant move.
FAQ
What is Bitcoin’s price today and why is it falling?
Bitcoin is trading at approximately $62,425 as of June 23, 2026. The decline reflects sustained distribution pressure across all major timeframes, with the daily EMA stack fully inverted and the Fear & Greed Index sitting at 23 (Extreme Fear). Broader risk-off behavior has drained capital from the entire crypto market, not just Bitcoin.
Is Bitcoin oversold right now?
On the hourly chart, yes — the RSI has dropped to 25.26, which is a genuine oversold reading. However, the daily RSI at 36.59 has not yet reached oversold territory, and the hourly MACD remains deeply negative and still accelerating. This conflict means a bounce is possible but not yet confirmed by momentum indicators.
What are the key support levels to watch for Bitcoin?
The most critical support is the daily lower Bollinger Band at $60,587. Before that, the daily S1 pivot at $61,483 serves as the first defined structural level. A daily close below $60,587 would likely accelerate selling toward the $58,000–$59,000 range where new support would need to form.
What would signal a Bitcoin recovery?
A credible recovery requires a daily close above the pivot point at $62,879, followed by a push through the Bollinger midline at $63,498. A confirmed reclaim of $63,500 on a closing basis would open the door to a mean-reversion move toward $65,000–$66,000, where the daily EMA20 currently sits.
Disclaimer: This article is for informational purposes only and does not constitute financial advice, an investment recommendation, or a solicitation to buy or sell any financial instrument or cryptocurrency. The analysis provided is not indicative of future results. Investing in crypto assets and financial markets carries a high risk of capital loss. Always do your own research (DYOR) and consult a qualified financial advisor before making any decision.
Article produced with the assistance of artificial intelligence and reviewed by the editorial team.