

Alibaba Stock trades at $96.14, more than 10% below its 20-day EMA and nearly 28% below its 200-day EMA. This structural deterioration reflects months of sustained selling. The daily regime is firmly bearish, and evidence across timeframes does little to challenge that reading.
Summary
Key takeaways
- Alibaba Stock (BABA) trades at $96.14, deep below all major daily moving averages
- Daily RSI at 23.77 signals deeply oversold conditions, yet no reversal catalyst has emerged
- A $600 million DOJ settlement and a Claude Code security ban compound regulatory and AI-related headwinds
- Bearish alignment across daily, hourly, and 15-minute timeframes keeps downside risk firmly in play
- A daily close above $97.66 is the minimum requirement to shift short-term sentiment
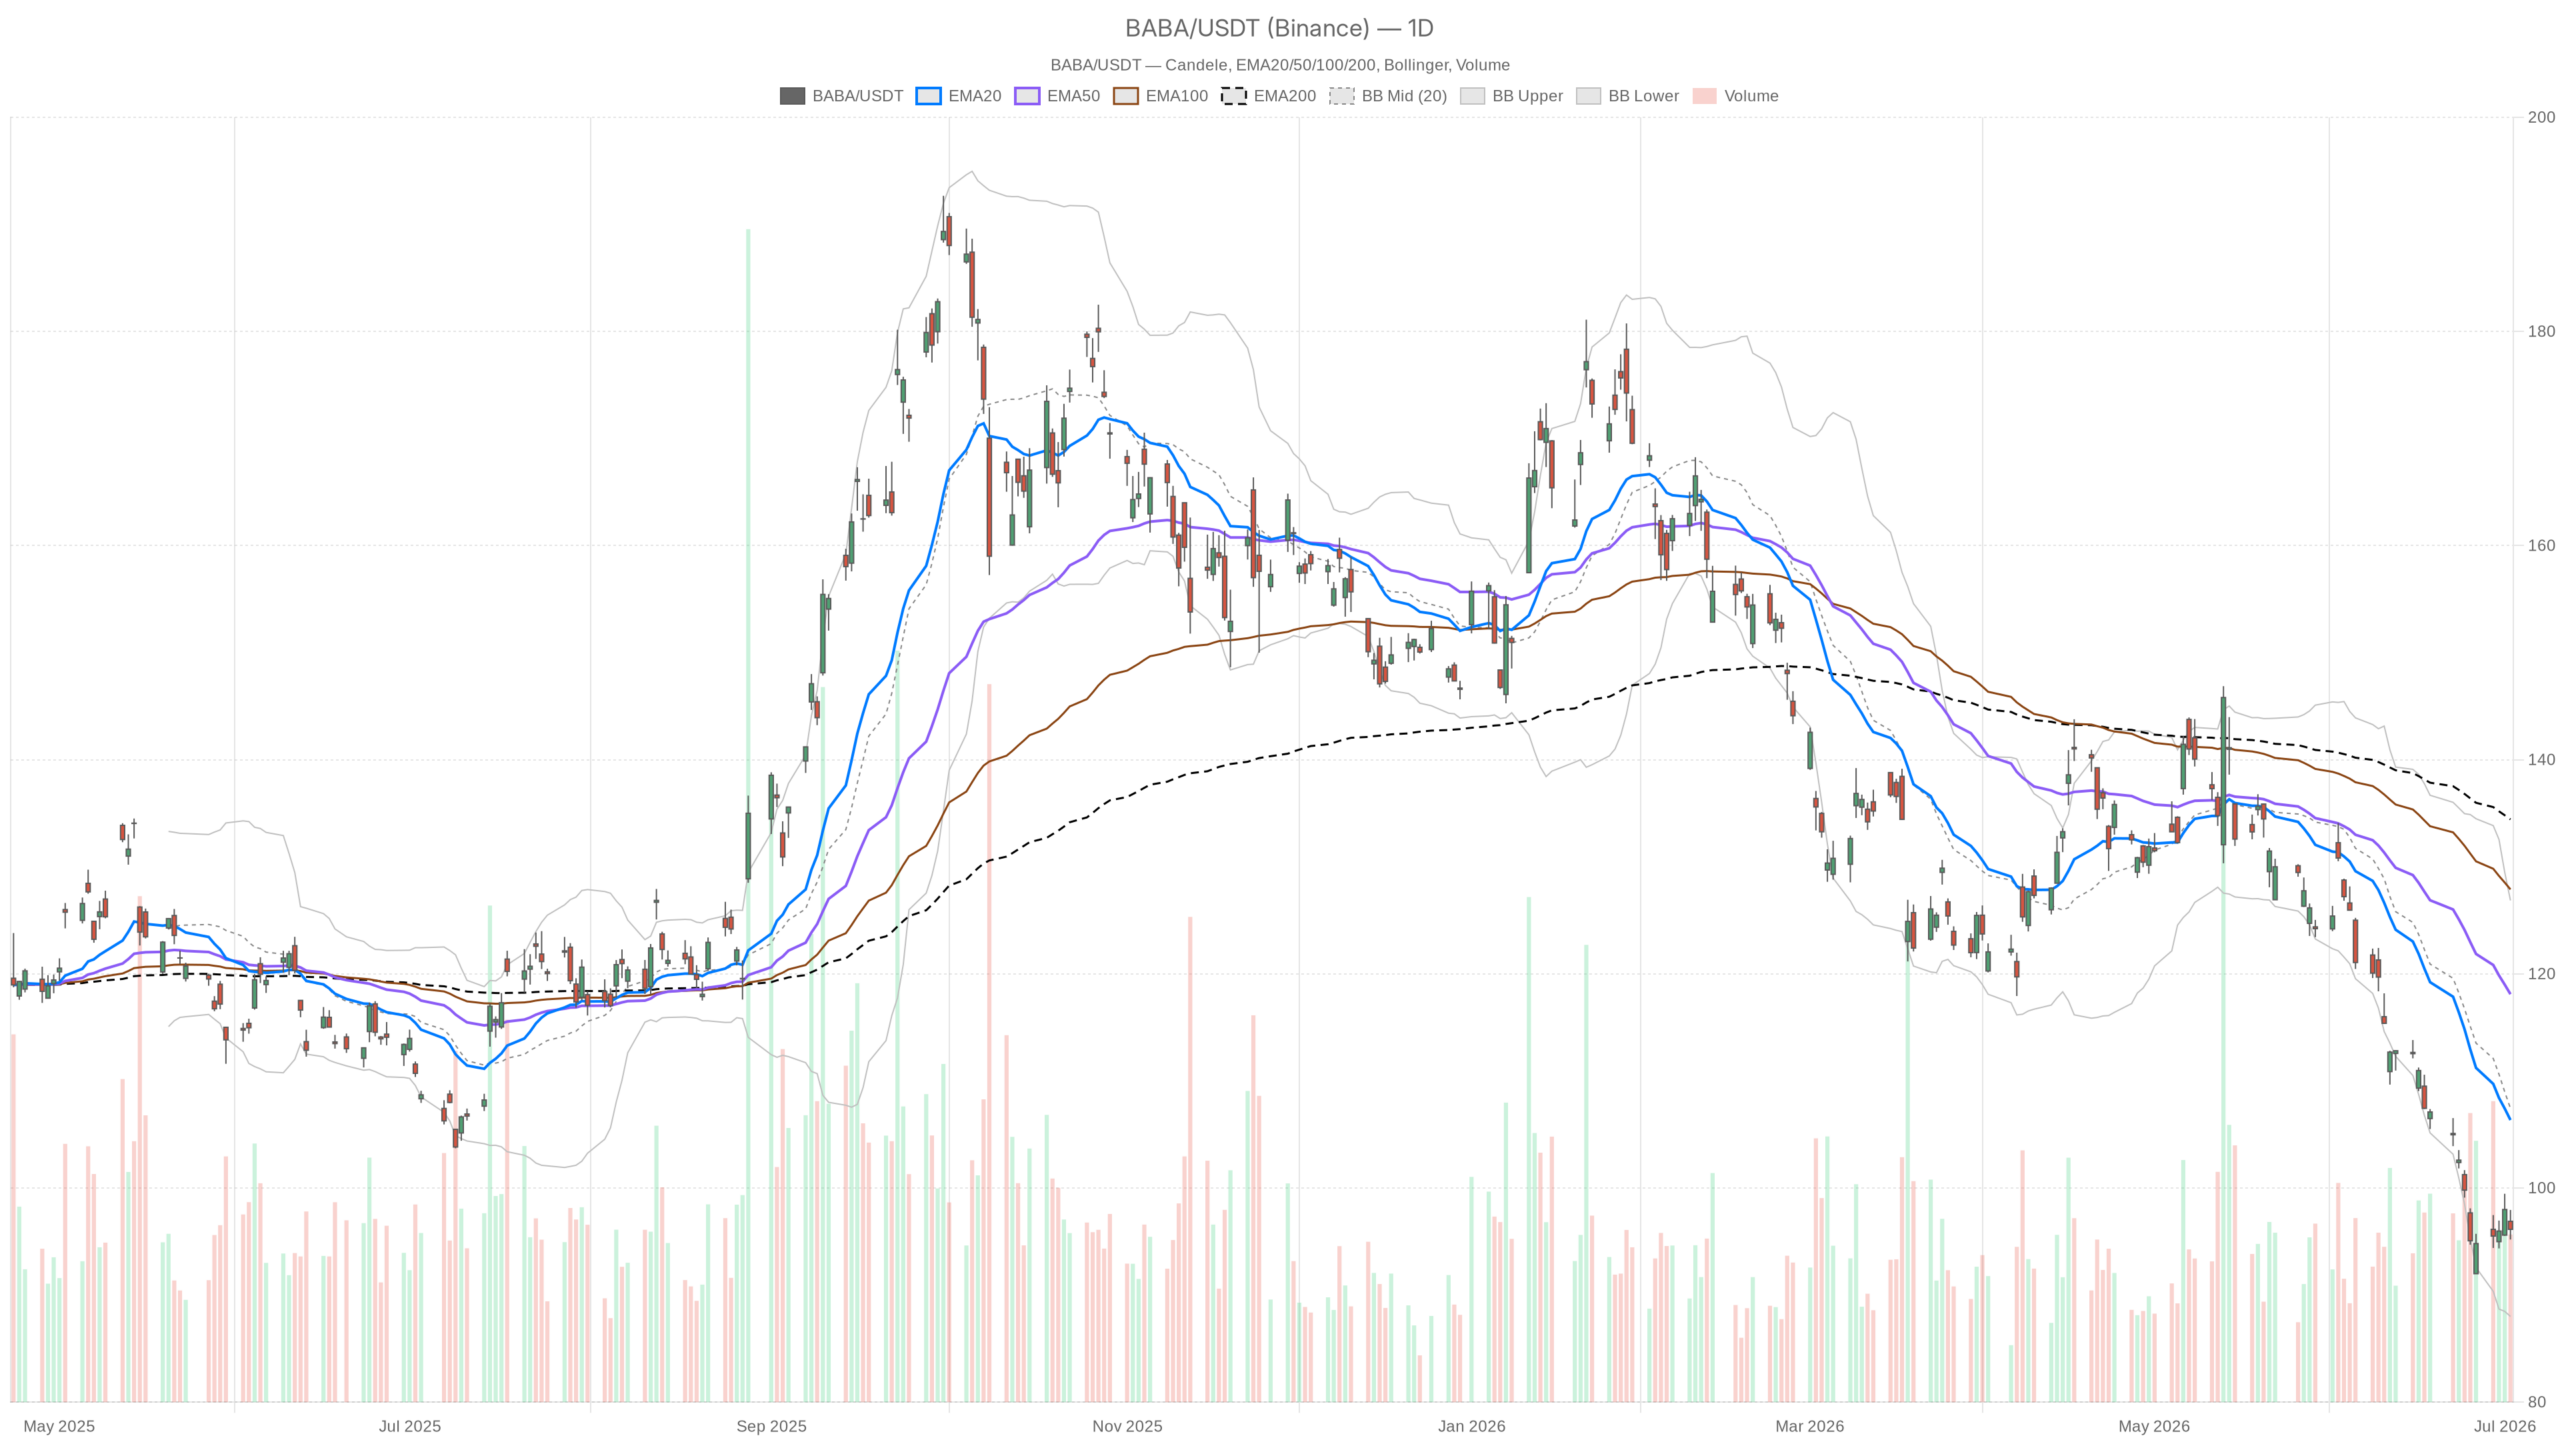
Daily Timeframe: The Structural Bear Case for Alibaba Stock
Alibaba Stock’s daily chart shows a textbook bearish structure with all key moving averages stacked in bearish order and no evidence of a base forming. The fundamental backdrop has grown more complicated in recent sessions. Alibaba agreed to the $600 million settlement with the U.S. Department of Justice. It covers illegal pharmaceutical and chemical sales on its platforms between 2016 and 2024. While the resolution technically closes a long-running dispute, a nine-figure penalty is rarely absorbed without confidence damage.
Meanwhile, reports emerged that Alibaba is set to ban Anthropic’s Claude Code internally. The ban stems from alleged backdoor security risks. This adds friction to the company’s AI positioning narrative precisely when that narrative matters most. On the more constructive side, Ant Group led a $73.6 million round in Zeroth Robotics. This signals continued AI and robotics ambitions within the broader Alibaba ecosystem. That deal, however, is unlikely to move the near-term price needle.
Moving Average Stack Confirms Distribution
BABA trades well below the EMA20 at $106.35, the EMA50 at $118.10, and the EMA200 at $134.43. All three moving averages are stacked in bearish order. This is textbook distribution. Every meaningful rally attempt has been sold into. The structure shows no evidence of a meaningful base forming.
RSI and MACD Signal Persistent Downside Momentum
The daily RSI14 stands at 23.77. That is deeply oversold territory, historically associated with exhaustion-level selling. However, oversold readings in a strong downtrend often persist longer than expected. An RSI below 30 is a condition, not a catalyst. The market needs a trigger — not just a stretched indicator — to reverse course.
Daily MACD reinforces the bearish picture. The MACD line sits at -8.31 versus a signal of -7.81, producing a histogram of -0.50. The negative histogram means momentum is still deteriorating, even if only marginally. There is no bullish crossover forming. The spread between line and signal remains wide and negative.
Bollinger Bands and Pivot Levels Map the Risk
Bollinger Bands add useful context. The midline sits at $107.43, well above current price. BABA is pressing toward the lower band at $88.00, suggesting continued compression toward support. The upper band at $126.86 is essentially irrelevant at current levels. ATR14 at $3.12 reflects moderate daily volatility. There is enough room for meaningful intraday swings. But the explosive range that typically precedes a trend reversal is absent.
Daily pivot analysis places the pivot point at $96.43, with R1 at $97.66 and S1 at $94.90. Price is trading just below the daily PP, keeping the immediate bias slightly negative. A close above $97.66 would be the minimum requirement to shift short-term sentiment for Alibaba Stock.
Hourly Timeframe Confirms Weakness With No Relief Signal
The hourly chart confirms persistent selling pressure with no emerging reversal signal. The H1 regime is also flagged as bearish. Price at $96.14 sits below the EMA20 at $96.64, the EMA50 at $98.22, and the EMA200 at $110.77. All are bearishly aligned. The distance to the H1 EMA200 is particularly striking for a one-hour chart. It underscores how far BABA has moved from any credible mean-reversion level.
The H1 RSI at 44.16 is neither oversold nor overbought. It confirms a market drifting lower without panic. This is a slow bleed rather than a capitulation event. That kind of reading is actually more dangerous for bulls. It suggests sellers are not exhausted — they are methodical.
Meanwhile, H1 MACD prints a line of -0.30 against a signal of -0.16, with a histogram of -0.14. The line is below the signal and the histogram remains negative. Momentum at this timeframe continues to deteriorate. There is no emerging bullish divergence. The H1 Bollinger midline at $96.99 sits just above current price. This creates a minor resistance zone in the $97.00–$97.66 range when combined with H1 and daily pivot resistance.
15-Minute Timeframe Offers a Pause, Not a Reversal
The 15-minute chart shows a temporary pause in selling rather than a genuine reversal attempt. The M15 regime is flagged as neutral. The RSI14 at 55.83 shows near-term momentum has nudged above the midline. The MACD histogram is slightly positive at 0.07. Price has recovered above the M15 EMA20 at $95.90 and the EMA50 at $95.86.
In isolation, these signals might suggest a short-term bounce attempt. In context, they mean very little. A neutral M15 reading against a bearish daily and bearish hourly structure is simply a pause. It is the kind of minor consolidation that often precedes continuation. Traders looking for entry timing might read this as a brief window before the next leg lower resumes.
The M15 Bollinger upper band at $96.38 aligns closely with current price action. This suggests the bounce may already be running into resistance. The ATR14 at $0.30 on this timeframe reflects compressed intraday ranges. This is consistent with a stock in wait-and-see mode heading into the July 4th holiday week.
Bullish Scenario: What Would Need to Change for Alibaba Stock
A bullish reversal in Alibaba Stock requires reclaiming $97.66 on a daily closing basis and eventually breaking above the EMA20 at $106.35. For a structural recovery to begin, that first resistance level must be cleared. Beyond it, a move above the EMA20 would be the minimum sign that the daily trend is beginning to stabilize.
Fundamentally, a bullish catalyst would need to accompany the technical repair. A resolution of the regulatory overhang could help. Positive earnings guidance or a material de-escalation in U.S.-China tech tensions would also inject confidence. The Ant Group robotics investment shows the ecosystem remains active. If the broader AI narrative gains traction, sentiment could shift quickly given how stretched selling has become.
Notably, the daily RSI at 23.77 does leave room for a sharp mean-reversion bounce. Historically, BABA has recovered aggressively from oversold extremes. Any short-covering event — particularly with volume — could push price toward $100–$107 in a relatively short timeframe.
Bearish Scenario: The Path of Least Resistance
The path of least resistance remains downward, with $88.00 standing as the next structural support target. The $600 million DOJ settlement may be closed. But it confirms ongoing regulatory scrutiny of Alibaba’s platforms. That theme has weighed on Alibaba Stock for years. The Claude Code security ban introduces new reputational complexity around AI ambitions. Neither story is constructive in the near term.
Technically, a daily close below the S1 pivot at $94.90 would open space toward the Bollinger lower band at $88.00. That level represents the next meaningful structural support. With MACD momentum still deteriorating and price below all key EMAs, the probability of testing that zone cannot be dismissed. Volume at 11.7 million shares on the last session is not extreme. It also does not reflect the kind of capitulation washout that typically marks a durable low.
Positioning and Volatility Outlook for Alibaba Stock
Alibaba Stock’s risk-reward remains skewed to the downside across all meaningful timeframes. The daily and hourly structures are unambiguously bearish. The 15-minute setup offers a momentary pause but no reversal signal. The news flow adds regulatory weight without providing a clear positive catalyst. ATR at $3.12 on the daily suggests manageable but real intraday volatility. This creates whipsaw risk for short-term traders attempting to catch a falling knife. Until BABA reclaims $97.66 and ideally $100 with conviction, any bounce should be treated as a counter-trend move in a downtrend. The risk remains tilted to the downside.
FAQ
Is Alibaba Stock oversold enough to buy now?
The daily RSI at 23.77 is deeply oversold. However, oversold readings in strong downtrends can persist for extended periods. An oversold RSI is a condition, not a buy signal. A catalyst — such as a daily close above $97.66 — is needed before a reversal becomes credible.
What is the next support level for BABA?
The next meaningful support sits at the Bollinger lower band near $88.00. Before that, the S1 pivot at $94.90 serves as an initial floor. A daily close below $94.90 would likely accelerate selling toward the $88.00 zone.
What would signal a trend reversal in Alibaba Stock?
A daily close above $97.66 would be the first step. More importantly, price would need to reclaim the EMA20 at $106.35 to show the daily trend is stabilizing. A bullish MACD crossover and RSI moving above 40 would provide additional confirmation.
Disclaimer: This article is for informational purposes only and does not constitute financial advice, an investment recommendation, or a solicitation to buy or sell any financial instrument or cryptocurrency. The analysis provided is not indicative of future results. Investing in crypto assets and financial markets carries a high risk of capital loss. Always do your own research (DYOR) and consult a qualified financial advisor before making any decision.
Article produced with the assistance of artificial intelligence and reviewed by the editorial team.