

Iren stock finds itself deeply oversold after breaking beneath key moving averages. The daily structure points firmly lower. Yet the extreme selloff raises a pressing question: is this a buying opportunity or simply another leg of a sustained downtrend?
Summary
Key takeaways
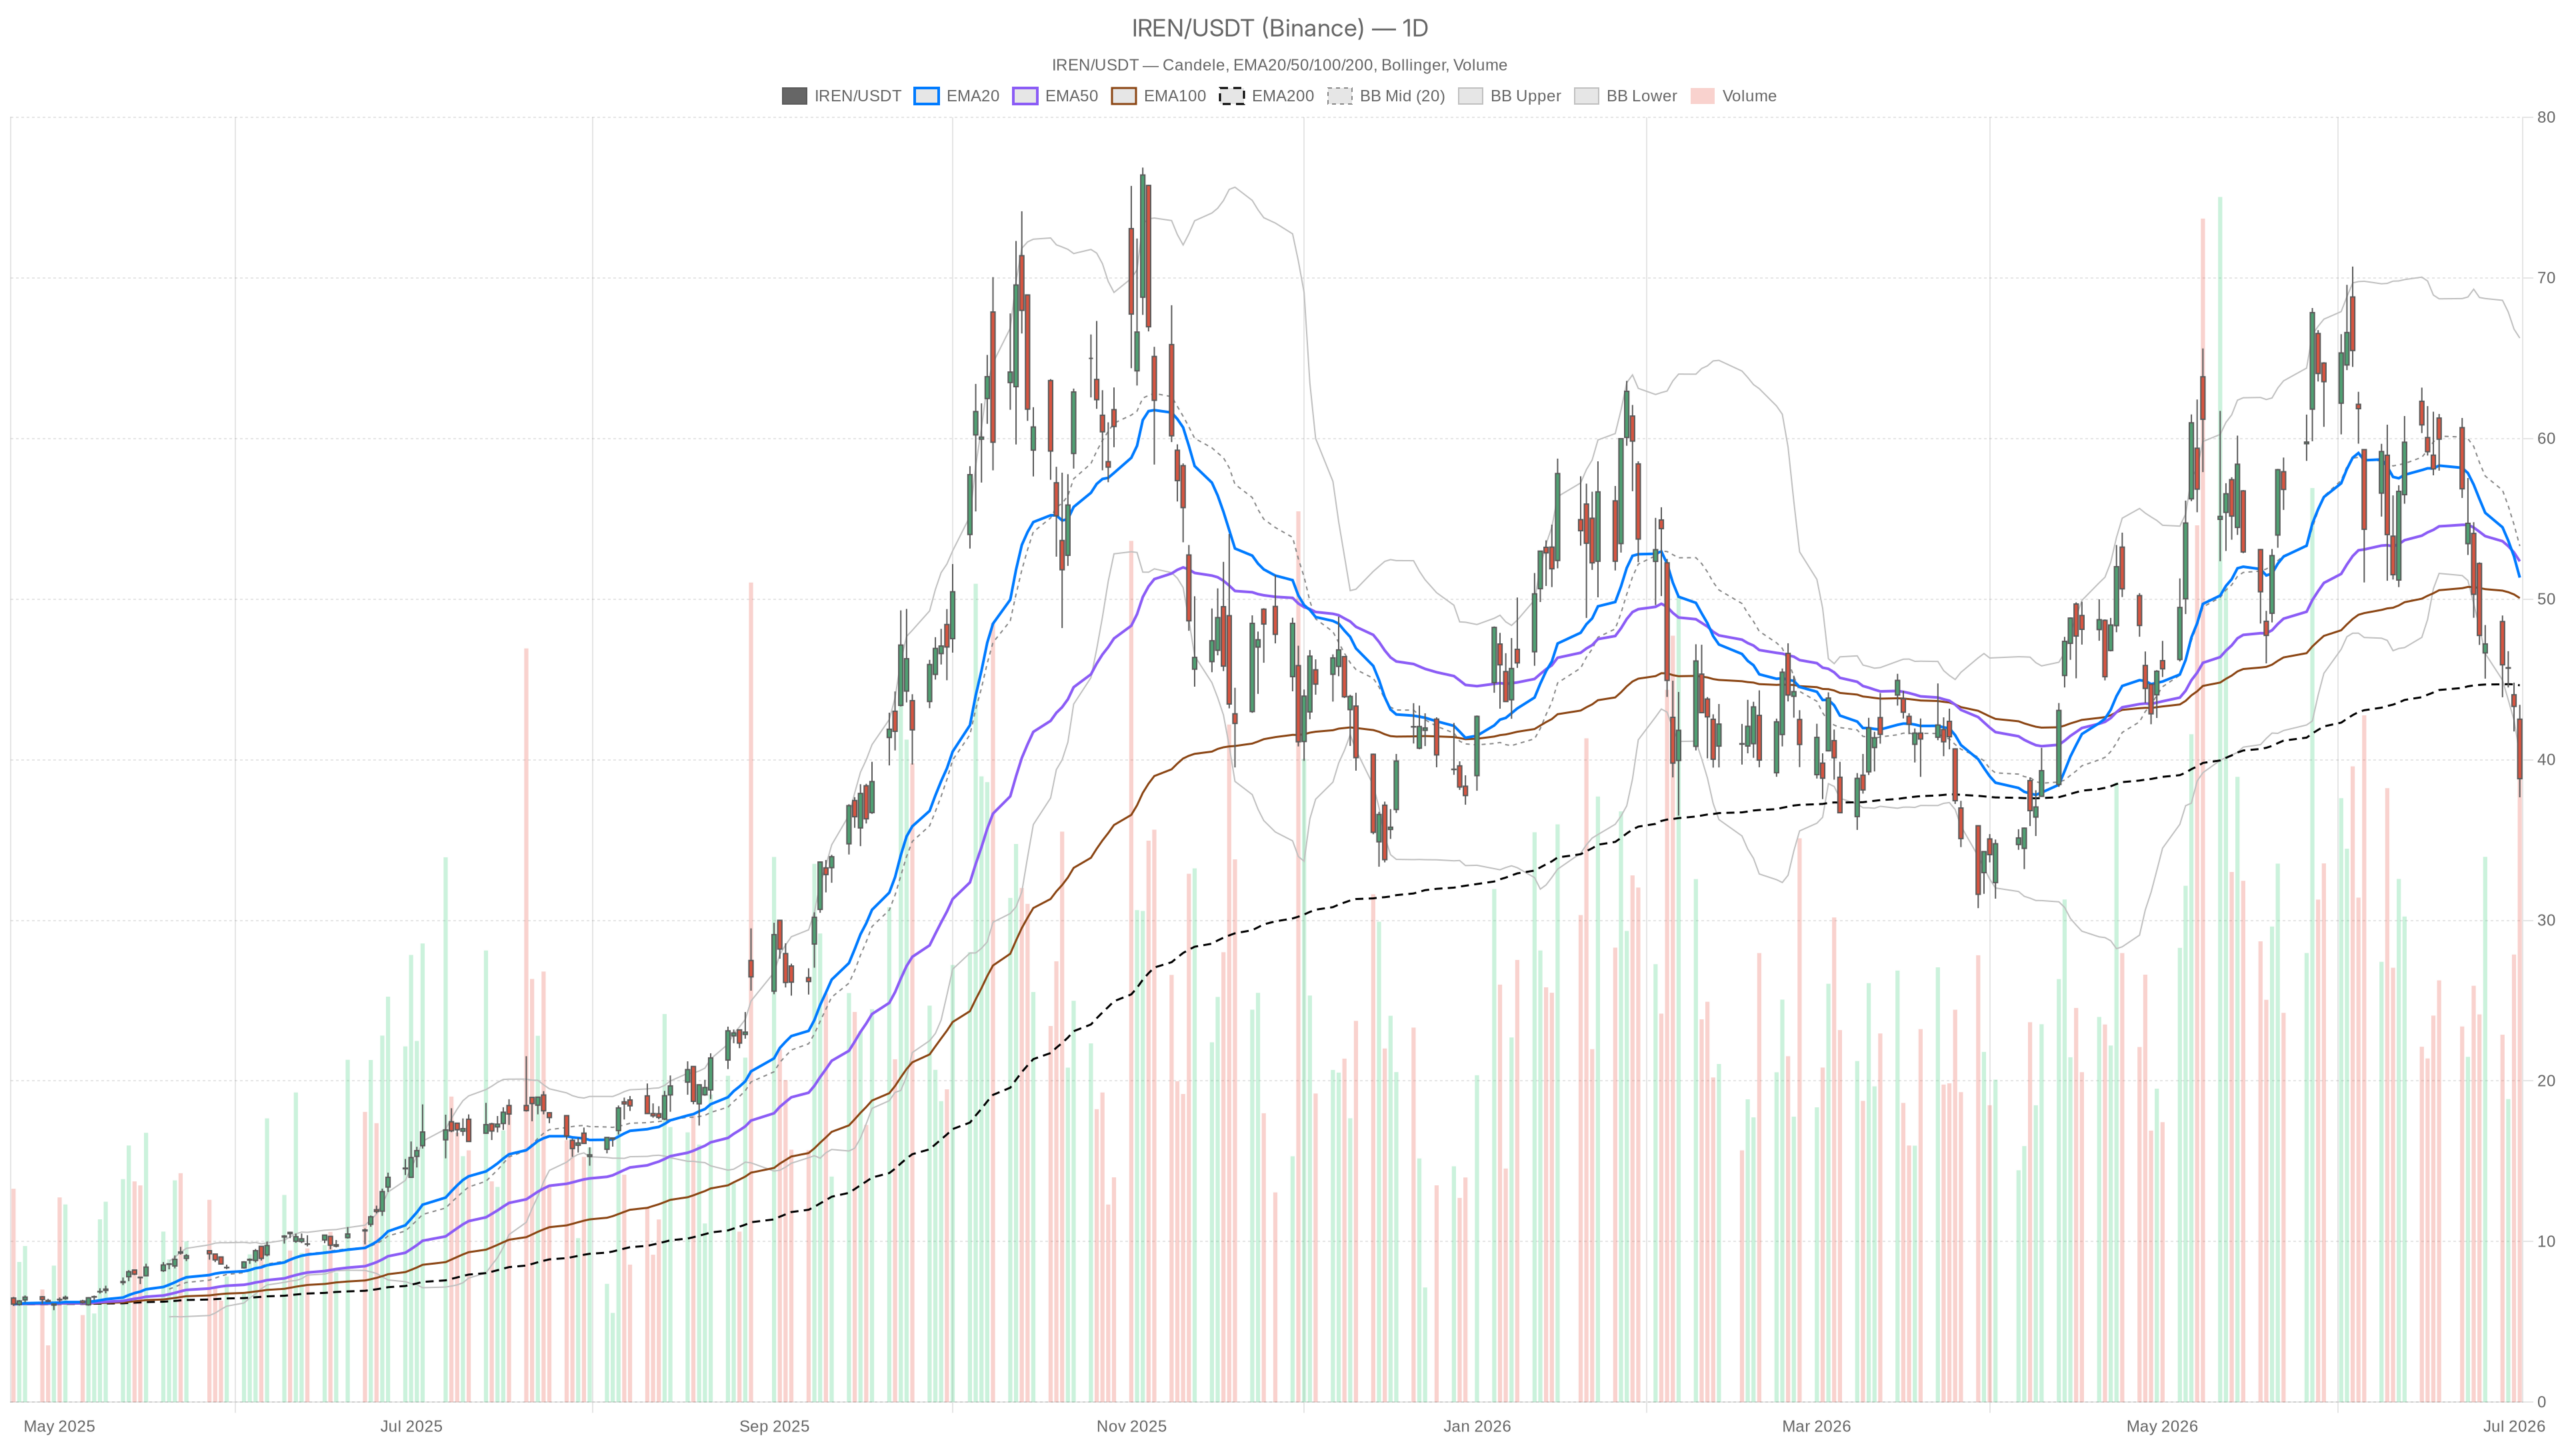
- IREN closed at $38.82 on July 2, well below its EMA20 ($51.34), EMA50 ($52.36), and EMA200 ($44.63) — confirming a sustained downtrend.
- Daily RSI at 30.58 sits at the boundary of oversold territory, signaling extreme but not yet conclusive selling exhaustion.
- Hourly RSI dropped to 25.8, indicating near-term selling pressure may be overextended on intraday timeframes.
- Bernstein maintains a Buy rating with a $100 price target, implying over 100% upside from current levels.
- An $800 million founder equity compensation plan and a $50 million jersey sponsorship are fueling dilution and capital allocation concerns.
What is the current technical trend for Iren Stock?
Iren Stock is in a confirmed daily downtrend. It trades below all three key moving averages with deeply negative momentum across timeframes.
The main bias on the daily timeframe is unambiguously bearish. IREN closed at $38.82 on July 2, well below its EMA20 at $51.34, EMA50 at $52.36, and EMA200 at $44.63. That alignment signals a stock in a confirmed downtrend. Notably, even the long-term EMA200 has failed to provide any floor. The stock trades nearly $6 beneath it, pointing to sustained distribution rather than a brief pullback.
Daily MACD reinforces the bearish narrative. The MACD line is at -3.57 versus a signal at -1.55, producing a histogram of -2.02. That is a wide, deeply negative spread. There is no divergence visible in the data. There is also no sign of histogram compression. The momentum engine is still pointing south. The daily regime registers as neutral, likely reflecting the oversold extreme. But the underlying structure reads bearish by any practical measure.
Volatility context
Daily ATR at 4.34 adds important context. IREN’s daily range on July 2 ran from $37.66 to $43.42 — a $5.76 swing. That is event-driven volatility. High ATR means both recoveries and further selloffs can develop quickly. Position sizing matters in this environment.
Is Iren Stock oversold enough to consider a reversal?
Oversold readings are flashing across multiple timeframes for Iren Stock. However, they do not yet confirm a reversal is near.
The daily RSI at 30.58 is pressing the boundary of oversold. It has not formally crossed below 30, but it is close enough to warrant attention. Oversold readings do not automatically mean a reversal is due. Meanwhile, the Bollinger Band picture shows price trading near the lower band at $40.36. The close at $38.82 is actually slightly beneath it.
Meanwhile, the market is clearly stretched to the downside on the daily chart. The Bollinger midline sits at $53.31 — a reminder of how far price has drifted from any mean-reversion target.
However, the oversold condition creates genuine ambiguity. The daily regime registers as neutral in the data precisely because of this extreme. The oversold reading complicates straightforward trend-following approaches. It raises the risk of sharp counter-trend rallies. Still, momentum remains structurally negative. Until the MACD histogram shows compression or the RSI begins climbing decisively, the oversold signal is a caution flag — not a buy signal.
What do the shorter timeframes reveal about intraday momentum?
The 15-minute chart offers a faint constructive signal for Iren Stock. But the hourly picture remains firmly bearish.
On the hourly chart, IREN trades at $38.84. The H1 EMA stack — EMA20 at $42.20, EMA50 at $46.23, EMA200 at $52.86 — shows every moving average sitting well above current price. The H1 regime is flagged explicitly as bearish. RSI has dropped to 25.8, a genuine oversold reading. This indicates near-term exhaustion in selling pressure. It does not erase the trend, but it complicates the picture for anyone looking to add short exposure at these levels.
Still, the H1 MACD line at -2.36 versus the signal at -2.07 confirms bearish momentum remains active. The histogram at -0.29 is marginal, though, suggesting momentum may be slowing slightly. This is a faint signal, not a reversal confirmation. The H1 Bollinger lower band sits at $37.15, meaning there is still room to the downside before hitting the band boundary.
At the 15-minute level, execution context offers one mildly constructive data point. The MACD histogram on the 15m has turned to +0.27. This is a small positive divergence from the bearish pressure seen at higher timeframes. RSI sits at 34.91, slightly firmer than the H1 reading.
Notably, price trades directly around the 15m pivot at $38.85, with R1 at $39.02 and S1 at $38.67. The ATR at 0.56 reflects contained near-term volatility. This granular picture suggests a brief stabilization is possible in the short run. It is far too early to call any meaningful base, however.
How do fundamental catalysts factor into the Iren Stock picture?
IREN’s fundamental story is genuinely compelling. But near-term corporate actions are creating significant overhang for the stock.
Analysts at Bernstein reiterated a Buy rating with a $100 price target, implying over 100% upside from current levels. The blended fair value estimate has been revised upward from $70.40 to $80.93. This is driven by optimism around IREN’s AI data center contracts with Microsoft and NVIDIA. The Nasdaq-100 and Russell index inclusion adds institutional ownership momentum. On paper, the fundamental thesis carries real conviction from sell-side desks.
In contrast, two recent corporate actions are creating near-term pressure. The board approved an $800 million founder equity compensation package. This deal carries substantial dilution risk for existing shareholders. At the same time, IREN announced a $50 million per year jersey sponsorship with the Golden State Warriors. Both moves have prompted scrutiny about capital allocation discipline. Investors are questioning whether a company whose stock has lost roughly 25% should commit to a splashy marketing deal. These concerns are likely contributing to selling pressure despite bullish analyst commentary.
What are the bullish and bearish scenarios for Iren Stock?
The bullish case requires technical stabilization and a recovery above key levels. The bearish case sees the downtrend remaining intact until proven otherwise.
Bullish scenario
If IREN can hold the $37.66 intraday low as a near-term floor, that would suggest a short-term base. Regaining the pivot at $39.97 would strengthen this signal. A more meaningful recovery would require reclaiming the EMA200 at $44.63 on the daily chart. That move would shift sentiment and begin to rebuild the technical structure. The AI data center angle is the core long-term driver. If execution on the Microsoft and NVIDIA contracts is confirmed with solid revenue figures, institutional buyers could provide sustained demand. In that scenario, the analyst targets of $80 to $100 become credible longer-term objectives.
Bearish scenario
On the other hand, the bearish case is straightforward. If $37.66 breaks decisively, the daily Bollinger lower band at $40.36 has already been violated. The daily MACD shows no sign of bottoming. Continued dilution concerns from the founder compensation deal could weigh on sentiment for weeks. The absence of any price structure recovery on the daily chart means the downtrend remains structurally intact until proven otherwise. Relief bounces within downtrends are traps as often as they are opportunities.
Overall, IREN presents a high-conviction fundamental story facing a high-conviction technical headwind. The daily trend is bearish, the hourly regime confirms it, and momentum remains deeply negative. Oversold readings create the possibility of a relief bounce. But until the stock demonstrates a credible recovery above the EMA200, technical risk remains asymmetrically to the downside. Patience and risk discipline are essential in a stock with a daily ATR over $4 and a news cycle that continues to generate volatility.
FAQ
Is Iren Stock a buy right now at oversold levels?
Iren Stock is deeply oversold, but the daily trend remains firmly bearish with all key moving averages above price. Oversold conditions can persist in strong downtrends. A credible recovery above the EMA200 at $44.63 would be needed to shift the technical outlook before considering long exposure.
What is the analyst price target for IREN?
Bernstein maintains a Buy rating with a $100 price target on IREN, implying more than 100% upside from the current price near $38.82. The blended fair value estimate has also been revised upward to $80.93, driven by AI data center contracts with Microsoft and NVIDIA.
Why is IREN stock falling despite positive analyst coverage?
Two corporate actions are creating near-term overhang: an $800 million founder equity compensation package carrying dilution risk, and a $50 million annual jersey sponsorship with the Golden State Warriors. Both moves have raised concerns about capital allocation discipline and are likely contributing to selling pressure.
Disclaimer: This article is for informational purposes only and does not constitute financial advice, an investment recommendation, or a solicitation to buy or sell any financial instrument or cryptocurrency. The analysis provided is not indicative of future results. Investing in crypto assets and financial markets carries a high risk of capital loss. Always do your own research (DYOR) and consult a qualified financial advisor before making any decision.
Article produced with the assistance of artificial intelligence and reviewed by the editorial team.