




Amazon stock enters a critical earnings event in a vulnerable position. AMZN closed at $226.65 on July 29, deep below key moving averages and pressing against daily Bollinger Band support. With Q2 results due Thursday afternoon, the stock sits at a technical crossroads.
Summary
Key takeaways
- AMZN closed at $226.65 on July 29, below the EMA20, EMA50, and EMA200 simultaneously.
- Daily RSI sits at 33.31, approaching oversold territory without a confirmed reversal signal.
- MACD shows active deterioration with a negative histogram of -1.99.
- Analysts expect AWS revenue growth of 31%–33% year-over-year for Q2.
- CEO Andy Jassy has committed $200 billion in capex through 2026, partially funded by a $25 billion bond issuance.
Daily Bias: Bearish Pressure Dominates the Amazon Stock Chart
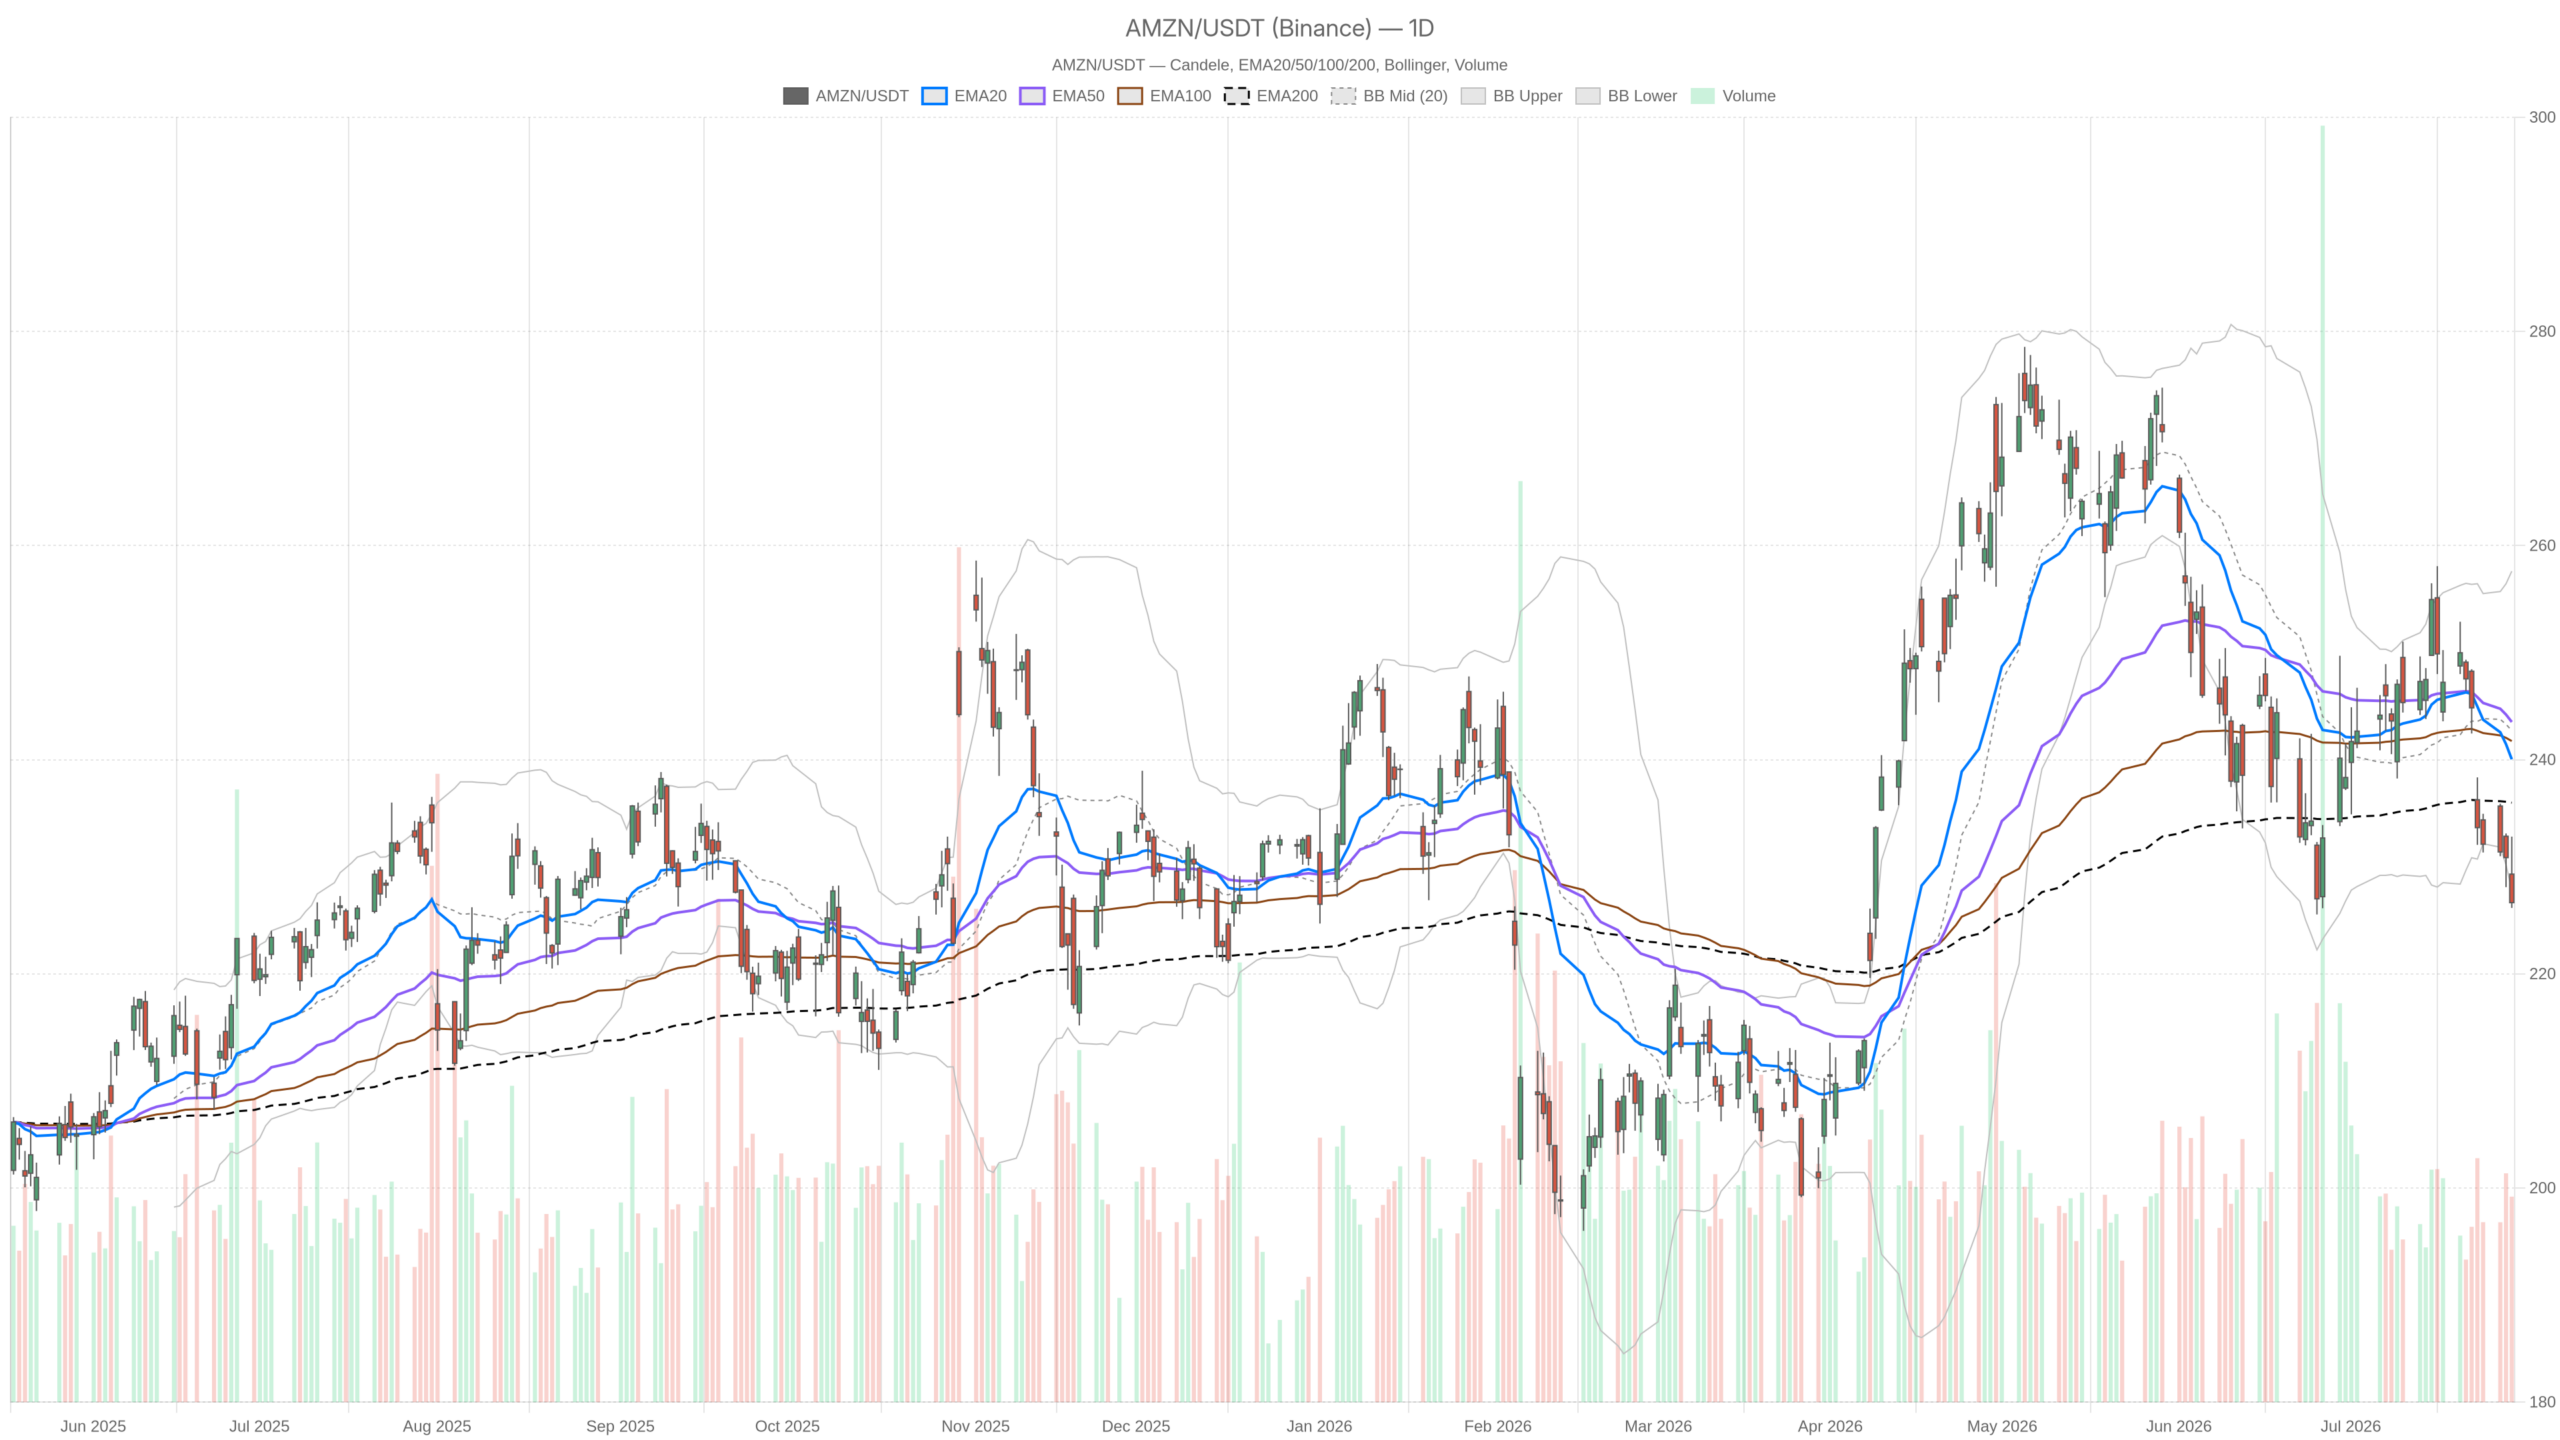
Amazon stock’s daily bias leans distinctly bearish. Price closed at $226.65, below all three major moving averages. The daily regime is classified as neutral, but the underlying indicators tell a different story. AMZN sits well under the EMA20 at $240.04 and the EMA50 at $243.53. It also trades beneath the EMA200 at $235.98. That configuration signals broad-based selling pressure across multiple trend horizons.
Meanwhile, the daily RSI at 33.31 approaches oversold territory without yet triggering a confirmed reversal signal. It reflects sustained distribution rather than a washout bounce. The MACD paints an even grimmer picture. The line sits at -3.75, well below the signal at -1.76, with a negative histogram of -1.99. Momentum is not just weak — it is actively deteriorating.
Notably, the daily Bollinger Bands place the midline at $242.72 and the lower band at $227.84. With price closing at $226.65, AMZN has breached below the lower band. This type of close can precede a mean-reversion bounce, but in isolation it is not a buy signal. It confirms extreme short-term extension and elevated downside volatility. The daily ATR of $6.48 reinforces this — swings of that magnitude make positioning costly on both sides.
The daily pivot structure adds further context. The pivot point sits at $228.54, with S1 support at $224.27 and R1 resistance at $230.93. Price closed below the pivot, keeping sellers in structural control for the session.
Hourly Timeframe Confirms Weakness in Amazon Stock, With One Nuance
The hourly timeframe confirms bearish pressure in Amazon stock. Price sits below all three hourly EMAs, mirroring the daily configuration almost perfectly. The 1H regime is explicitly bearish. Price closed at $226.71, beneath the 1H EMA20 at $230.75, the EMA50 at $235.15, and the EMA200 at $242.63.
However, the 1H MACD histogram has turned fractionally positive at +0.17. The MACD line remains at -1.90, below the signal at -2.08. This is a subtle divergence — not a reversal, but a potential early sign of downside momentum exhaustion on the intraday level. It does not change the dominant bias. It merely suggests the pace of selling may be slowing slightly on shorter cycles.
In parallel, the 1H RSI at 33.96 echoes the daily reading, sitting close to oversold. The hourly Bollinger lower band is at $227.29 with a midline at $230.55. Price has slipped just below that lower band as well. In contrast to the daily, the 1H ATR is a tighter $2.19. This reflects a more compressed intraday range within the broader volatility structure.
15-Minute View Shows No Recovery Yet
The 15-minute chart shows no recovery attempt in Amazon stock. Price remains below all intraday EMAs with the weakest RSI reading across all timeframes. The 15m MACD histogram turned negative at -0.25, reversing the brief intraday flicker seen on the 1H. The 15m RSI at 32.63 is the lowest reading across all three timeframes. There is no technical evidence of a short-term recovery as of the last available bar.
For context, the 15m pivot at $227.06 defines the immediate battle lines. R1 sits at $227.95 and S1 at $225.81. For any intraday stabilization to materialize, price would need to reclaim $227.06 and hold above it with conviction. That has not happened yet.
The Earnings Catalyst: AWS Growth and the $200 Billion Question
Amazon’s Q2 earnings report on Thursday afternoon is the decisive fundamental catalyst. AWS revenue growth of 31%–33% year-over-year is the consensus expectation. The technical weakness does not exist in a vacuum. The market is pricing in a significant move. Some analysts see potential for an upside surprise on AWS. The division remains the core profitability engine. Any beat on that metric would be the most likely trigger for a sharp reversal in Amazon stock.
At the same time, the capital expenditure narrative introduces a layer of complexity. CEO Andy Jassy has committed $200 billion in capex for 2026. He is financing part of that through a $25 billion bond issuance to fund AI data center expansion. The strategic ambition is clear. The market, however, requires patience. As one commentary notes, shareholders will need to wait several years to see a return on those AI investments. That overhang may be part of what is pressuring Amazon stock ahead of results.
Overall, AMZN is entering earnings under genuine technical stress, not just routine pre-event volatility. The stock trades below all major daily moving averages and presses against lower Bollinger Band support. RSI sits near oversold while MACD remains in active deterioration mode.
Bullish Scenario for Amazon Stock
A bullish reversal in Amazon stock requires a strong Q2 earnings beat, particularly on AWS growth. The oversold technical conditions could then fuel a sharp short-covering rally. The daily RSI at 33.31 and the sub-lower-band close create the technical conditions for such a move. Price would need to reclaim the daily pivot at $228.54, then push through R1 at $230.93 as a first meaningful hurdle. Beyond that, the EMA200 at $235.98 represents the next significant structural resistance. Reclaiming it would begin repairing the longer-term technical damage.
Bearish Scenario for Amazon Stock
A disappointing earnings report would likely accelerate the breakdown in Amazon stock. The next meaningful support sits at S1 of $224.27. On the other hand, guidance that raises concerns about the pace of capex returns would also weigh on sentiment. With price already below the daily lower Bollinger Band at $227.84, a daily close below S1 would open up further downside. Limited structural support is visible on the chart beyond that level. The MACD deterioration on the daily suggests the path of least resistance remains lower absent a fundamental surprise. In that context, the oversold RSI would not be sufficient to arrest a post-earnings selloff driven by fundamental disappointment.
Positioning and Volatility Context
Amazon stock sits in a holding pattern defined by technical fragility and fundamental uncertainty. Positioning in either direction carries meaningful event risk ahead of Thursday’s report. The daily timeframe is bearish in all but its regime label. The hourly confirms that view with only a faint hint of intraday momentum stabilization. The 15-minute chart offers no bullish execution signal. Against this backdrop, the earnings report is not just a catalyst. It is the decisive input that will determine whether the technical damage deepens or begins to repair. Volatility is elevated, the ATR reflects wide daily ranges, and positioning demands respect for both scenarios with equal discipline.
FAQ
What is the technical outlook for Amazon stock ahead of Q2 earnings?
Amazon stock enters earnings under genuine technical stress. Price closed at $226.65 on July 29, below all major daily moving averages and beneath the lower Bollinger Band. RSI at 33.31 and deteriorating MACD confirm bearish momentum across multiple timeframes.
What are the key support and resistance levels for AMZN?
Key support sits at S1 of $224.27 on the daily pivot. Below that, limited structural support exists on the chart. Resistance begins at the daily pivot of $228.54, followed by R1 at $230.93 and the EMA200 at $235.98.
What is the consensus expectation for AWS revenue growth?
Analysts expect AWS revenue growth of 31%–33% year-over-year. AWS remains Amazon’s core profitability engine, and any beat on this metric is the most likely trigger for a sharp reversal in the stock.
Disclaimer: This article is for informational purposes only and does not constitute financial advice, an investment recommendation, or a solicitation to buy or sell any financial instrument or cryptocurrency. The analysis provided is not indicative of future results. Investing in crypto assets and financial markets carries a high risk of capital loss. Always do your own research (DYOR) and consult a qualified financial advisor before making any decision.
Article produced with the assistance of artificial intelligence and reviewed by the editorial team.
