



SOFI stock sits between two competing stories. The daily chart shows a stabilizing name building short-term momentum. Still, the stock remains down more than 30% for the year despite “exceptional” earnings. This tension shapes how traders should read every timeframe.
Summary
Key takeaways
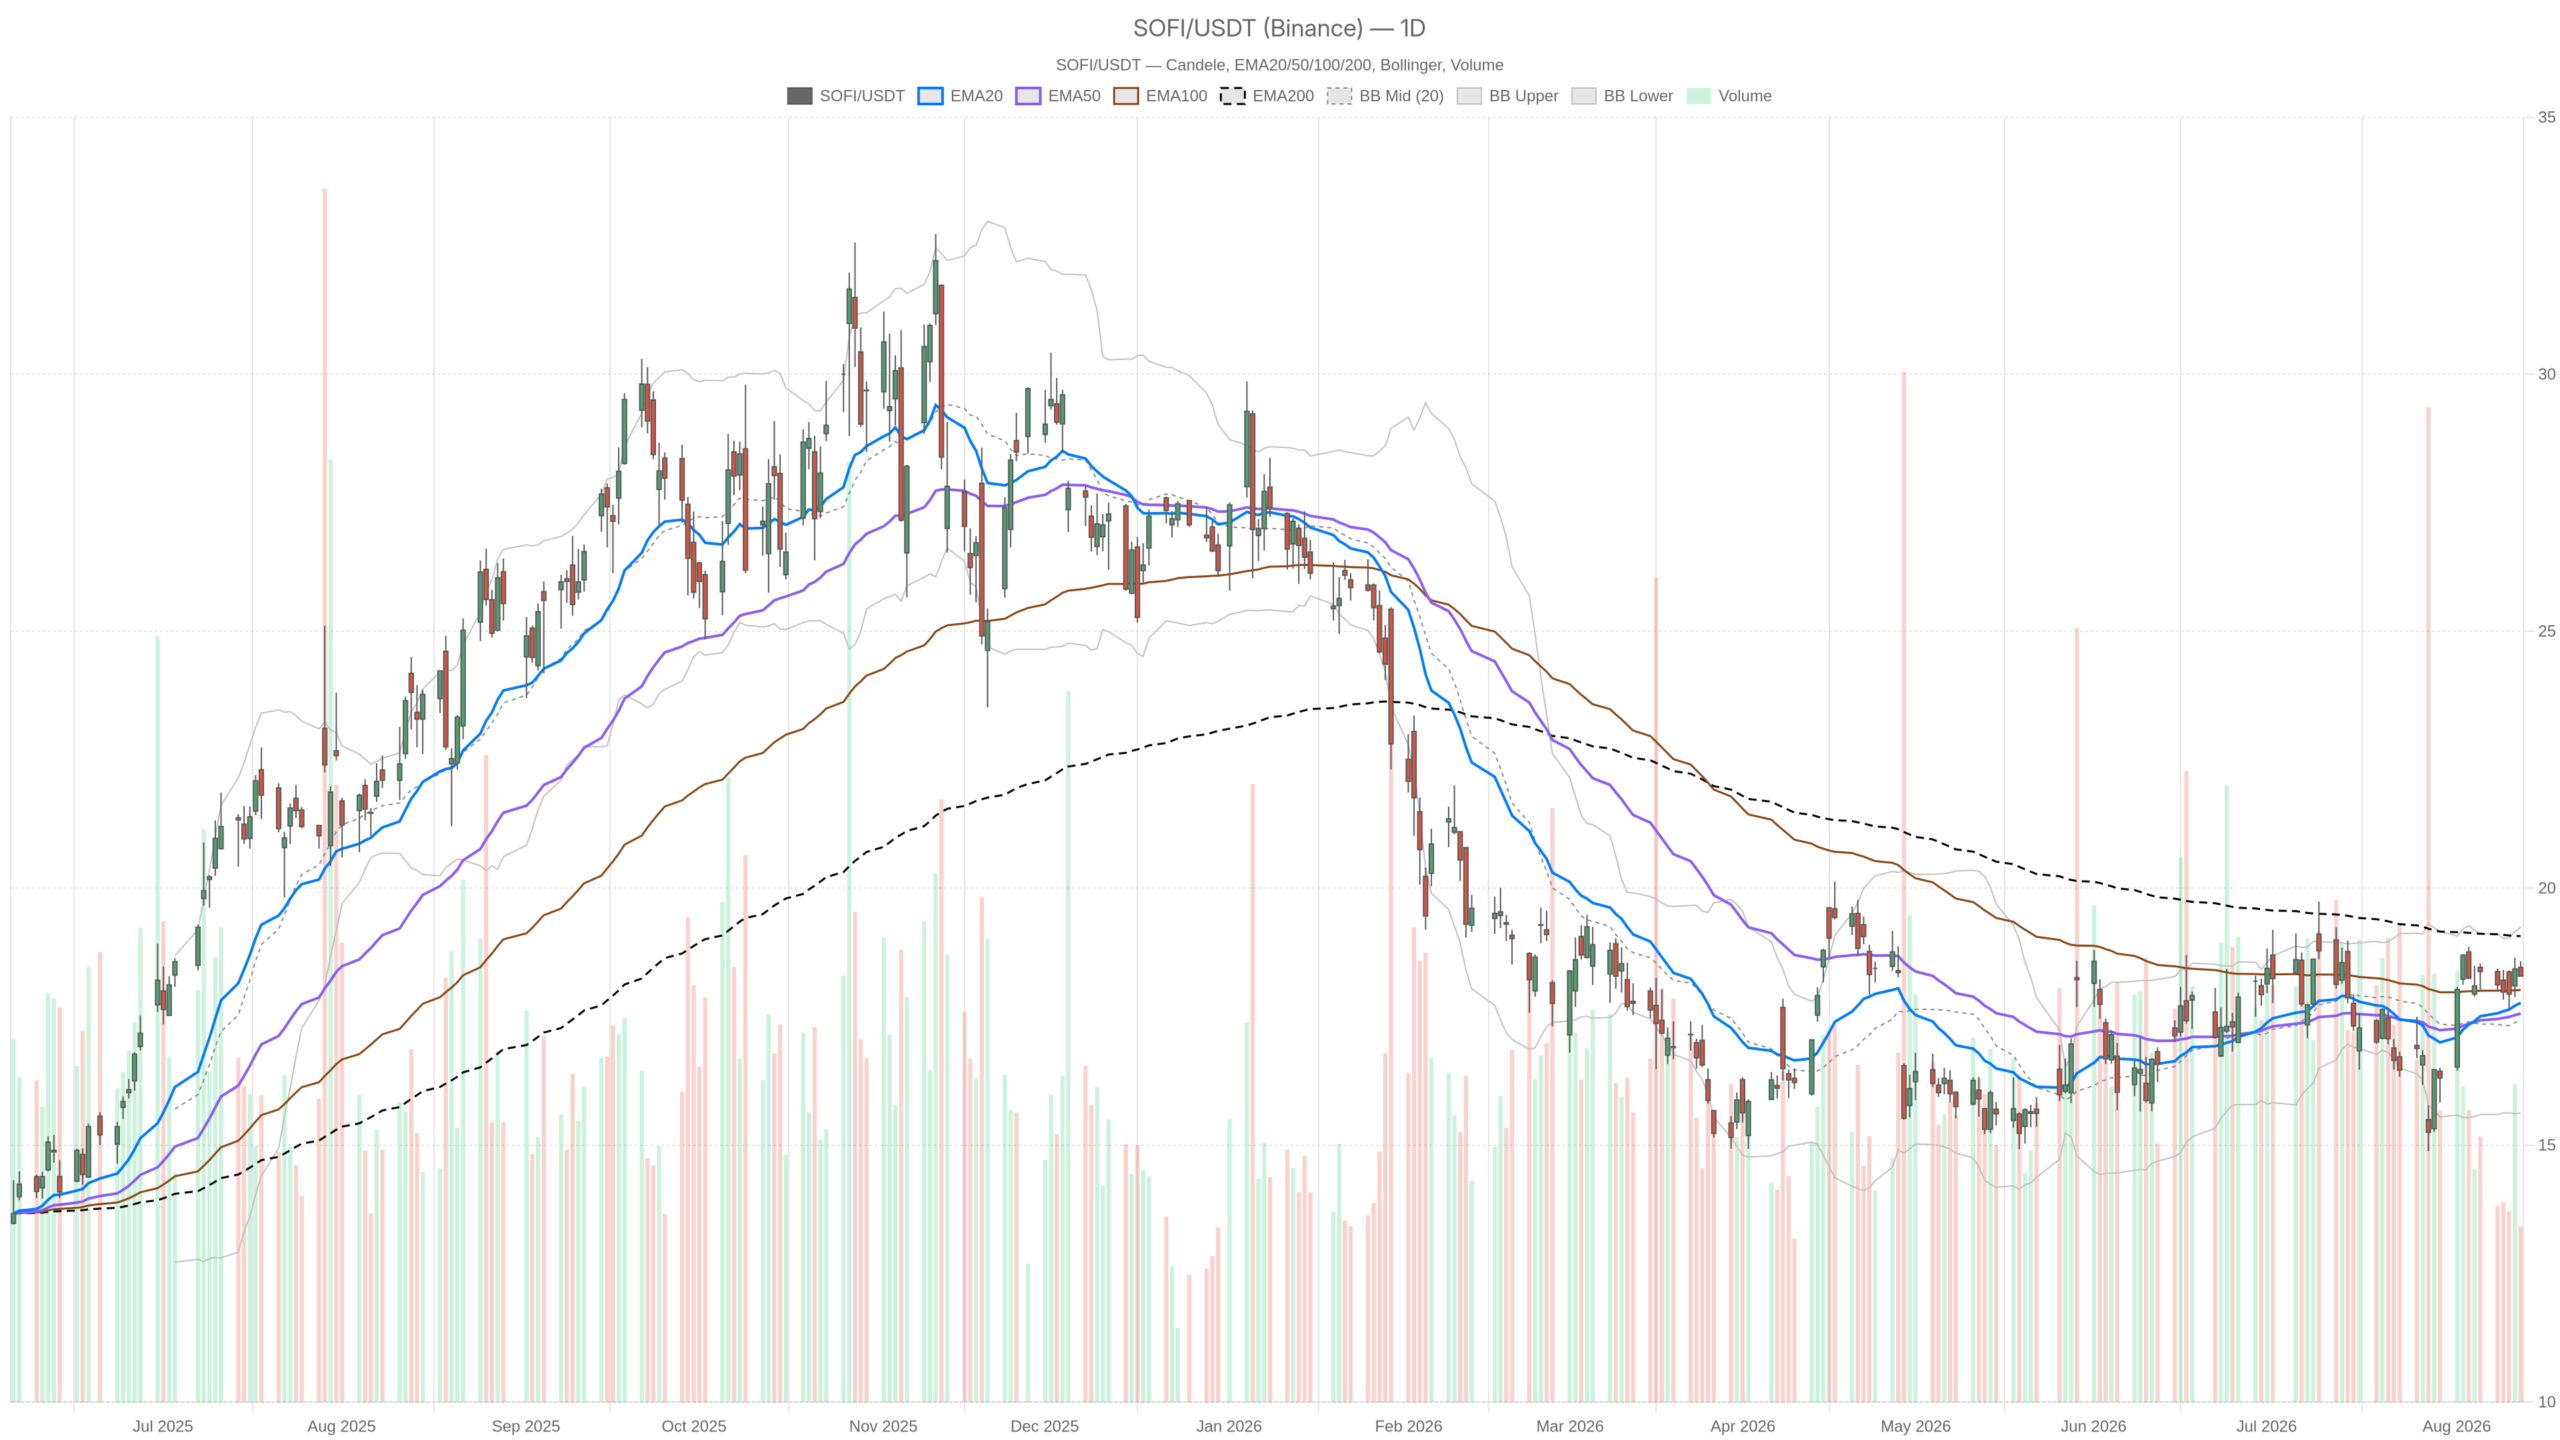
- SOFI stock closed at 18.29 on the daily chart, still below the 200-day EMA at 19.07.
- The stock is down more than 30% for the year, with a reported plunge of 31.5%.
- The daily MACD histogram is positive at 0.11, while the 1H trend is tagged bullish.
- SoFi originated a record $10.7 billion in personal loans last quarter.
- The 15-minute RSI14 has slipped to 44.12, signaling cooling short-term momentum.
Daily Trend for SOFI Stock: Recovering, But Still Under the 200-Day EMA
SOFI stock is recovering on the daily chart, but the trend stays neutral because price still trades below the 200-day EMA at 19.07.
Price Position Below the 200-Day EMA
On the daily timeframe, SOFI closed at 18.29 after trading between 18.28 and 18.58. Price sits above the EMA20 at 17.77 and the EMA50 at 17.56, pointing to short-term recovery. However, the 200-day EMA at 19.07 remains overhead. That single fact keeps the broader daily structure labeled neutral rather than firmly bullish.
Momentum Signals: RSI and MACD
The daily RSI14 reads 55.32, a level reflecting balanced momentum with a slight upside tilt. It is neither overbought nor signaling exhaustion. Meanwhile, the MACD is more constructive: the line sits at 0.24 against a signal of 0.13, producing a positive histogram of 0.11. That gap suggests bullish momentum is building, even if it has not yet reclaimed the 200-day average.
Volatility and Pivot Levels
Daily Bollinger Bands show a mid-line at 17.44, an upper band at 19.25, and a lower band at 15.62. Price near 18.29 sits in the upper half of that range, closer to resistance than to a neutral middle zone. Notably, the daily ATR14 of 0.82 points to wide daily swings, which matters for position sizing and stop placement. The daily pivot is 18.38, with resistance at 18.49 and support at 18.19. Closing just under that pivot at 18.29 shows price hovering at a decision zone.
1H Timeframe: Confirms the Short-Term Bullish Tilt
The hourly chart confirms a short-term bullish tilt for SOFI stock, with price above all three key moving averages.
On the hourly timeframe, SOFI stock trades at 18.29, above the EMA20 at 18.26, the EMA50 at 18.09, and the EMA200 at 17.69. That full alignment is a stacked bullish structure that typically supports continued short-term strength. In contrast with the daily neutral read, the 1H regime is explicitly tagged bullish.
RSI14 on the hourly chart sits at 52.44, essentially neutral and offering no strong directional signal on its own. The MACD line at 0.10 versus a signal of 0.08 produces a thin histogram of just 0.01. Momentum is positive but fading rather than accelerating. Therefore, the hourly trend confirms the daily recovery without much conviction behind it.
Hourly Bollinger Bands show a mid at 18.19, an upper at 18.68, and a lower at 17.70, with price slightly above the mid-line. That is a mild bullish tilt, not an extended one. ATR14 on this timeframe is 0.21, reflecting the tighter intraday volatility. The hourly pivot at 18.35, with R1 at 18.42 and S1 at 18.22, places current price just below the pivot in a tight decision range.
15-Minute Execution View: Momentum Is Cooling
The 15-minute chart shows short-term momentum cooling for SOFI stock, even though the higher-timeframe structure remains intact.
Zooming into the 15-minute chart, price at 18.29 trades below the EMA20 at 18.38 and the EMA50 at 18.31. Still, it remains above the EMA200 at 18.04. This is a short-term pullback within a still-intact higher-timeframe structure, not a reversal.
RSI14 has slipped to 44.12, tilting toward the bearish side of neutral. At the same time, the MACD line at 0.01 has dropped just below the signal line at 0.02, producing a negative histogram of -0.01. That small but notable shift suggests short-term momentum has stalled and even reversed slightly on this granular timeframe.
The 15-minute Bollinger Bands are notably tight, with the mid at 18.39, the upper at 18.48, and the lower at 18.30. Price is hugging the lower band, which reinforces the near-term cooling. ATR14 here is just 0.07, confirming that intraday volatility has compressed. The 15-minute pivot sits at 18.34, with R1 at 18.40 and S1 at 18.23, keeping price boxed into a narrow execution range just above support.
The Bigger Picture: Strong Fundamentals, Weak Price Action
SOFI stock faces a clear disconnect: strong operational results have not translated into sustained price gains this year.
The news flow around SOFI stock adds important context to the technical setup. Despite reporting what was called “exceptional” earnings, the stock has continued to fall, weighed down by fears of high inflation and expected rate hikes. That macro overhang helps explain why a name showing decent technical recovery still carries a yearly decline of over 30%.
On the fundamental side, SoFi originated a record $10.7 billion in personal loans last quarter. That figure underscores continued demand for its lending products. Meanwhile, the company was recently upgraded to Buy, with lending and financial services segments accelerating even as the tech platform segment lags behind.
In addition, SoFi rolled out three new private market funds for SoFi Invest members. The move expands access to opportunities in sectors like AI and fintech. It comes through partnerships with CAZ Investments and AngelList Asset Management. Notably, a competing fintech is up 2.9% this year while SOFI has plunged 31.5%, a divergence that looks counterintuitive given SoFi’s operational momentum.
Bullish and Bearish Scenarios for SOFI Stock
SOFI stock offers a defined bullish path above resistance and a bearish risk tied to fading short-term momentum.
The bullish case rests on the daily MACD’s positive histogram and the hourly chart’s fully bullish EMA stack. If SOFI pushes through the daily pivot at 18.38 and clears resistance at 18.49, the path toward the 200-day EMA at 19.07 opens up. Reclaiming that longer-term average would improve the daily structure and could attract renewed buying interest. That outcome is especially plausible given strong loan origination figures and the recent Buy upgrade.
On the other hand, the bearish risk is tied to the 15-minute weakening and the broader yearly downtrend. If price fails to hold above daily support at 18.19 and the hourly EMA20 at 18.26 gives way, the bullish tilt could unravel quickly. In that scenario, the stock would likely retest lower daily Bollinger levels, with the mid-line at 17.44 becoming a key reference. Macro fears have already overridden strong earnings once this year. A similar dynamic could easily resurface and cap any near-term rally.
Closing Thoughts
SOFI stock presents a layered picture that calls for caution rather than conviction in either direction.
A neutral daily trend, a bullish hourly tilt, and a cooling 15-minute momentum reading combine to favor caution over conviction. Volatility, as measured by the daily ATR14 of 0.82, remains elevated enough that sharp moves should not be ruled out. Overall, the disconnect between improving operational metrics and a stock price still down sharply for the year is notable. Uncertainty around SOFI stock is likely to persist until price decisively clears the daily pivot zone or breaks down through nearby support.
FAQ
Is SOFI stock bullish or bearish right now?
SOFI stock shows a mixed setup. The hourly chart is tagged bullish, the daily trend is neutral, and the 15-minute chart shows cooling momentum. That combination favors caution rather than conviction in either direction.
Why is SOFI stock down more than 30% this year?
Despite what was called “exceptional” earnings, SOFI has been pressured by fears of high inflation and expected rate hikes. The stock has plunged 31.5% this year even as operational metrics improved.
What is the key resistance level for SOFI stock?
On the daily chart, the pivot sits at 18.38, with resistance at 18.49. A move above that zone could open the path toward the 200-day EMA at 19.07.
How much did SoFi originate in personal loans last quarter?
SoFi originated a record $10.7 billion in personal loans last quarter, underscoring continued demand for its lending products.
Disclaimer: This article is for informational purposes only and does not constitute financial advice, an investment recommendation, or a solicitation to buy or sell any financial instrument or cryptocurrency. The analysis provided is not indicative of future results. Investing in crypto assets and financial markets carries a high risk of capital loss. Always do your own research (DYOR) and consult a qualified financial advisor before making any decision.
Article produced with the assistance of artificial intelligence and reviewed by the editorial team.
