




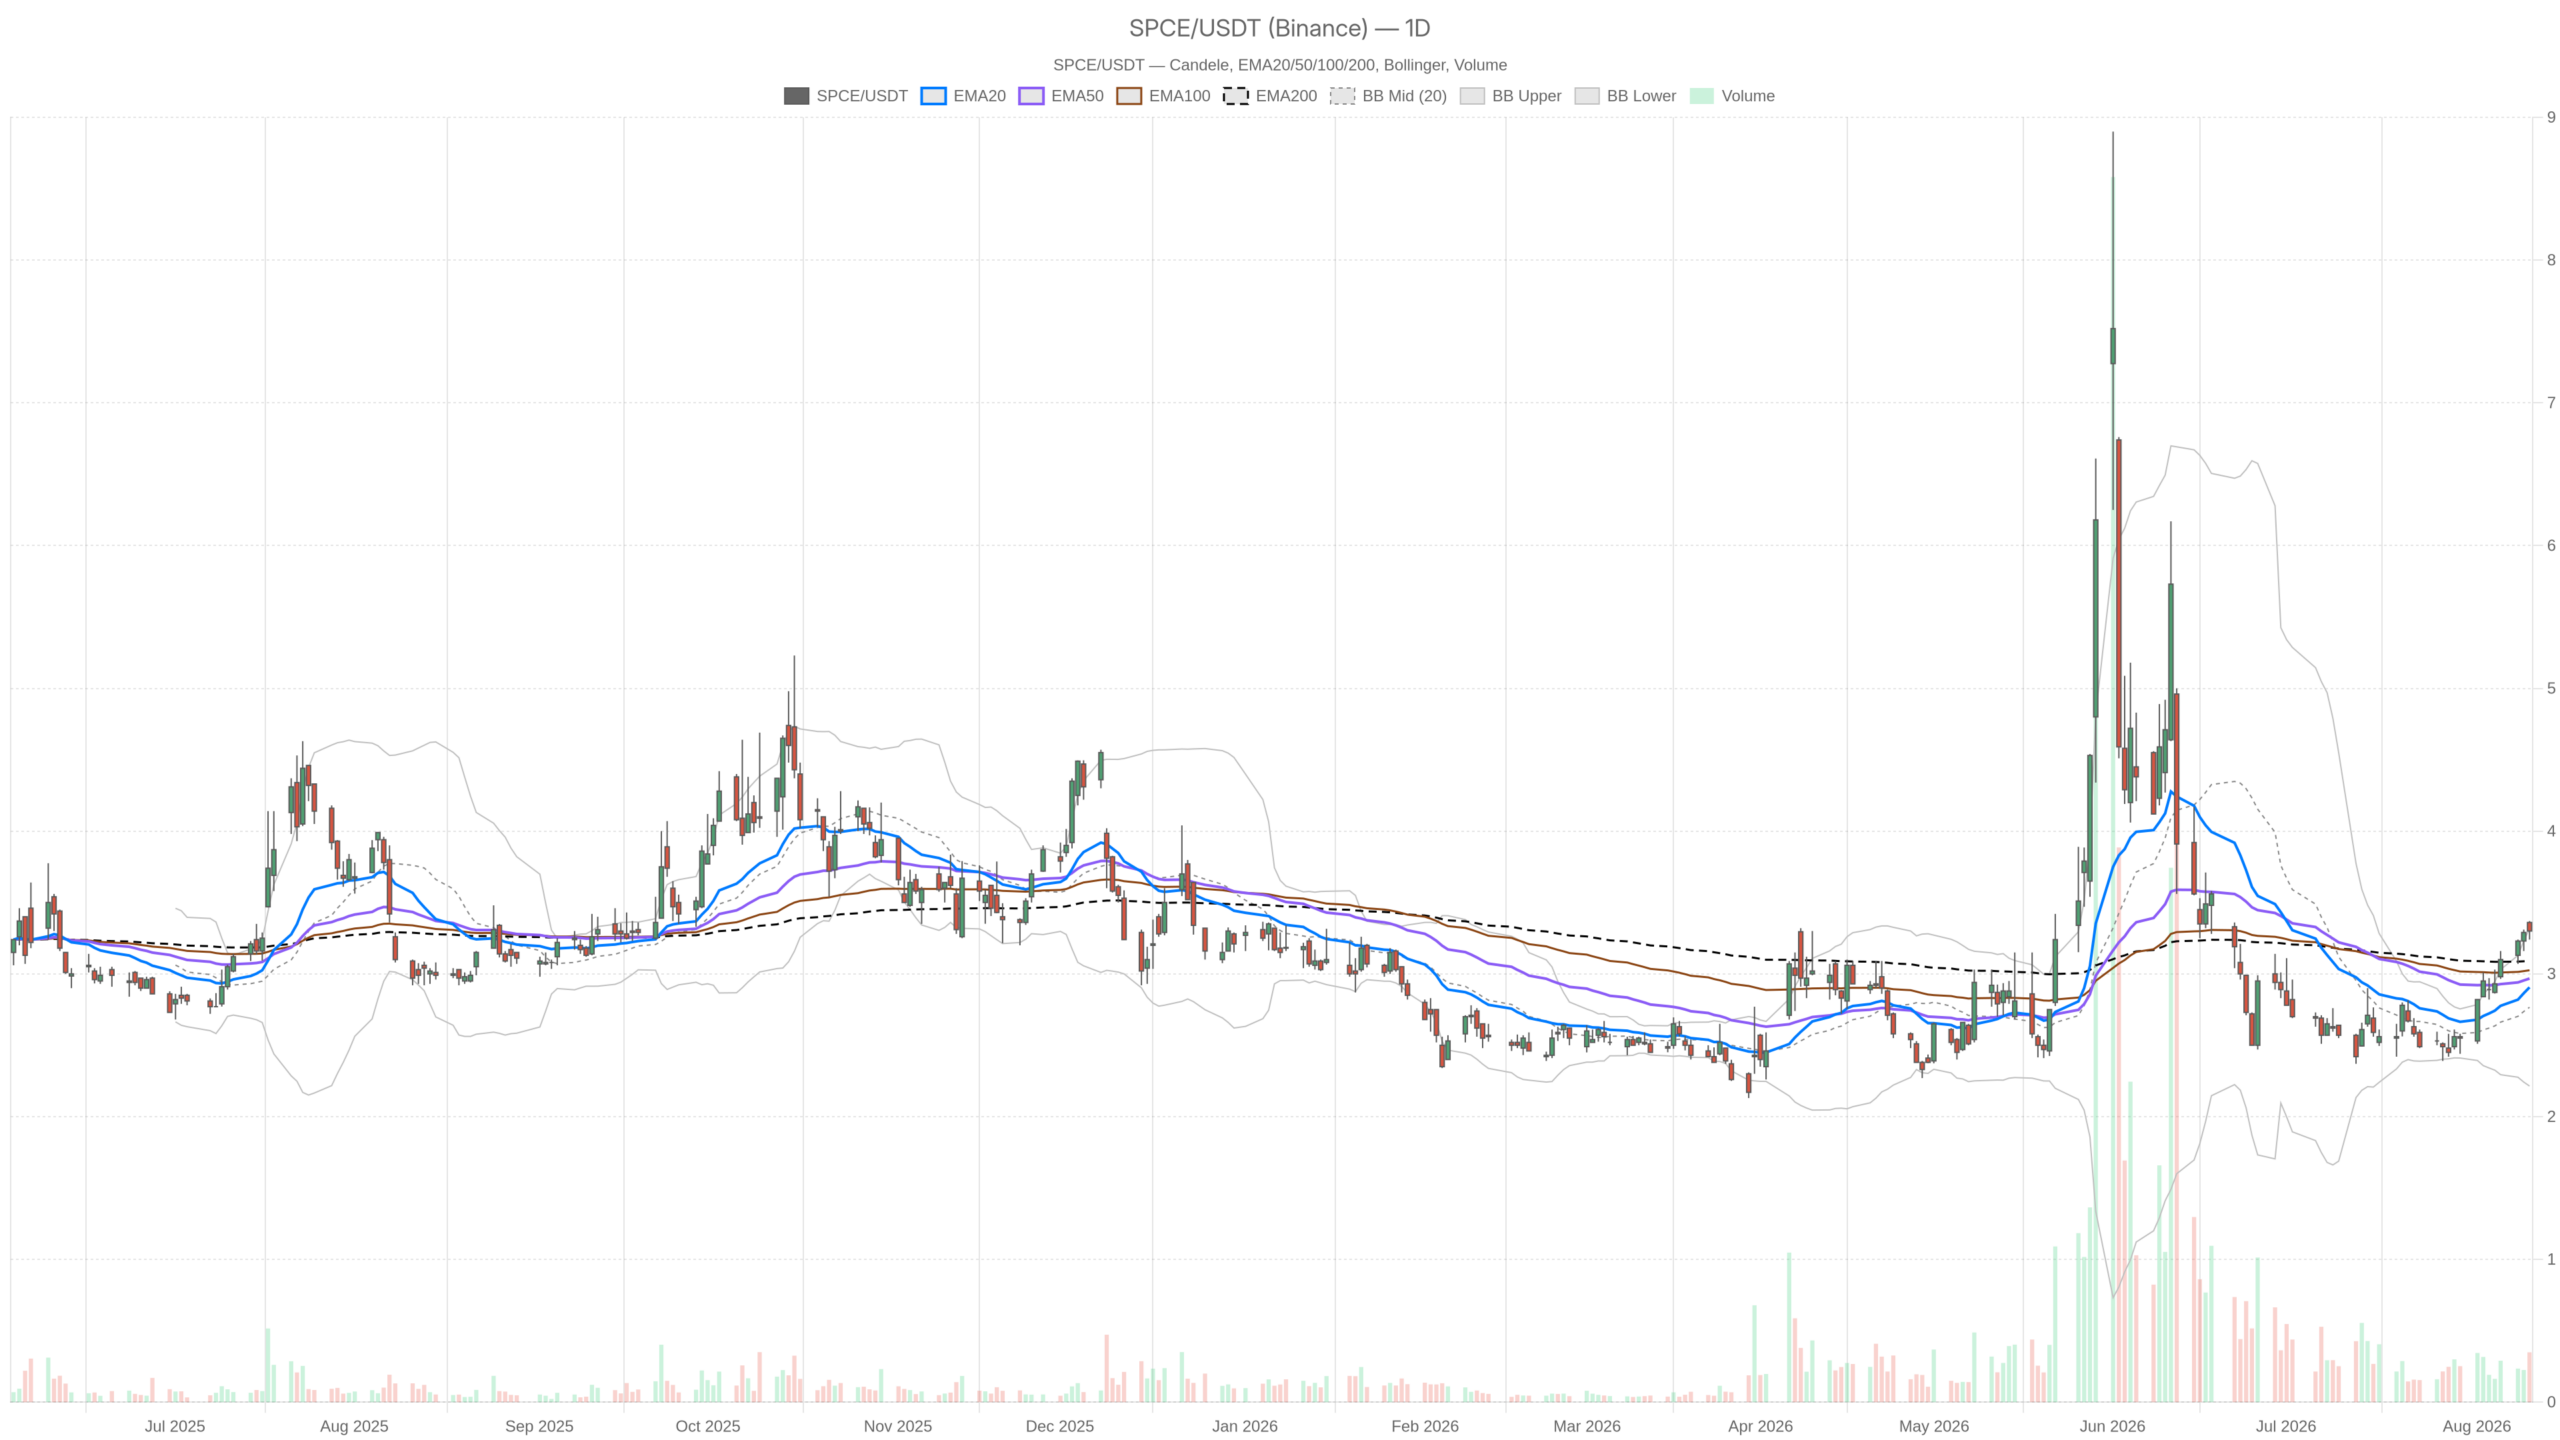
Virgin Galactic Holdings, Inc. stock has rebounded sharply from $2.95 on August 5 to close at $3.30 on August 12. The rally reignites debate around the space tourism company. Investors weigh renewed price strength against ongoing losses. The daily technical picture has shifted bullish, though internal friction warrants caution.
Summary
Key takeaways
- Virgin Galactic Holdings, Inc. stock surged from $2.95 to $3.30 between August 5 and August 12.
- The daily close now sits above the EMA200 at $3.09, suggesting a potential trend reversal.
- Daily RSI14 at 62.58 confirms bullish momentum with room to run before overbought.
- Hourly RSI14 at 68.13 warns of near-term overbought risk despite an intact uptrend.
- The critical $3.34 to $3.37 resistance zone will likely decide the next directional move.
Daily Bias: Virgin Galactic Holdings Stock Attempts a Reversal
The daily chart shows Virgin Galactic Holdings, Inc. stock attempting a meaningful trend reversal. Price has closed above all three key exponential moving averages for the first time in the current cycle.
EMA Structure and Trend Context
The August 12 daily candle closed at $3.30, just below the session high of $3.37 and above the $3.24 low. Volume reached 11.63 million shares, reflecting healthy participation. Most importantly, price now trades above all three key exponential moving averages.
The EMA20 sits at $2.91, the EMA50 at $2.97, and the EMA200 at $3.09. These EMAs remain stacked in bearish sequence, with shorter-term averages below longer-term ones. This reflects the prior downtrend. However, pushing back above the EMA200 suggests the rally is more than a minor bounce. It looks like an early reversal attempt testing whether the longer-term trend can actually flip.
Momentum Signals Confirm the Shift
Momentum on the daily timeframe supports the bullish view. RSI14 sits at 62.58, firmly in bullish territory but still with room before overbought. Meanwhile, the MACD line at 0.08 has crossed above its signal line at -0.03. This produces a positive histogram reading of 0.11. That MACD crossover is a classic sign of building upside momentum, aligning with the price action pushing through the EMA200.
Volatility and Pivot Analysis
The Bollinger Bands add further context. With the mid-band at $2.77 and the upper band at $3.32, the close of $3.30 landed almost at the upper boundary. This signals strong directional pressure. It also means the stock is stretched relative to its recent volatility envelope, measured by an ATR14 of $0.17.
Meanwhile, pivot analysis reinforces the tension. The daily pivot point sits at $3.30, exactly where price closed. Resistance sits at R1 $3.37 and support at S1 $3.24. In other words, Virgin Galactic Holdings, Inc. stock is balanced right on its own pivot. The daily high already tested the next resistance level.
1H Timeframe: Confirmation With an Early Warning Sign
The hourly chart confirms the bullish structure in Virgin Galactic Holdings, Inc. stock but introduces early momentum fatigue that traders should monitor closely.
Bullish EMA Alignment
The 1H regime is classified as bullish and the EMA structure is properly aligned in an uptrend sequence. EMA20 at $3.23 sits above EMA50 at $3.08. The EMA50, in turn, sits above EMA200 at $2.99. This is a cleaner bullish stack than what appears on the daily chart. It suggests the intraday trend has reinforced the daily reversal attempt.
Momentum Divergence Emerges
However, RSI14 on the 1H chart has climbed to 68.13, edging closer to overbought territory. At the same time, the MACD histogram has turned slightly negative at -0.01. The MACD line at 0.07 remains above the signal line at 0.08 only marginally. This creates a subtle but real divergence. Price holds near highs while momentum begins cooling.
The Bollinger Bands show price at $3.31, between the mid-band of $3.23 and the upper band of $3.37. The stock is testing the top of its short-term range rather than breaking cleanly through it.
Therefore, the 1H timeframe confirms the broader bullish structure but complicates the near-term picture. The trend is intact, yet momentum indicators hint buyers may need a pause before another leg higher becomes sustainable. The hourly pivot at $3.31 and R1 at $3.34 are the levels to watch for a decisive breakout.
15-Minute Chart: Tight Consolidation Ahead of a Decision Point
The 15-minute chart shows Virgin Galactic Holdings, Inc. stock coiling in a tight volatility squeeze just beneath resistance. It offers execution context rather than a fresh directional signal.
Orderly Structure Without Momentum
The regime remains bullish with an orderly EMA stack. EMA20 at $3.28 sits above EMA50 at $3.25. Both sit well above EMA200 at $3.05. RSI14 at 61.12 is consistent with the broader bullish tone. However, the MACD histogram has flattened to essentially zero, with both the line and signal reading 0.01.
Volatility Squeeze Under Resistance
The Bollinger Bands are notably narrow. The mid-band at $3.28 is sandwiched between an upper band of $3.32 and a lower band of $3.24. Combined with an ATR14 of just $0.03, this points to a short-term volatility squeeze. Price is coiling just beneath the 15-minute pivot resistance at R1 $3.34. This zone is likely the first real test for anyone timing an entry around current levels. The 15-minute chart confirms the stock is consolidating tightly under resistance, waiting for daily or hourly momentum to resolve the standoff.
Virgin Galactic Holdings Stock: Bullish and Bearish Scenarios
Virgin Galactic Holdings, Inc. stock faces a two-sided setup. A clear bullish path runs through $3.37, while bearish risk emerges if the EMA200 at $3.09 fails to hold.
Bullish Scenario
On the bullish side, a sustained daily close above the $3.37 resistance level would strengthen the reversal case. This level lines up with the daily R1 pivot and the upper Bollinger Band. Confirmation would come from the MACD histogram expanding on both daily and hourly charts. RSI readings should hold in bullish territory without spiking sharply into overbought extremes. A renewed push through hourly R1 at $3.34 with volume support would be an encouraging early signal.
Bearish Scenario
On the other hand, the bearish case centers on failure to hold above the pivot cluster and the EMA200. A rejection near $3.37 would suggest the rebound is losing steam. A slide toward daily S1 support at $3.24 would confirm the weakness. The hourly EMA20 near $3.23 adds another support layer to watch. If price were to lose the EMA200 at $3.09, the prior bearish EMA sequence would reassert itself, undermining the reversal narrative.
Notably, news flow has flagged a Virgin Galactic delay, referenced in coverage of Wednesday’s after-hours movers. That operational headline is a risk factor that could weigh on sentiment. This remains relevant even if the technical setup stays constructive in the near term.
Closing Thoughts
The technical structure across timeframes shows Virgin Galactic Holdings, Inc. stock attempting to exit a downtrend, but without full conviction yet.
The daily chart shows genuine reversal characteristics, with price above the EMA200 and a fresh MACD crossover. Meanwhile, the hourly chart confirms the bullish tilt but flags early momentum fatigue through RSI and MACD readings. The 15-minute chart, in contrast, is simply consolidating and waiting for a catalyst.
Given the proximity to key pivot and resistance levels, volatility is likely to remain elevated in the sessions ahead. Positioning around Virgin Galactic Holdings, Inc. stock should account for a sharp move in either direction. This is critical once the $3.34 to $3.37 zone is tested with conviction. Until that resolution occurs, the setup remains genuinely two-sided. Traders should treat the current rebound with appropriate caution rather than as a confirmed trend change.
FAQ
Is Virgin Galactic Holdings, Inc. stock in a confirmed uptrend?
Not yet. While the daily close above the EMA200 at $3.09 and the MACD crossover are encouraging, the EMA stack remains in bearish sequence. Confirmation requires a sustained move above the $3.37 resistance level.
What are the key support and resistance levels to watch?
The most immediate resistance sits at $3.34 (hourly R1) and $3.37 (daily R1 and upper Bollinger Band). Key support levels include $3.24 (daily S1), $3.23 (hourly EMA20), and $3.09 (daily EMA200).
What does the intraday overbought signal mean for traders?
The 1H RSI14 at 68.13 and the slightly negative MACD histogram suggest short-term momentum is cooling. This does not invalidate the uptrend but warns that a pullback or consolidation may occur before the next leg higher.
Disclaimer: This article is for informational purposes only and does not constitute financial advice, an investment recommendation, or a solicitation to buy or sell any financial instrument or cryptocurrency. The analysis provided is not indicative of future results. Investing in crypto assets and financial markets carries a high risk of capital loss. Always do your own research (DYOR) and consult a qualified financial advisor before making any decision.
Article produced with the assistance of artificial intelligence and reviewed by the editorial team.
