




Pan American Silver Corp. stock remains in a powerful uptrend, but Tuesday’s session shows momentum bumping against its own limits. The daily close of $52.38 holds above every major moving average. Still, the widening stretch between price and trend makes a short-term pause or pullback plausible.
Summary
Key takeaways
- Pan American Silver Corp. stock closed at $52.38, above the EMA20, EMA50, and EMA200.
- Daily RSI14 reached 70.06, a firmly overbought reading.
- The 1H MACD histogram turned negative at -0.13, showing cooling intraday momentum.
- Price closed below the daily pivot of $52.67, with support at $51.83 and resistance at $53.21.
- Q2 results are expected to show sharp sales and earnings growth on higher silver output.
Pan American Silver Corp. Stock Daily Chart: Bullish but Stretched
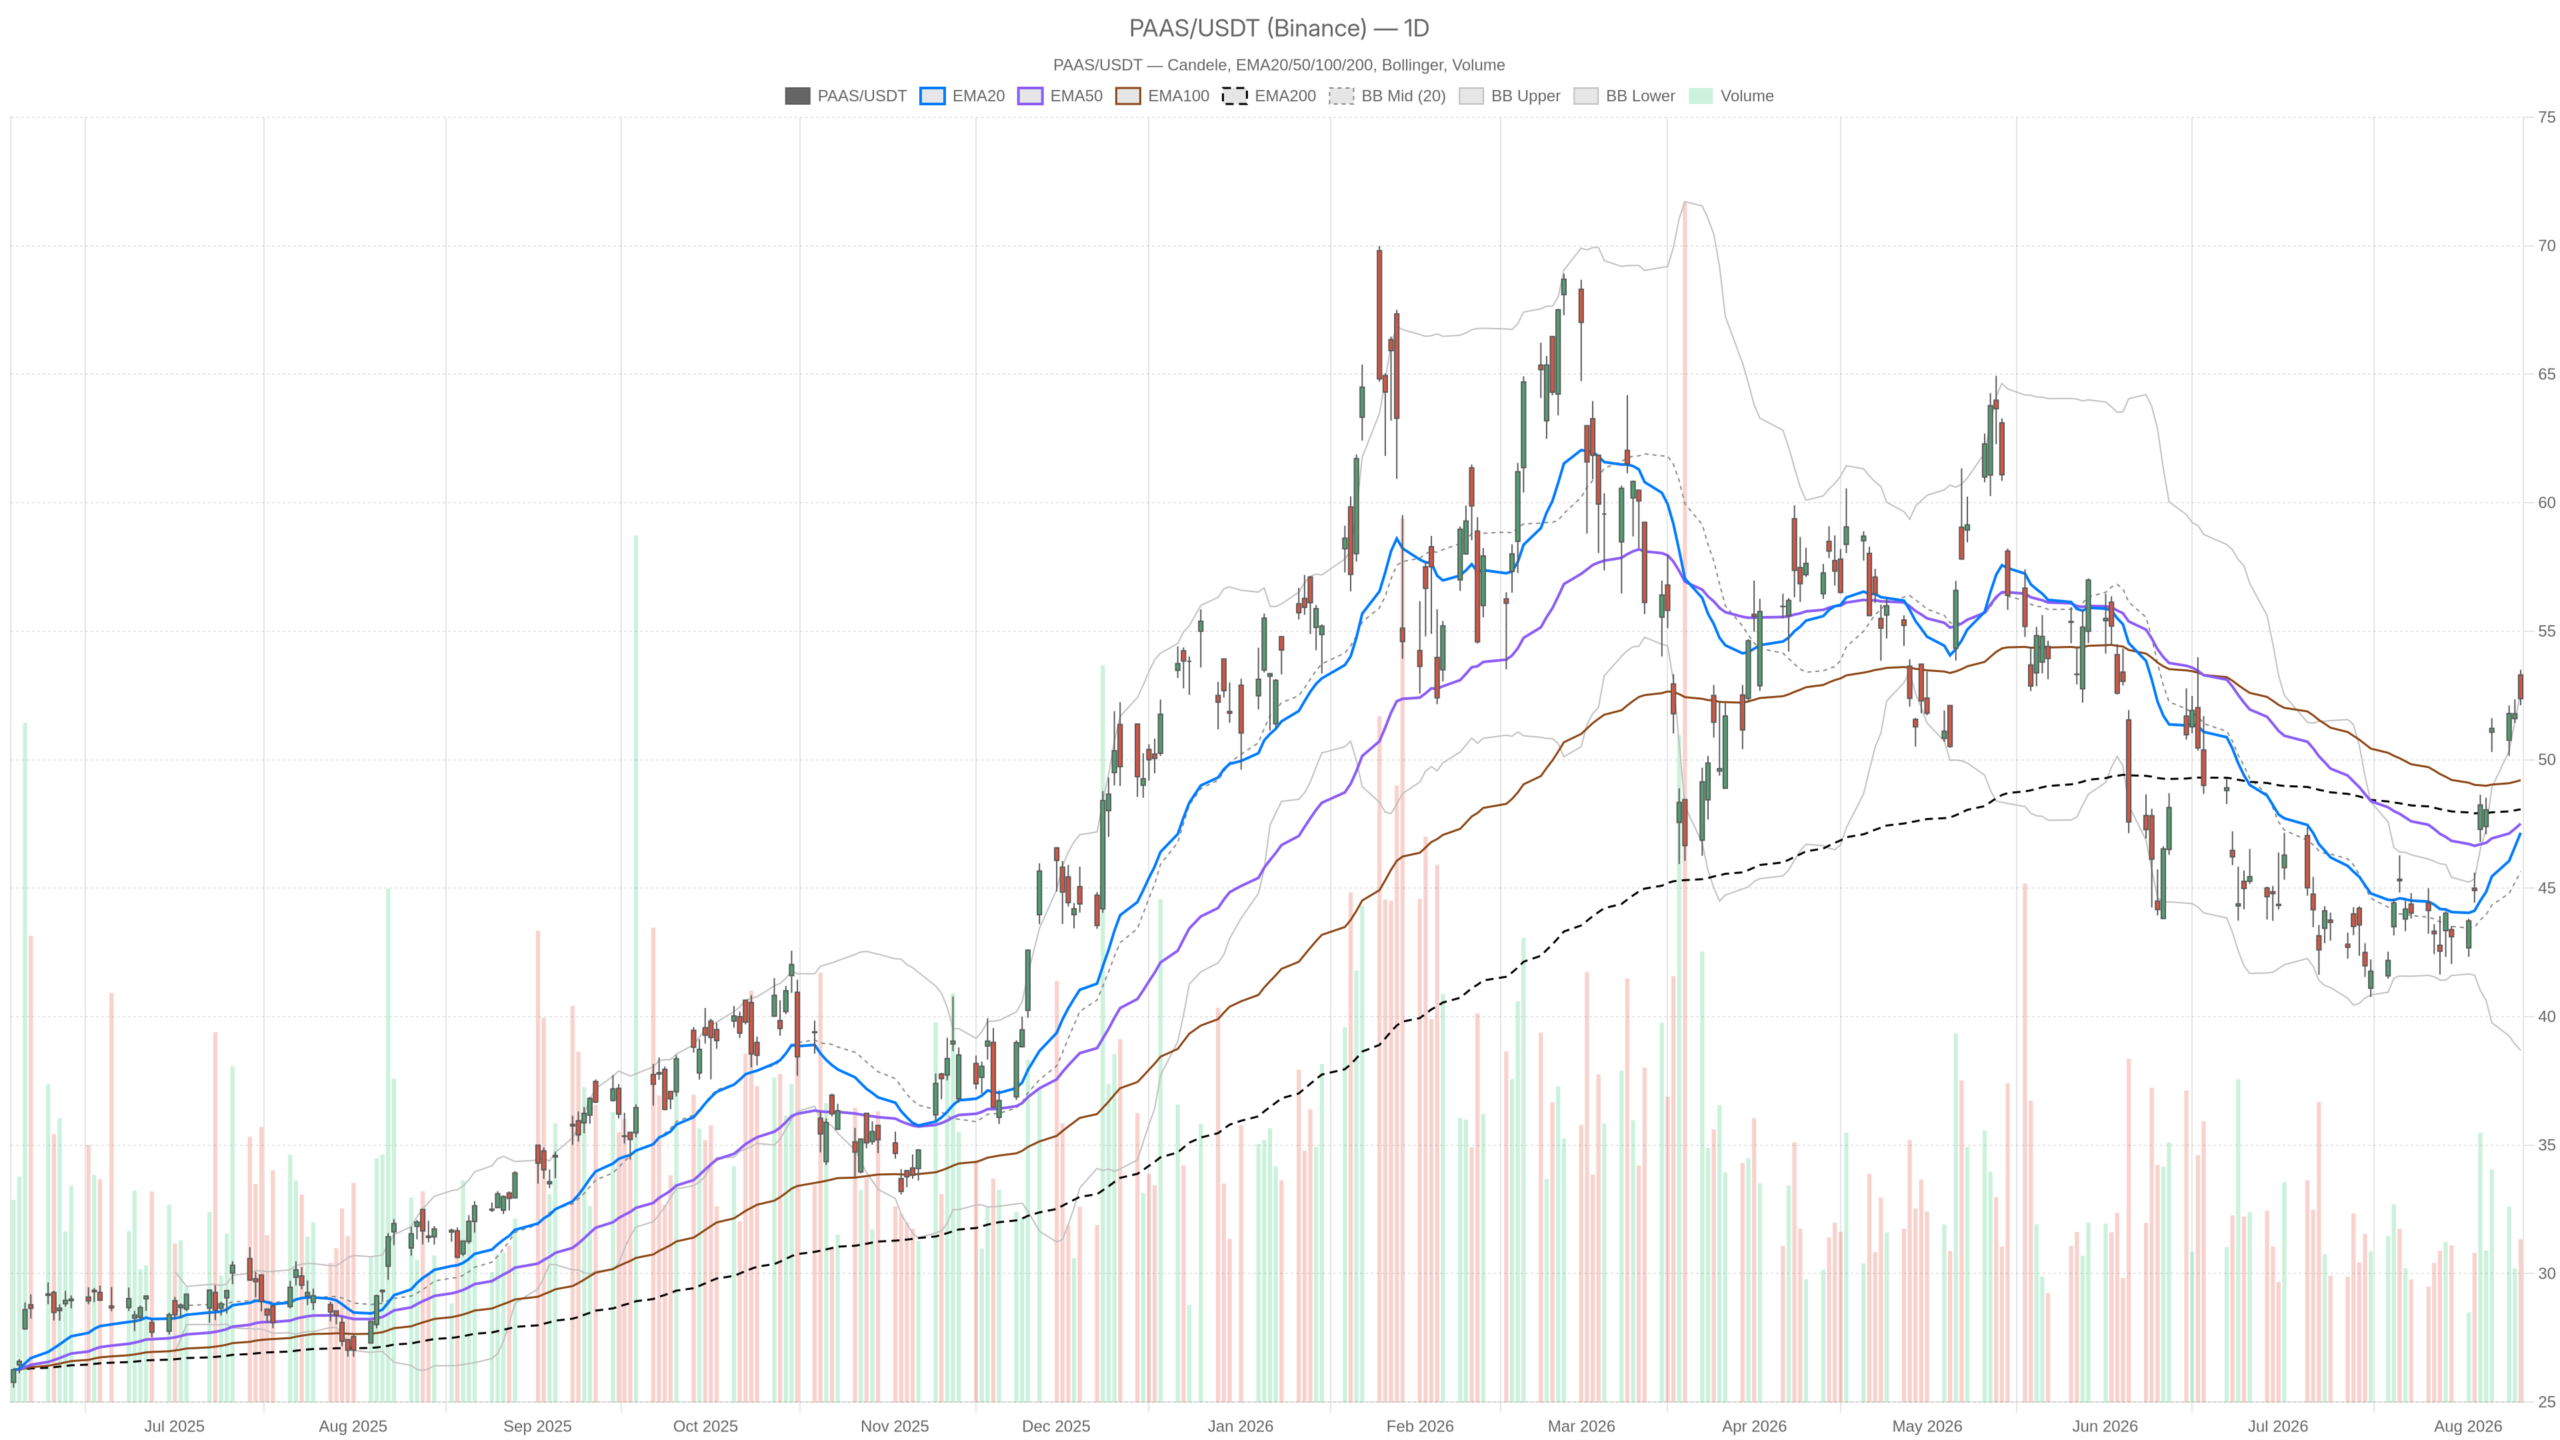
The daily chart remains bullish, but the rally has stretched far enough to invite caution. Pan American Silver Corp. stock closed at $52.38 after opening at $53.30. The session traded as high as $53.50 and as low as $52.12.
In other words, the stock closed below its own open. That detail matters given how strong the underlying trend has been. The EMA20 sits at $47.16, the EMA50 at $47.51, and the EMA200 at $48.07. Price trades well above all three, a textbook bullish alignment.
Overbought Momentum and Volatility Signals
Momentum indicators confirm the uptrend while flashing an overbought warning. RSI14 on the daily chart reads 70.06. That level sits firmly in overbought territory. Buyers remain in control, but the pace of the advance has outrun near-term equilibrium.
MACD reinforces the bullish read. The line stands at 1.51 against a signal of 0.35, producing a histogram of 1.16. That wide, positive spread confirms momentum has been strongly on the side of the bulls.
In addition, Bollinger Bands add useful context. The mid-band sits at $45.65, the upper band at $52.61, and the lower band at $38.69. Tuesday’s close presses right against the upper band. That positioning points to an extended move rather than a fresh breakout.
ATR14 stands at 1.94. Daily ranges have widened meaningfully, signaling elevated volatility around this stretch of the rally.
Pivot and Regime Classification
Notably, the daily pivot sits at $52.67, with resistance at $53.21 and support at $51.83. Price closed below the pivot on Tuesday. That is a small but real crack in an otherwise strong picture.
Interestingly, despite the bullish EMA stack and MACD reading, the system’s regime classification for the daily timeframe remains neutral. That is not a contradiction to dismiss. It reflects the tension between a strong underlying trend and a session that stalled at resistance. The close came on the lows.
Intraday Momentum for PAAS Stock Is Cooling
Intraday structure still supports the uptrend, but short-term momentum has begun to cool. The 1H chart confirms the bullish backbone of the daily trend, while smaller timeframes show a market pausing for breath.
1H Chart Structure and Pivot Levels
The 1H timeframe largely confirms the bullish read. Its EMA20 at $51.81, EMA50 at $49.85, and EMA200 at $46.37 are stacked in clean bullish order. The regime tag here is explicitly bullish.
RSI14 at 66.9 is elevated but not yet extreme. That leaves some room before intraday conditions become genuinely stretched.
However, the MACD picture on this timeframe tells a slightly different story. The line sits at 0.82 against a signal of 0.94, producing a negative histogram of -0.13. Intraday momentum has already started to cool, even while the broader trend structure remains intact.
Price is also trading just under the 1H pivot of $52.43, with resistance at $52.62 and support at $52.20. The Bollinger mid-band on this timeframe sits at $52.01, with the upper band at $52.89. Price hovers between the mid and upper band. Combined with a fading MACD histogram, this suggests the rally is consolidating rather than accelerating.
15-Minute Execution Context
The 15-minute chart has turned genuinely neutral. RSI14 sits at 48.85, essentially at the midpoint. MACD shows a marginally negative histogram of -0.04.
Price at $52.39 trades just below its EMA20 of $52.48. It sits almost exactly on the 15-minute pivot of $52.39. This is a market in short-term balance, waiting for a catalyst rather than showing directional conviction. For timing entries, this level of compression usually resolves quickly once volume returns.
Bullish Scenario for Pan American Silver Corp. Stock
The bullish case rests on reclaiming key resistance levels above the daily pivot. A reclaim of $52.67, followed by a push through $53.21 and back above the session high of $53.50, would reassert control for buyers.
Support from the news backdrop helps this case. Pan American Silver’s Q2 results are expected to show sharp sales and earnings growth. That growth is driven by higher silver output and supportive precious-metal prices.
At the same time, renewed safe-haven demand tied to macroeconomic and geopolitical uncertainty has drawn fresh investor attention to the stock. If the 1H MACD turns positive again, momentum would realign with these fundamental tailwinds. In that case, the overbought daily RSI becomes less of a warning and more of a feature of a strong trend.
Bearish Scenario and Invalidation Levels
The bearish case begins with the overbought RSI14 reading of 70 on the daily chart. Extended conditions like this do not guarantee a reversal. However, they do raise the odds of a cooling-off period.
A break below daily support at $51.83, or a slide beneath the 1H support of $52.20, would be an early warning sign. More importantly, losing the 1H EMA50 near $49.85 would put the intraday bullish regime under real pressure. That level anchors the shorter-term uptrend.
In that scenario, the daily EMA200 near $48.07 becomes a reasonable area of interest. The Bollinger mid-band at $45.65 would follow for a deeper retracement.
Bottom Line for Pan American Silver Corp. Stock
Overall, the setup in Pan American Silver Corp. stock is one of a strong trend meeting near-term exhaustion. Daily structure remains bullish by every conventional measure. Yet the overbought RSI, the fading 1H MACD histogram, and Tuesday’s close below the daily pivot all point to the same conclusion.
Momentum needs to catch its breath before the next leg becomes clear in either direction. In contrast, the 15-minute chart’s neutral posture confirms the market is genuinely undecided at this exact moment.
Given the elevated ATR readings on both daily and hourly timeframes, volatility is likely to remain a defining feature of trading here. Positioning should account for the possibility of sharp moves once this short-term balance breaks.
FAQ
Is Pan American Silver Corp. stock overbought?
The daily RSI14 reads 70.06, which is firmly inside overbought territory. This signals strong buying but also raises the odds of a short-term pause or pullback.
What are the key support levels for PAAS stock?
Daily support sits at $51.83, with 1H support at $52.20. A deeper retracement could bring the 1H EMA50 near $49.85 and the daily EMA200 near $48.07 into focus.
What would confirm the bullish scenario?
A reclaim of the daily pivot at $52.67, followed by a push through $53.21 and the session high of $53.50, would reassert control for buyers.
What fundamental factors support Pan American Silver Corp. stock?
Pan American Silver’s Q2 results are expected to show sharp sales and earnings growth, driven by higher silver output and supportive precious-metal prices. Renewed safe-haven demand has also drawn investor attention.
Disclaimer: This article is for informational purposes only and does not constitute financial advice, an investment recommendation, or a solicitation to buy or sell any financial instrument or cryptocurrency. The analysis provided is not indicative of future results. Investing in crypto assets and financial markets carries a high risk of capital loss. Always do your own research (DYOR) and consult a qualified financial advisor before making any decision.
Article produced with the assistance of artificial intelligence and reviewed by the editorial team.
