



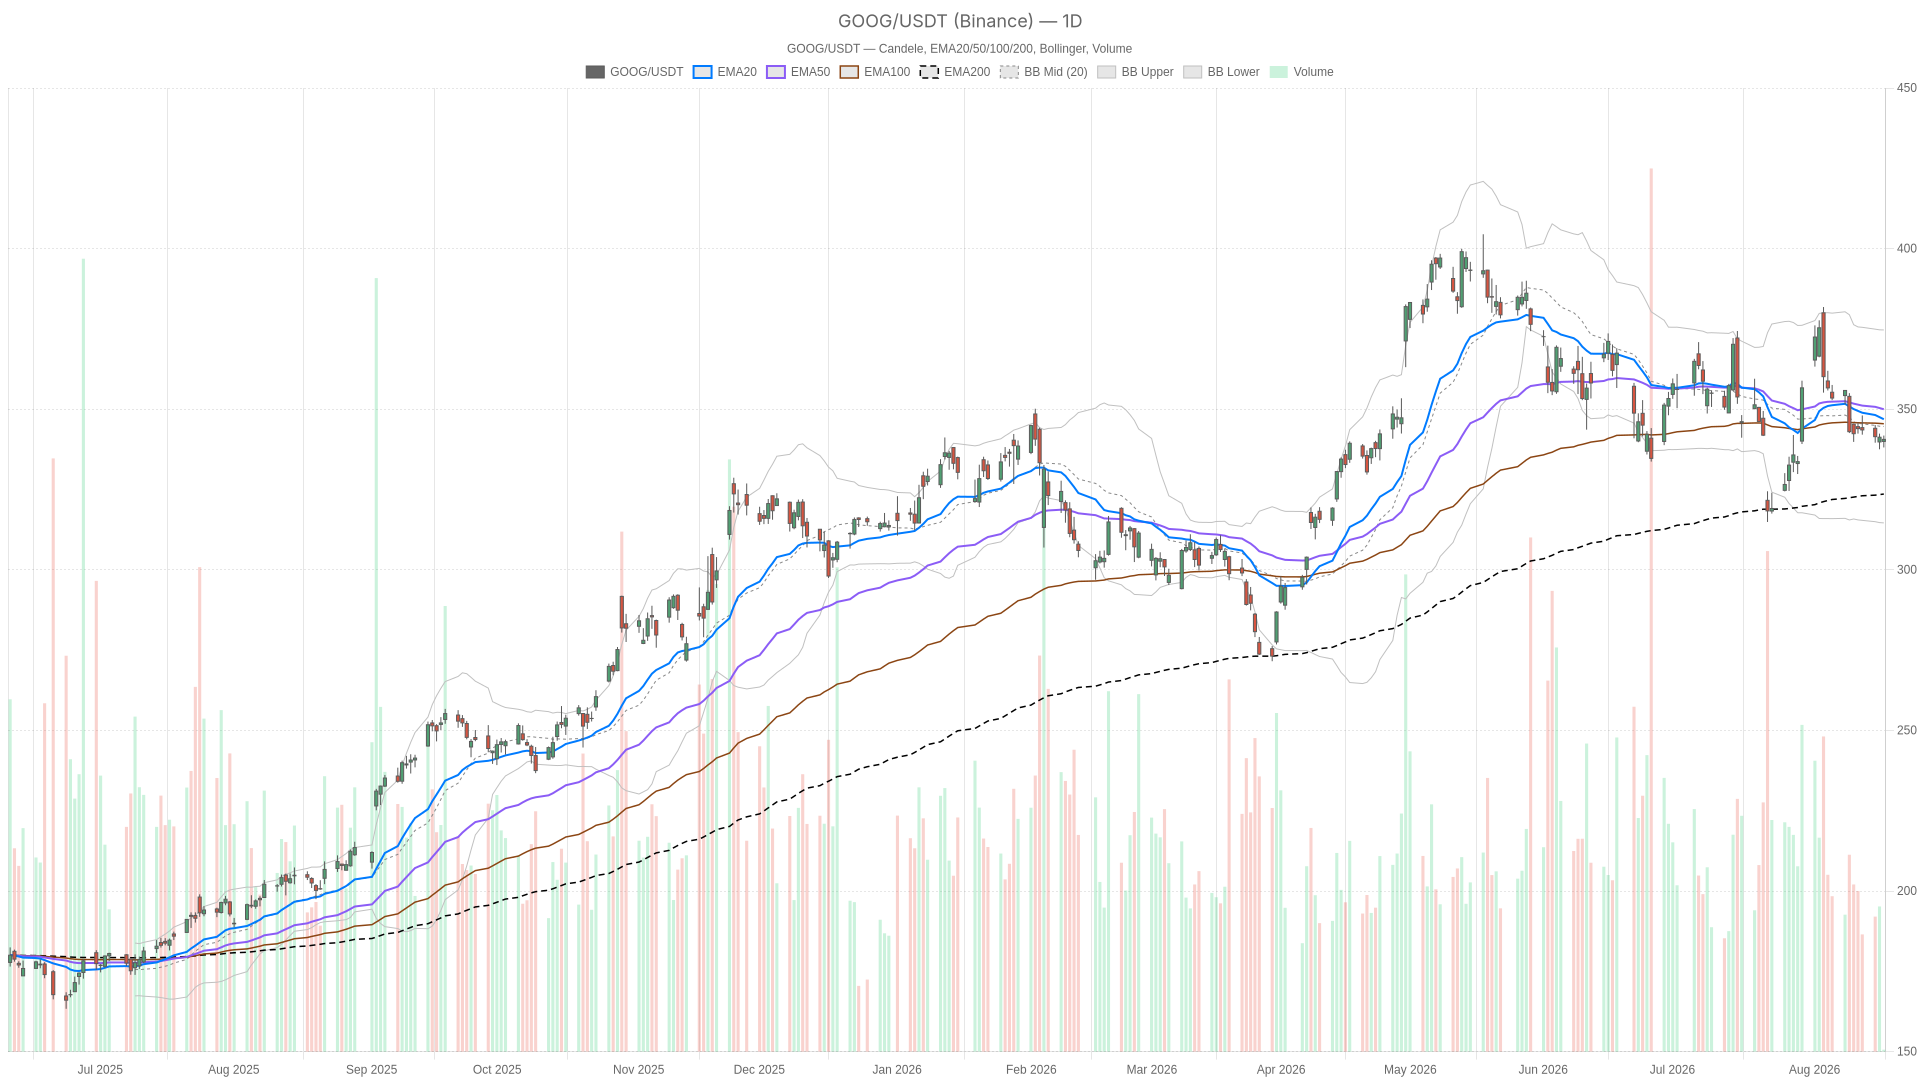
Google Alphabet stock is trading in a tightening range just above $340. The technical picture reads as neutral with a bearish tilt. Price sits below the 20-day and 50-day EMAs but above the 200-day EMA. Shorter-term momentum has rolled over while the longer-term uptrend remains intact.
Summary
Key takeaways
- Alphabet closed at 340.61 after a session high of 341.79 and a low of 338.09.
- The daily RSI at 44.6 and MACD histogram at -0.9 point to fading momentum.
- The 200-day EMA at 323.59 keeps the longer-term uptrend intact.
- The 1-hour chart shows a fully bearish EMA stack with price at 340.95.
- Key daily levels: pivot 340.16, resistance 342.23, support 338.53.
Google Alphabet Stock Daily Bias: Neutral, But Losing Upward Conviction
The daily bias for Google Alphabet stock is neutral, yet momentum is losing upward conviction.
The daily chart shows Alphabet closing at 340.61 after a high of 341.79 and a low of 338.09. Price sits below the 20-day EMA at 346.87 and the 50-day EMA at 349.98. However, it remains comfortably above the 200-day EMA at 323.59. This structure signals that the longer-term uptrend is intact while the shorter-term trend has rolled over.
Meanwhile, the daily RSI reading of 44.6 sits below the 50 midpoint. This confirms momentum has faded rather than simply paused. The MACD line at -2.33 remains below its signal line at -1.43. Its histogram of -0.9 continues to widen. In practice, daily momentum is not just negative; it is still building in the bearish direction.
On the volatility side, the Bollinger Bands show price hovering near the 344.64 midline. Their full range spans 314.60 to 374.67, suggesting volatility is present but not extreme. The daily ATR of 10.04 reinforces that Alphabet still has room to move meaningfully in either direction within a single session.
Pivot Structure Keeps Google Alphabet Stock at an Inflection Point
The pivot structure adds useful context for Google Alphabet stock. The pivot point sits at 340.16, with resistance at 342.23 and support at 338.53. Price closing right on top of the pivot signals indecision at a key level rather than conviction in either direction.
Alphabet Hourly Bias Turns Bearish but Compressed
On the 1-hour timeframe, Google Alphabet stock carries a bearish bias, yet volatility has compressed sharply.
The H1 chart shows price at 340.95, sitting below the 20-hour EMA of 341.82. It also trades below the 50-hour EMA of 344.57 and the 200-hour EMA of 348.72. That forms a fully bearish EMA stack, and the regime label reads bearish on this timeframe.
The H1 RSI at 42.7 is soft without being oversold. The MACD line at -0.98 remains below its signal at -1.15. Notably, the histogram has flipped slightly positive at 0.17. This hints at an early, tentative slowing of downside momentum rather than a reversal.
At the same time, the H1 Bollinger Bands are notably narrow. The upper band sits at 343.27 and the lower band at 340, with price close to that lower boundary. Combined with an ATR of just 1.78, this tells us volatility has contracted sharply. The hourly chart looks coiled, as if waiting for a trigger.
15-Minute Execution Context for Alphabet
The 15-minute chart offers little directional edge on its own, with Google Alphabet stock consolidating just under the daily pivot.
Zooming in further, price at 340.95 is trading just above its 20-period EMA of 340.83. However, it sits below the 50-period EMA at 341.21 and the 200-period EMA at 346.34. The RSI14 reading of 50.27 is essentially neutral, right at the equilibrium line.
The MACD histogram of -0.06 is negligible, and the regime is classified as neutral. Therefore, this timeframe mainly confirms consolidation. The 340.20 to 341.37 pivot range acts as the immediate battleground.
Bullish Scenario for Google Alphabet Stock
The bullish case for Google Alphabet stock rests on the longer-term uptrend and a reclaim of key pivot levels.
For bulls, the long-term trend is still intact above the 200-day EMA at 323.59. A reclaim of the daily pivot at 340.16 followed by a push through R1 at 342.23 would be an encouraging first sign.
On the hourly chart, the slightly positive MACD histogram would need to extend. That would help turn the H1 regime away from bearish. A move back above the H1 200-EMA at 348.72 would signal stronger upward rotation.
The news backdrop offers qualitative support. Reports indicate Wall Street sentiment toward Google stock remains constructive, with 13F filings showing continued institutional interest. Alphabet has also been active on the AI front, agreeing to acquire internal business data from Spirit Airlines for $10 million. This outbid a competing $7.5 million offer from AI data company Mercor.
In the meantime, coverage comparing Alphabet against Meta Platforms in AI-driven advertising remains a live theme. The AI narrative still matters to investors, even as the stock consolidates technically.
Bearish Scenario and Invalidation Levels for Alphabet
The bearish case is arguably better supported by current data, with daily momentum still expanding to the downside.
On the downside, daily momentum, shown by the MACD histogram of -0.9, is expanding lower. A daily close below the S1 support at 338.53 would open the door toward a deeper test of the lower Bollinger Band structure. On the hourly chart, a fully bearish EMA stack plus a bearish regime label suggests sellers hold the short-term initiative.
Notably, the news flow includes cautionary signals. Reports mention that billionaire investor Bill Ackman sold his Alphabet position. He rotated into another technology stock, described as up 65,100% since its IPO. This kind of high-profile repositioning adds a layer of narrative uncertainty around ownership conviction at current levels.
For the bearish scenario to gain further traction, sellers would need to see the daily RSI break decisively below 40. That would confirm momentum exhaustion is deepening rather than stabilizing.
Closing Take on Google Alphabet Stock
Overall, Google Alphabet stock sits at a genuine technical crossroads, with timeframes that are not fully aligned.
The daily chart is neutral but momentum-impaired. The hourly chart leans bearish, while the 15-minute chart is simply consolidating around the pivot. That disagreement across timeframes is the key takeaway.
Volatility, as measured by the daily ATR of 10.04, remains elevated enough to produce meaningful swings in either direction. In contrast, the tight hourly Bollinger Bands suggest the market may be building energy for a decisive move rather than continuing to drift.
Given the mixed signals across timeframes, positioning calls for discipline and patience. The news backdrop cuts both ways, leaving no clear case for conviction in a single direction. This analysis is provided for informational purposes and should not be considered financial advice.
FAQ
Is Google Alphabet stock’s longer-term uptrend still intact?
Yes. Alphabet closed at 340.61, which remains comfortably above the 200-day EMA at 323.59. The longer-term uptrend is technically intact, even though the shorter-term trend has rolled over.
What are the key levels to watch on Google Alphabet stock?
The daily pivot sits at 340.16, with resistance at 342.23 and support at 338.53. A reclaim of the pivot followed by a move through 342.23 would favor bulls. A daily close below 338.53 would open the door to deeper downside.
Why does the hourly chart lean bearish for Alphabet?
Price at 340.95 sits below the 20-hour, 50-hour, and 200-hour EMAs. That is a fully bearish EMA stack, and the hourly regime label reads bearish. The H1 RSI at 42.7 is soft without being oversold.
What does the daily momentum picture show?
The daily RSI at 44.6 sits below the 50 midpoint. The MACD line at -2.33 remains below its signal at -1.43, with a histogram of -0.9 that continues to widen. Momentum is fading and still building in the bearish direction.
Disclaimer: This article is for informational purposes only and does not constitute financial advice, an investment recommendation, or a solicitation to buy or sell any financial instrument or cryptocurrency. The analysis provided is not indicative of future results. Investing in crypto assets and financial markets carries a high risk of capital loss. Always do your own research (DYOR) and consult a qualified financial advisor before making any decision.
Article produced with the assistance of artificial intelligence and reviewed by the editorial team.
