




Marvell stock is back in focus after a volatile two-day swing. Shares fell more than 7.9% to $215.75 on Tuesday, then jumped roughly 12% after Marvell confirmed an expanded AI chip partnership with Google, including custom TPU-focused silicon and new warrants.
Summary
Key takeaways
- Marvell stock fell more than 7.9% to $215.75 on Tuesday, then rebounded roughly 12% after the Google AI chip deal.
- MRVL closed at $234.33 after a wide daily range of $228.21 to $245.44.
- Daily RSI14 at 56.63 and a firm bullish MACD crossover point to constructive momentum.
- The daily pivot at $235.99 and R1 at $243.78 are the immediate levels to watch.
- Daily ATR14 at 17.42 signals elevated volatility in either direction.
Marvell Stock Daily Trend: Bullish Structure, Wide and Nervous Range
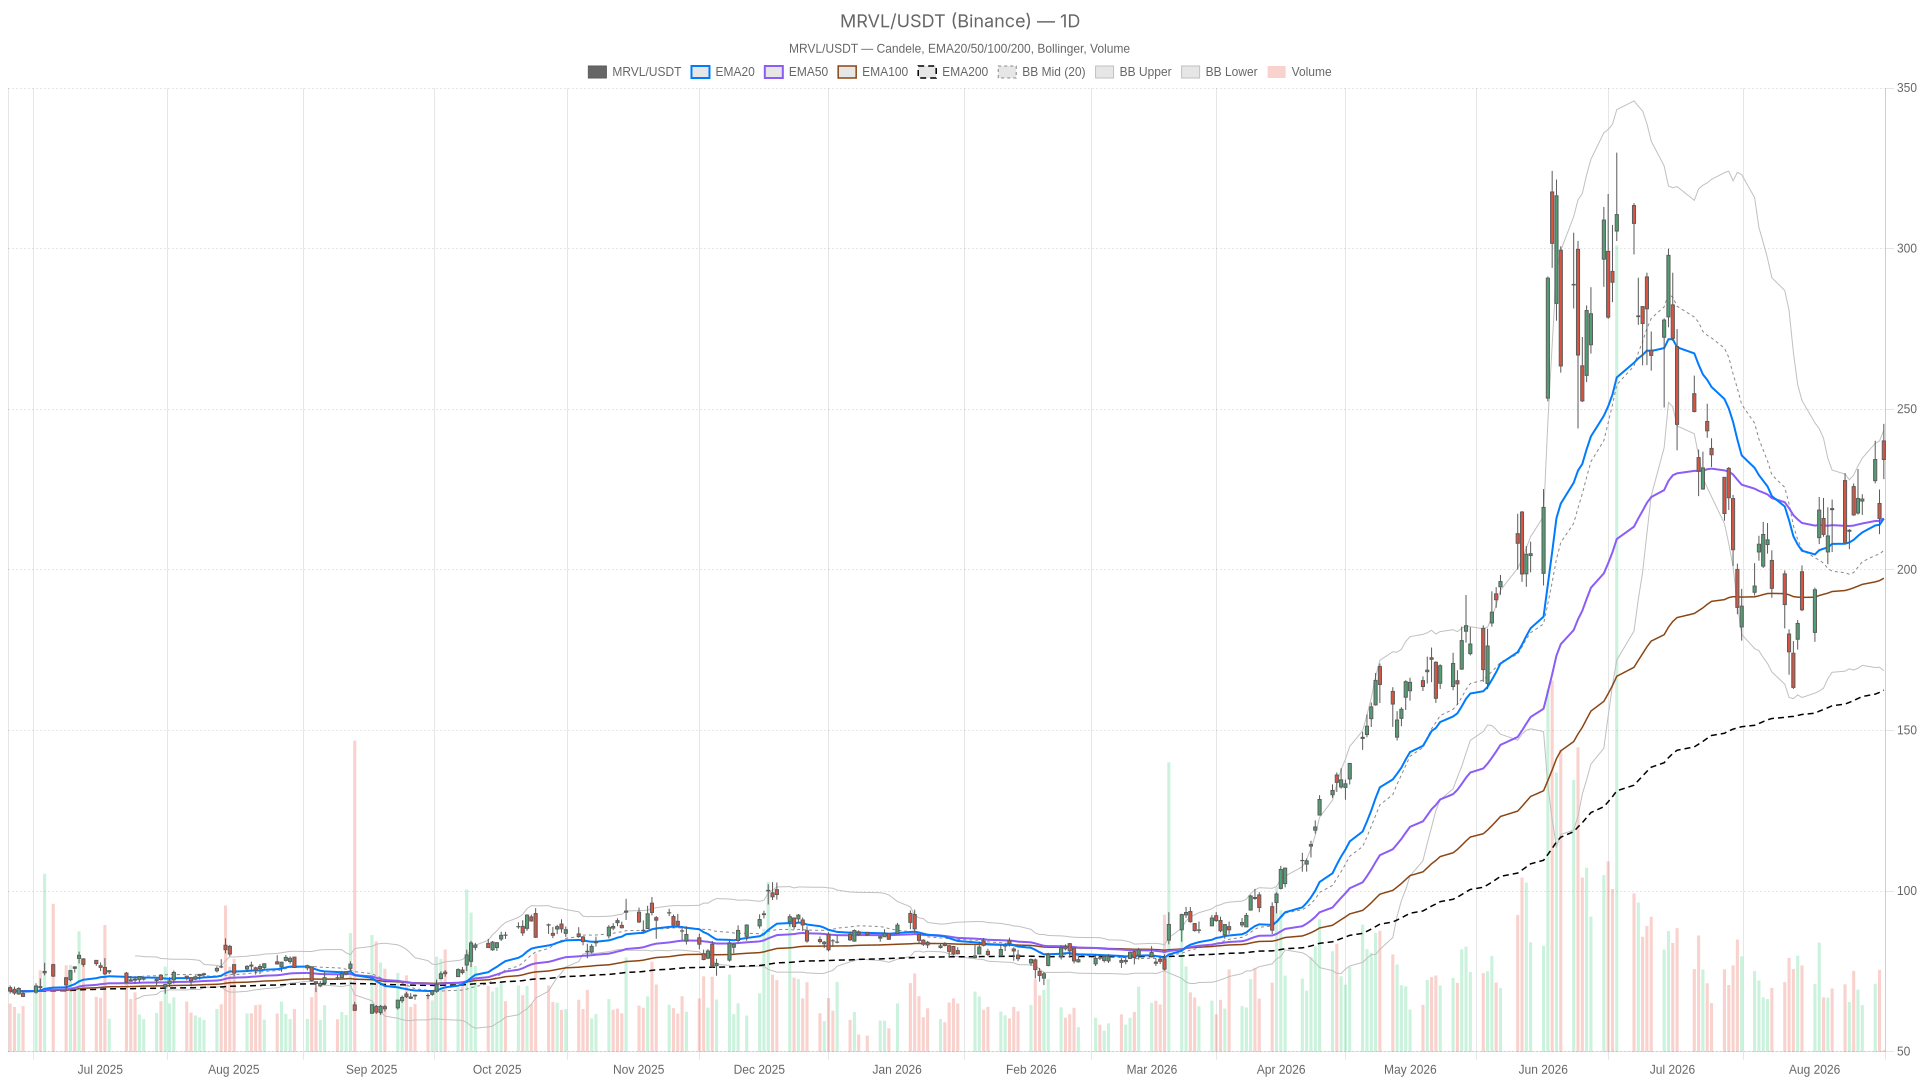
Overall, the daily trend for MRVL remains structurally bullish, but the range is unusually wide and nervous. MRVL closed at $234.33 after swinging between $228.21 and $245.44. That huge range reflects how much the Google news reshuffled positioning.
Notably, price sits well above the EMA20 and EMA50, both clustered near $216, and far above the EMA200 at $162.55. That alignment confirms the broader uptrend is intact, even after Tuesday’s sharp drawdown.
Daily RSI14 reads 56.63, a healthy, non-overbought level. It shows momentum is constructive without being stretched. Meanwhile, the daily MACD line at 1.87 sits above the signal at -2.80, producing a histogram of 4.67. That is a firm bullish crossover, suggesting the recent rally has real momentum behind it.
However, the system still classifies the daily regime as neutral. That likely reflects the sheer volatility of the range rather than a lack of directional conviction. Daily ATR14 stands at 17.42, an unusually wide reading that confirms this is a market digesting a major catalyst.
Bollinger Bands and Pivot Levels: Testing the Upper Edge
MRVL is testing the upper edge of its daily Bollinger range while hovering just below its daily pivot. The daily Bollinger setup adds context, with the mid-band at $206.05, the upper band at $243.48, and the lower band at $168.62.
At $234.33, price is trading close to the upper band. Still, that typically signals a strong directional push rather than exhaustion, though it also means the easy room to run higher is narrowing.
At the same time, pivot levels reinforce the idea that this is a market at a decision point. The daily pivot sits at $235.99, just above the current close, with resistance at $243.78 (R1) and support at $226.55 (S1). Price is hovering right under the pivot, meaning bulls still need to reclaim that line to confirm control of the session.
1H Timeframe: Momentum Confirms, Structure Turns Bullish
The hourly chart confirms the move, with structure turning outright bullish. EMA20 ($223.77), EMA50 ($220.87), and EMA200 ($219.85) are stacked in proper bullish order beneath price. The system flags the H1 regime as bullish.
Notably, that is a meaningful confirmation of the daily uptrend, even if the daily regime tag itself remains cautious. H1 RSI14 sits at 62.25, comfortably bullish without flashing overbought warnings yet.
The MACD line (0.35) is above its signal (0.15), with a modest but positive histogram of 0.20. Momentum here is real, though clearly less explosive than the daily histogram. That suggests the initial news-driven thrust is maturing into a steadier trend.
Meanwhile, the H1 pivot at $234.17 is essentially where price is sitting, with resistance at $236.46 and support at $232.05. This narrow band is the immediate battleground for Marvell stock in the current session.
15-Minute Execution Context
Short-term momentum is aggressive, but RSI is approaching overbought territory. On the 15-minute chart, EMA alignment remains bullish, and the regime reading agrees. RSI14 has climbed to 67.05, which warrants some caution for short-term entries.
The MACD histogram of 2.82, with the line at 2.93 well above the 0.10 signal, shows aggressive short-term momentum. Price at $234.33 is also pressing close to the 15-minute upper Bollinger Band at $236.14, mirroring the daily setup.
In other words, the stretch seen on the daily chart is being echoed at the execution level too. Traders looking at short-term entries should note the immediate resistance cluster around $236.46 (H1/15m R1) and $236.14 (Bollinger upper) is tightly packed.
Where the Timeframes Agree — and Where They Don’t
The three timeframes broadly agree on direction, but the daily regime tag remains a point of friction. Overall, EMA structure and MACD momentum all point higher, from the daily chart down to the 15-minute chart. The daily regime classification itself is tagged neutral despite bullish-leaning indicators underneath it.
That likely stems from the unusually wide daily range rather than a genuine loss of trend. Still, it is worth flagging as a technical inconsistency rather than smoothing it over.
Meanwhile, the broader narrative supports the bullish read. Beyond the Google deal, Marvell has also been highlighting new AI memory infrastructure products. These target server storage, CXL memory expansion, and optical shared memory for large-scale inference workloads. At the same time, comparisons with peers like Broadcom in the semiconductor space add context. Investors are reminded that this rally sits within a competitive, closely watched sector.
Bullish Scenario for Marvell Stock
The bullish case depends on reclaiming the daily pivot and clearing the R1 resistance zone. Marvell stock needs to retake the daily pivot at $235.99. From there, it would need to push through R1 at $243.78, which lines up closely with the upper daily Bollinger Band near $243.48.
A clean breakout above that zone would confirm the Google-driven rally has staying power rather than fading into a fill-the-gap move. Continued bullish EMA alignment on the H1 and 15m charts would support that outcome.
Sustained RSI readings in the 55–65 zone on the daily chart would be a healthy sign. That would show the move has room left without tipping into extreme overbought territory.
Bearish Scenario and Invalidation Points
On the other hand, the bearish risk centers on losing the H1/15m pivot and sliding toward the $232.05 support. A drop back below that support level would open the door toward the daily S1 at $226.55. If selling pressure intensifies, price could fall back toward the EMA20/EMA50 cluster near $216.
Given that 15-minute RSI is already near 67, a short-term pullback would not be surprising even within an intact uptrend. The key invalidation for the bullish thesis would be a daily close back below the EMA20/EMA50 zone.
That would suggest the Google-deal rally failed to hold and the prior sell-off resumes.
Closing Take
Overall, Marvell stock is caught between strong bullish momentum and elevated volatility. The daily ATR of 17.42 and the wide intraday range make clear that price swings are likely to stay large in either direction.
Positioning around the $234–$236 pivot zone looks decisive for the next leg. Given the scale of Tuesday’s drop and Wednesday’s rebound, uncertainty remains high. Traders should treat the current setup as constructive but unsettled, with volatility itself being as important a factor as direction.
FAQ
Why did Marvell stock jump on Wednesday?
Marvell confirmed an expanded AI chip partnership with Google, including custom TPU-focused silicon and new warrants issued to Google. The shares rebounded roughly 12% after falling more than 7.9% to $215.75 on Tuesday.
What are the key levels to watch for Marvell stock?
The immediate battleground is the $234–$236 pivot zone. Bulls need to reclaim the daily pivot at $235.99 and clear R1 at $243.78. On the downside, support sits at $232.05, then the daily S1 at $226.55 and the EMA20/EMA50 cluster near $216.
What does the daily ATR14 reading suggest?
The daily ATR14 stands at 17.42, an unusually wide reading. It signals that price swings are likely to remain large in either direction as the market digests the Google catalyst.
Is the broader uptrend still intact for MRVL?
Yes, the broader uptrend looks intact. Price sits above the EMA20 and EMA50 near $216 and far above the EMA200 at $162.55. Daily RSI14 reads 56.63, with a firm bullish MACD crossover supporting the move.
Disclaimer: This article is for informational purposes only and does not constitute financial advice, an investment recommendation, or a solicitation to buy or sell any financial instrument or cryptocurrency. The analysis provided is not indicative of future results. Investing in crypto assets and financial markets carries a high risk of capital loss. Always do your own research (DYOR) and consult a qualified financial advisor before making any decision.
Article produced with the assistance of artificial intelligence and reviewed by the editorial team.
