




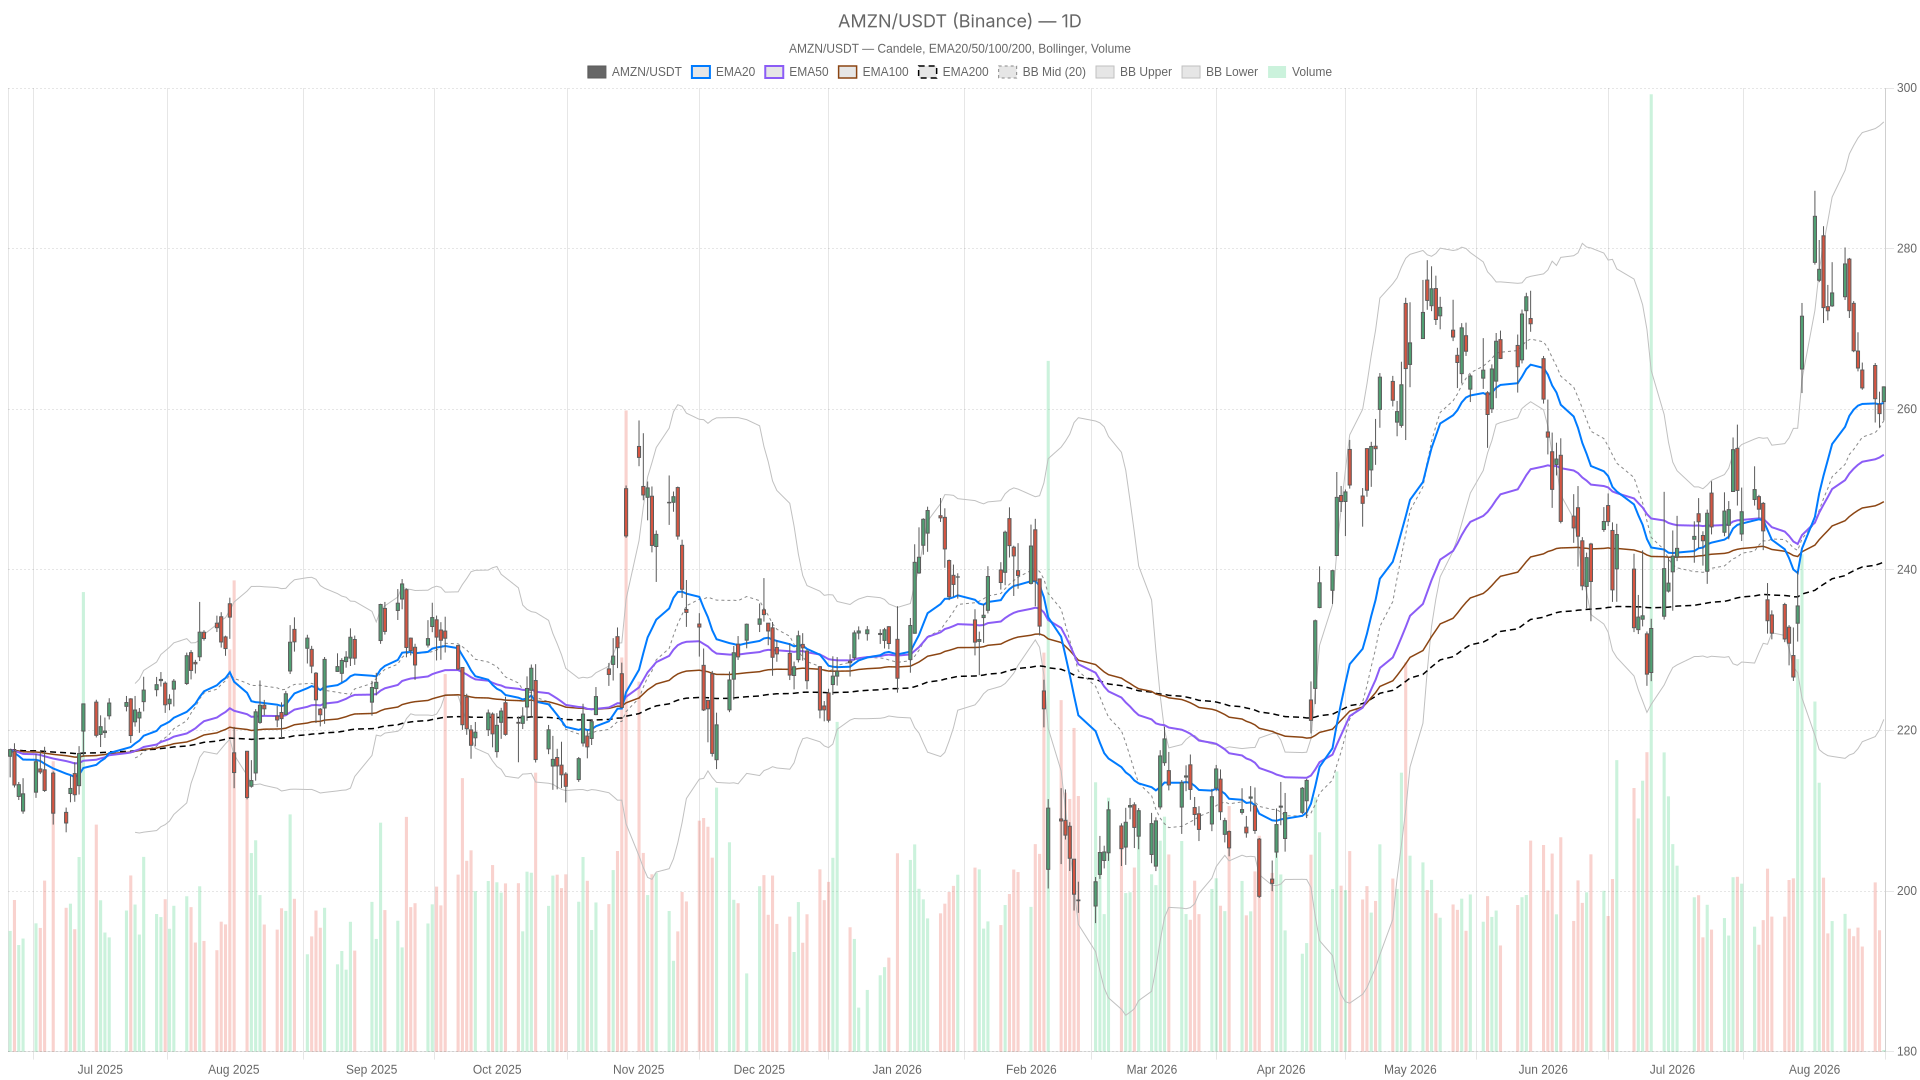
Amazon stock is holding near session highs after closing at $262.78, above the open of $260.95 and the day’s low of $258.59. The daily trend remains constructive. Still, short-term momentum signals are splitting across timeframes, leaving the near-term direction less clear.
Summary
Key takeaways
- Amazon stock closed at $262.78 on the daily chart, above the EMA20 (260.8), EMA50 (254.33) and EMA200 (240.97).
- The daily regime is bullish, but the daily MACD histogram is negative at -1.08, signaling cooling momentum.
- Hourly structure is neutral, with price below the EMA50 (264.47) even as it holds above the EMA20 and EMA200.
- The daily pivot sits at 261.39, with R1 at 264.20 and S1 at 259.98; price is trading above the pivot.
- Hedge fund positioning was mixed: Viking, Baupost and Renaissance added, while Bridgewater and Pershing cut stakes.
Amazon Stock Technical Structure: Daily Bias Stays Bullish, Momentum Cools
Amazon stock keeps a bullish daily bias, yet momentum is cooling rather than confirming the move higher.
The daily RSI14 sits at 53.5, a neutral-to-firm reading that leaves room for further upside without an immediate exhaustion signal. However, the daily MACD tells a slightly different story. The MACD line is at 4.57 against a signal line of 5.64, producing a negative histogram of -1.08. In plain terms, momentum is decelerating even as price grinds higher. This is not a reversal signal on its own, but it warns that the rally’s strength is thinning beneath the surface.
Daily Bollinger Bands show the mid-line at 258.58, with the upper band at 295.78 and the lower band at 221.38. Price closing near the mid-band, well below the upper boundary, leaves plenty of technical room to extend higher before volatility caps the move. Daily ATR14 reads 9.2, consistent with normal, healthy volatility rather than anything stretched or compressed. Pivot levels sit at a pivot point of 261.39, with resistance at 264.20 (R1) and support at 259.98 (S1). Price closing above the pivot and near R1 is generally read as a mildly bullish intraday signal.
What the Hourly Chart Adds to the Amazon Stock Picture
The hourly chart adds nuance: Amazon stock is neutral here, not yet confirming the daily bullish bias.
On the 1-hour timeframe, price at $262.78 sits above the EMA20 (261.84) and EMA200 (257.85), but below the EMA50 (264.47). That is a mixed EMA stack, and it is why the system tags the hourly regime as neutral rather than bullish. Meanwhile, hourly RSI14 at 50.53 is dead-center neutral, offering no directional edge either way.
The hourly MACD adds another layer. The MACD line is negative at -1.40, with the signal line at -1.89, producing a positive histogram of 0.49. In other words, momentum here is still technically negative in absolute terms, but it is improving. That usually reflects an attempted recovery rather than firm bullish control. At the same time, hourly Bollinger Bands (mid 261.16, upper 263.73, lower 258.58) show price pressing toward the upper band. That signals near-term strength even as the broader hourly trend remains undecided.
Hourly ATR14 at 1.80 confirms volatility is contained and orderly on this timeframe. The hourly pivot point stands at 262.27, with resistance at 263.32 and support at 261.74. Amazon stock is currently trading just above that pivot.
15-Minute Execution Context for Amazon Stock
The 15-minute chart shows active short-term buying, but it is useful only for execution timing, not for defining bias.
On the 15-minute chart, AMZN’s RSI14 has climbed to 66.66, approaching overbought territory and signaling active short-term buying pressure. The 15-minute MACD is also modestly positive, with the line at 0.10 above a signal line of -0.09, producing a small but positive histogram of 0.20. That combination points to short-term bullish momentum still in play.
In contrast, the EMA structure on this timeframe is telling: price is above the EMA20 (260.66) and EMA50 (261.01), but below the EMA200 (266.34). That inversion suggests the very short-term bounce is happening inside a longer 15-minute downtrend that has not fully resolved. Bollinger Bands here (mid 260.71, upper 262.36, lower 259.06) show price trading at or above the upper band, another sign of near-term overextension. This argues for some caution on chasing strength into resistance.
The Bullish Case for Amazon Stock
The bullish case rests on the daily trend continuing to dominate, supported by a strengthening fundamental backdrop.
The bullish scenario for Amazon stock rests on the daily trend continuing to dominate. Price holding above the daily EMA20, EMA50 and EMA200 supports the case for continuation toward the daily R1 at 264.20 and beyond. The RSI14 still has room before overbought, which reinforces that path.
Fundamentally, the news flow adds weight to the structural bias. Reports highlight that Amazon’s AI business has passed a $25 billion run rate, more than doubling over the past year. AWS is also seeing accelerated revenue growth driven by AI demand. Notably, management has reportedly revised its long-term AWS revenue ambition upward to a $1 trillion figure, described as a real possibility rather than a stretch goal.
Hedge fund activity in the most recent quarter was active, with Viking, Baupost and Renaissance reportedly increasing their positions. If daily momentum stabilizes and the MACD histogram stops contracting, the bullish thesis gains further technical confirmation.
The Bearish Case and What Would Invalidate the Bullish Bias
The bearish risk centers on the daily MACD histogram staying negative and widening, which would confirm genuine momentum loss.
On the other hand, the bearish risk is centered on that daily MACD histogram staying negative and widening further. A continued gap between the MACD line and its signal line would indicate genuine momentum loss, not just noise. In contrast to the AI-driven optimism in the news, the same Yahoo Finance piece on AWS growth also flagged rising competition as a factor that could pressure future returns. That is a real fundamental counterweight to the trillion-dollar AWS narrative.
On the hourly chart, price remaining below the EMA50 (264.47) is a technical ceiling that must break for the bullish case to strengthen. Hedge fund activity was not uniformly bullish either: Bridgewater and Pershing reportedly cut their stakes during the same quarter that Viking, Baupost and Renaissance added to theirs. A daily close below the pivot at 261.39, especially below S1 at 259.98, would be the clearest signal that the bearish case is taking hold.
Amazon Stock Outlook: Positioning and Volatility
Overall, Amazon stock keeps a bullish daily structure, but momentum is not unanimous across timeframes.
Overall, the daily trend in Amazon stock remains bullish by structure, but the momentum picture is not unanimous across timeframes. The daily and hourly MACD readings both show some degree of weakening relative to price, even as the 15-minute chart shows short-term buyers still active near the upper Bollinger band. Therefore, this looks less like a clean trending market and more like a bullish structure being tested by short-term hesitation.
Daily ATR14 at 9.2 suggests volatility is not elevated, which should keep near-term swings within a relatively normal range. Similarly, the mixed hedge fund positioning reported for the quarter mirrors the technical ambiguity seen between the daily and hourly charts. Given the conflicting signals between trend and momentum, patience around key pivot and resistance levels seems more appropriate than assuming the path higher is a straight line.
FAQ
Is Amazon stock still in an uptrend?
Yes. The daily chart remains bullish, with Amazon stock closing at $262.78 above the EMA20 (260.8), EMA50 (254.33) and EMA200 (240.97).
What is the main momentum concern for Amazon stock?
The daily MACD histogram is negative at -1.08, with the MACD line at 4.57 below the signal line at 5.64. This shows momentum cooling even as price holds higher.
Which price levels matter most for Amazon stock?
The daily pivot is 261.39, with R1 resistance at 264.20 and S1 support at 259.98. A close below S1 would strengthen the bearish case.
What did hedge funds do with Amazon stock recently?
Positioning was mixed. Viking, Baupost and Renaissance reportedly increased their stakes, while Bridgewater and Pershing cut theirs during the same quarter.
Disclaimer: This article is for informational purposes only and does not constitute financial advice, an investment recommendation, or a solicitation to buy or sell any financial instrument or cryptocurrency. The analysis provided is not indicative of future results. Investing in crypto assets and financial markets carries a high risk of capital loss. Always do your own research (DYOR) and consult a qualified financial advisor before making any decision.
Article produced with the assistance of artificial intelligence and reviewed by the editorial team.
