

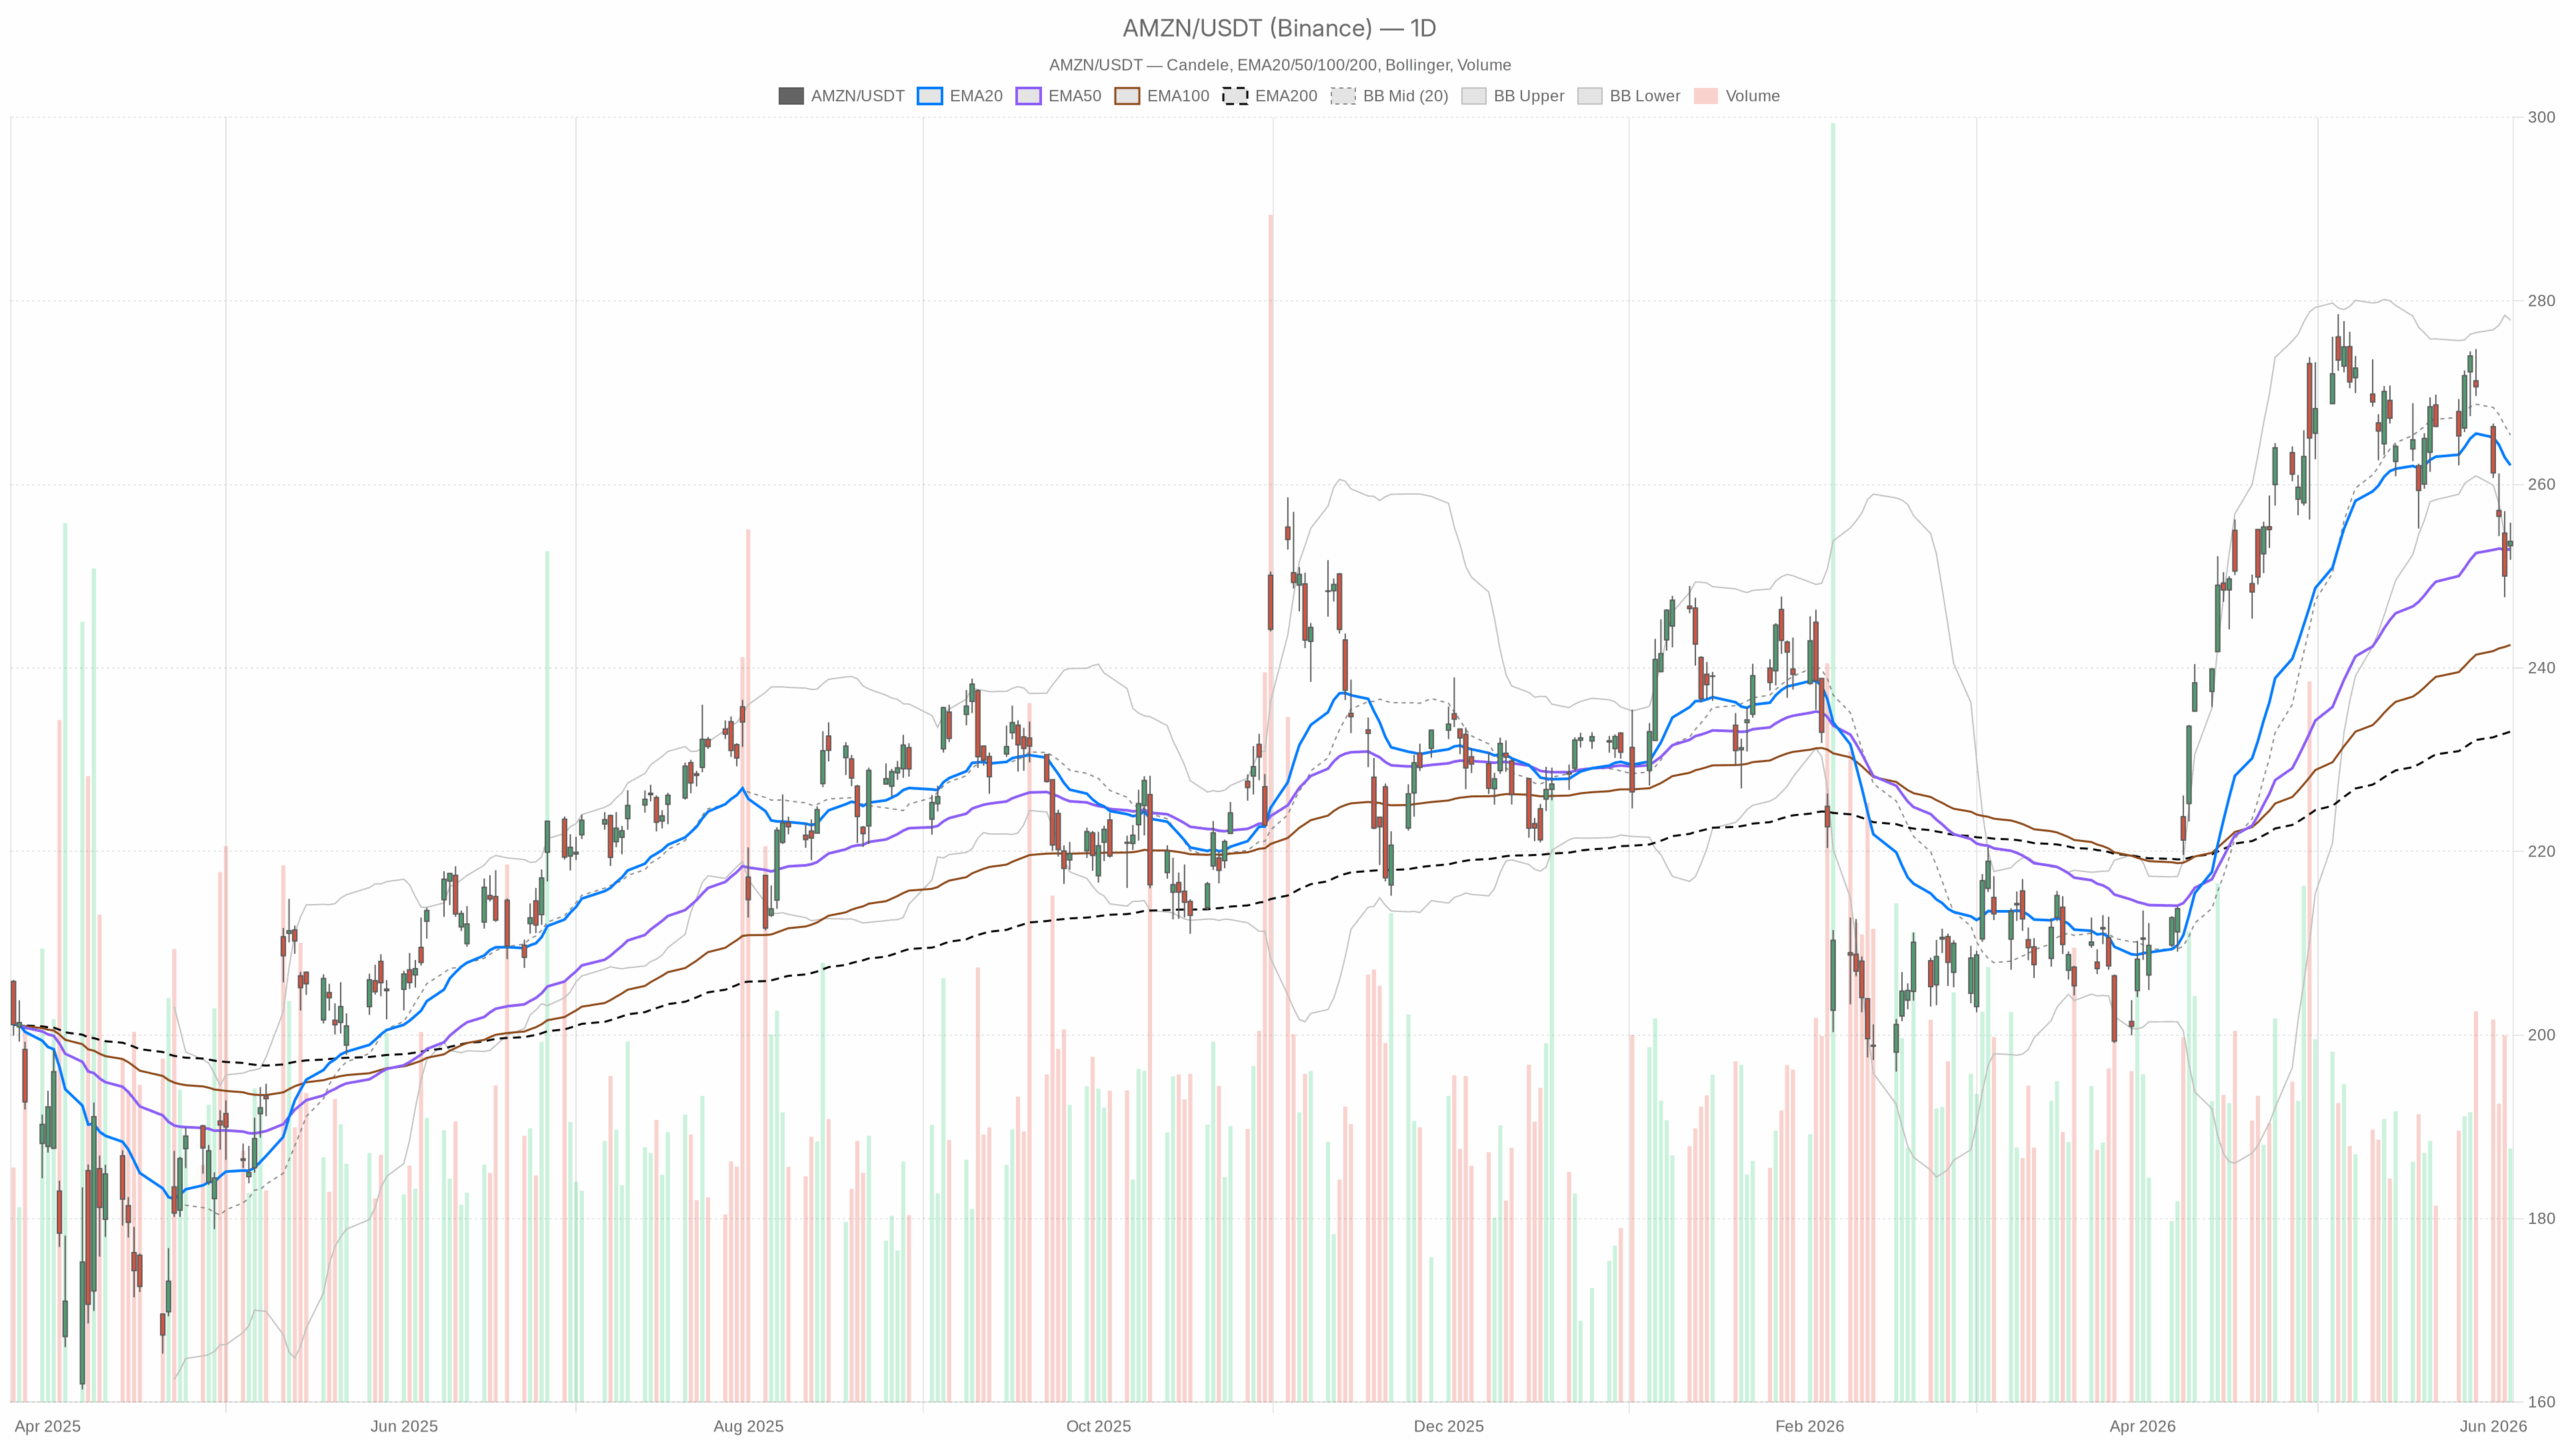
Amazon stock is caught in a genuine tug-of-war between a compelling fundamental growth story and a daily chart that has quietly deteriorated. At $253.79, AMZN is trading below its 20-day EMA of $262.08 while holding just above the 50-day EMA at $252.93. That configuration defines the current standoff: the medium-term trend has weakened, but a full breakdown has not yet materialized. The daily regime is officially neutral, and that label fits.
Summary
Technical Resistance Challenges Amazon Stock’s Momentum
The daily price structure reflects a clear story of compression. Bollinger Bands place the lower band at $252.85, meaning the current close is essentially testing that boundary. The midline sits at $265.38 — still $11 above the market. Price near the lower band without a decisive bounce is not a bullish posture. It shows a stock that has surrendered its recent premium and is now leaning on a thin technical floor.
Daily RSI at 43.5 adds further context. The reading is below neutral but not oversold, indicating no exhaustion of selling pressure yet. Meanwhile, daily MACD presents a cautious picture: the histogram is -3.05, and the MACD line at 0.9 is well below the 3.95 signal line. This divergence signals fading momentum and does not suggest readiness for a higher break without catalysts.
Short-Term Trends Signal Bearish Bias Despite Stabilizing Momentum
Hourly Chart Confirms Bearish Structure
On the hourly chart, the bias shifts more decisively negative. The 1H regime is bearish, with price at $253.91 trading below the 20-period EMA ($255.06), 50-period EMA ($259.57), and 200-period EMA ($260.02). This creates a clean bearish stack across all major short-term averages. However, the hourly MACD histogram has turned to +0.80, suggesting selling pressure is moderating. While this complicates the picture, it does not reverse the bearish bias.
Intraday Compression on the 15-Minute Chart
The 15-minute timeframe offers the most constructive short-term signals. RSI at 53.18 is back above neutral. Price hugs the 20 and 50 EMAs tightly, and Bollinger Band width is extremely narrow, indicating compression. This compression might resolve either way, but combined with the improving hourly MACD histogram, it signals that intraday sellers are losing urgency near the $250–$254 range.
Pivot Levels and Volatility Frame Near-Term Trading Range
Pivot points anchor the near-term range clearly. The daily pivot sits at $253.80, nearly matching the last close. Resistance at R1 is $255.82, and support at S1 is $251.77. Hourly pivot structure mirrors this range. An intraday move above $255.33–$255.82 would signify a real short-term shift. Conversely, a break below $251.25–$251.77 would open space toward the $248–$249 area with little structural support between.
Daily ATR is $7.05, reflecting meaningful potential moves each session. This is not a low-volatility environment. Traders must respect that any single news-driven session could invalidate technical setups, especially given active news flow around AMZN currently.
Fundamental Tailwinds Support Amazon Stock Amid Technical Constraints
Fundamentally, the growth story for Amazon stock is powerful. Amazon recently signed a $4 billion cloud services deal with Pinterest, the largest infrastructure commitment in Pinterest’s history, directly expanding AWS AI capacity. Additionally, Anthropic, an AI startup where Amazon is a major investor and infrastructure partner, has filed confidentially for an IPO. If Anthropic reaches a trillion-dollar valuation, Amazon’s balance sheet and strategic position would benefit substantially.
AWS delivered 28% growth in its latest quarter, the fastest pace in 15 quarters. The advertising segment now runs at a $70 billion trailing-twelve-month pace. The chips business crossed a $20 billion run rate. These gains are far from incremental.
Market Caution Reflects Valuation Risks Despite Growth
The market’s hesitation is rational. Analysts note that Amazon is performing near peak conditions across core businesses. The risk is the current stock price already assumes these peak levels are permanent. This is a legitimate valuation concern. Investors also eye an upcoming near-term catalyst: Prime Day, scheduled for June 23–26, which often influences investor sentiment ahead of Q3 estimates.
Key Scenarios: Reclaim or Breakdown Define Amazon Stock’s Path
Bullish Scenario
The bullish case depends on reclaiming the $255.82–$262 zone. A daily close above the 20-day EMA at $262 would restructure the daily trend and reopen the path toward prior highs. Confirmation from the hourly chart breaking above its stacked EMAs would strengthen this view. Positive newsflow regarding Anthropic’s IPO timeline or additional AWS agreements could catalyze this shift.
Bearish Scenario
The bearish outlook begins with a clear break below daily S1 at $251.77 and the lower Bollinger Band at $252.85. A confirmed close beneath these levels would suggest the daily neutral regime is tipping bearish. The hourly structure is already bearish. Losing the $251 floor would align all timeframes downward, a meaningful development. The next support lies near $240–$245, based on the gap to the EMA200 at $233.
Conclusion: Amazon Stock Balances Grounded Technical Risk With Rich AI Growth Potential
Overall, Amazon stock sits at a technically critical juncture with a fundamentally strong backdrop. The daily chart is neutral, neither bearish nor constructive, holding just above structural support. Short-term momentum shows signs of stabilizing near pivots, though the hourly trend remains pressured. Investors must respect both outcomes: the AI-driven growth story is genuine, but so is the technical fragility below $252. Given the $7 daily ATR, clarity could emerge quickly. Until AMZN convincingly reclaims its 20-day EMA, patience is warranted over aggressive long positions.