

On June 4, Veru stock surged dramatically, climbing from around $2.18 to an intraday high of $7.33 before closing at $4.23. This explosive move was triggered by a clinical supply agreement with Novo Nordisk to co-evaluate enobosarm in a Phase 2b obesity trial. The key question is whether Veru stock’s close above $4 signals a sustained re-rating or a peak following a sentiment spike.
Summary
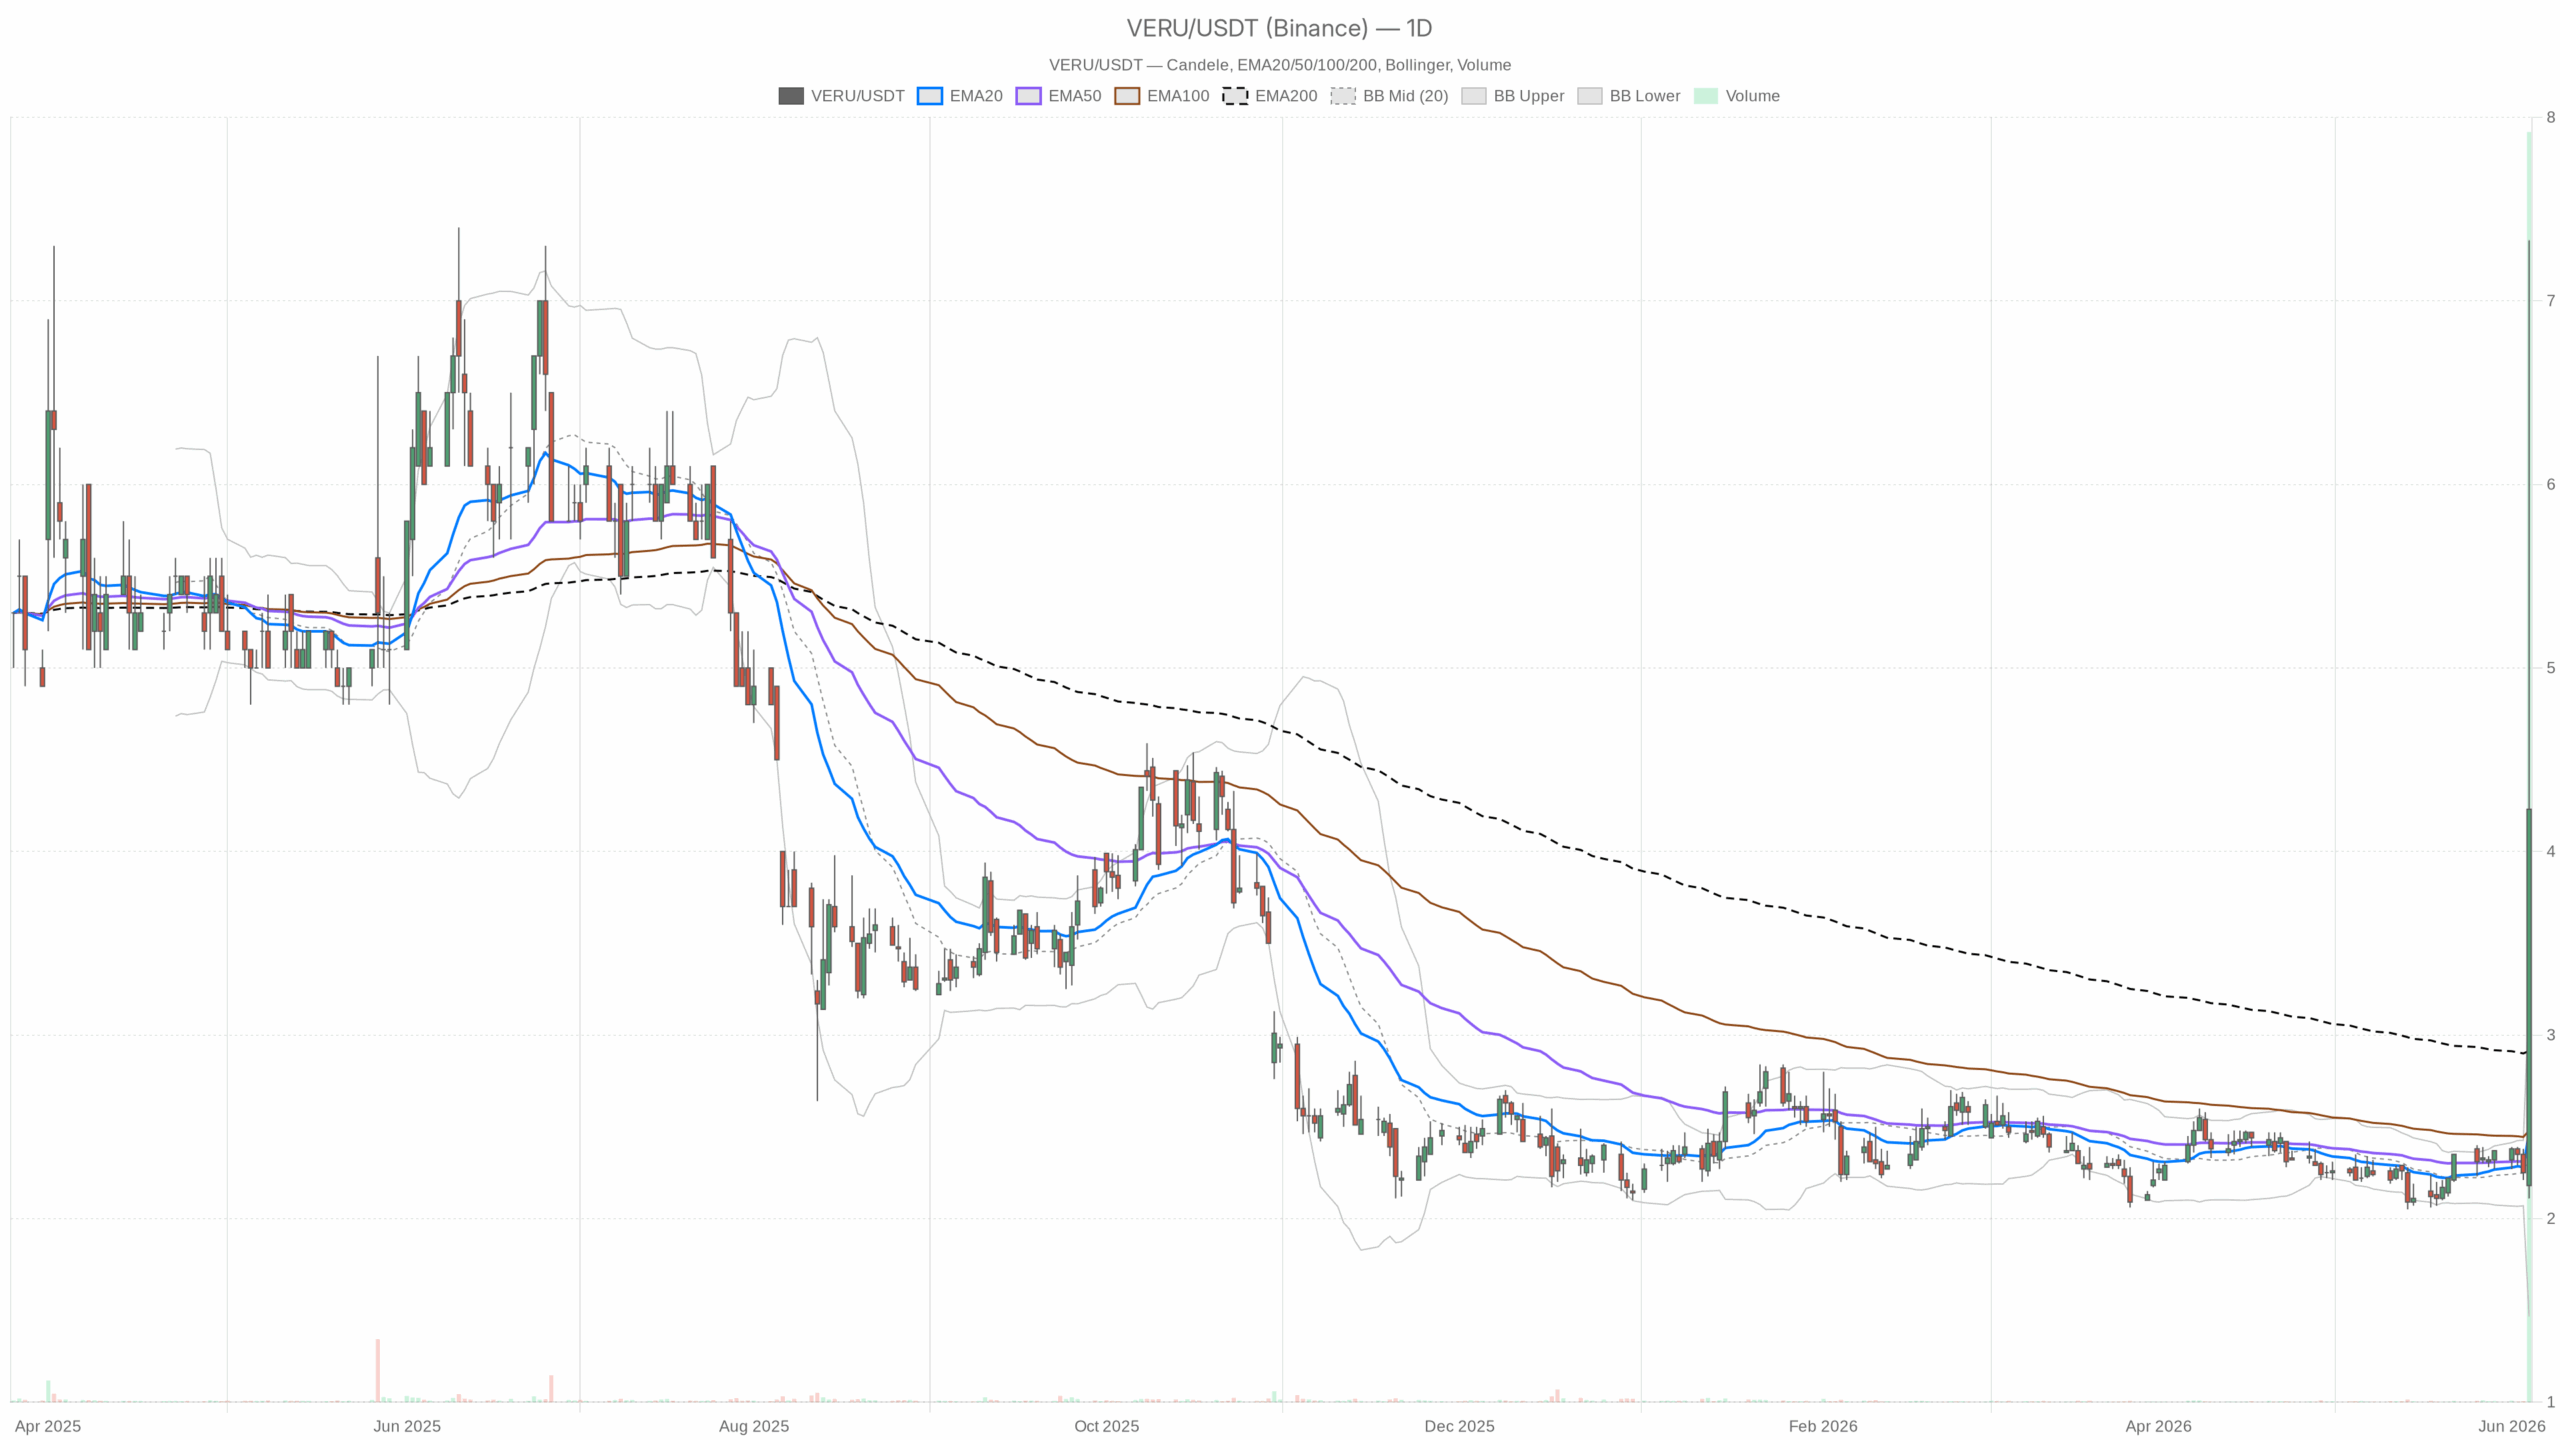
Veru Stock Daily Chart Signals Structural Shift
On the daily timeframe, Veru stock closed well above its EMA20 ($2.47), EMA50 ($2.38), and notably above the EMA200 ($2.91). This close above the 200-day moving average marks a structural shift for VERU, changing its longer-term trend. However, the close at $4.23 far exceeded the Bollinger Band upper boundary of $3.23, indicating a sharp volatility repricing rather than a routine move.
Extreme RSI Highlights Overbought Conditions
The daily RSI at 87.85 indicates that VERU is deeply overbought by conventional standards. Although such readings usually predict pullbacks, high-momentum biotech stocks can maintain extended RSI levels for several sessions after a catalyst-driven breakout. Yet, the sheer velocity of the price gain — an intraday range exceeding $5 on a sub-$3 stock — is unusual and warrants caution.
MACD and ATR Confirm Volatility and Momentum
The daily MACD shows a fresh bullish crossover, with the MACD line at 0.16 above the signal line at 0.03, supporting the upward momentum. Still, this indicator is a lagging signal confirming the catalyst-driven surge. The daily ATR of $0.49 contrasts starkly with the session’s actual price range, nearly ten times the average, emphasizing the elevated risk of a sharp reversal.
Pivot Analysis and Intraday Price Dynamics
Daily pivot analysis reveals the pivot point at $4.56, slightly above the closing price of $4.23. VERU’s failure to hold above this pivot into the close, despite reaching an intraday high of $7.33 near resistance at $7.00, suggests selling pressure curbed further gains. Nonetheless, the near doubling from the open price highlights strong buying interest.
Hourly Chart Supports Near-Term Bullish Bias
The H1 timeframe remains bullish, with price above EMA20 ($3.38), EMA50 ($2.81), and EMA200 ($2.42). The hourly MACD is positive, with the 0.62 line above the 0.37 signal, and the RSI is a tempered 62.15. This divergence between daily and hourly RSI suggests cooling momentum on the short term but an intact trend structure overall.
Short-Term Execution Risks on 15-Minute Chart
Conversely, the 15-minute chart signals caution. The MACD histogram turned negative at -0.16, and the MACD line lies below its signal, indicating a short-term bearish crossover. With price below the 15m EMA20 of $4.42 and an ATR of $0.80, immediate momentum has weakened, suggesting short-term entries face heightened risk despite the broader move.
Fundamental Context Behind the Veru Stock Surge
Veru’s recent Q2 fiscal 2026 results showed a notable reduction in net losses and operating expenses, signaling financial discipline while shifting focus to enobosarm’s potential in obesity treatment. The Novo Nordisk agreement adds credibility, pairing Veru’s experimental drug with Wegovy in a Phase 2b trial. The market aggressively priced in this validation, but the success of Phase 2b data remains uncertain.
Potential Scenarios for Veru Stock Moving Forward
The bullish outlook depends on sustaining momentum above $4 and recapturing the $4.56 daily pivot. Maintaining this level and the hourly trend intact targets the $5.27 resistance zone. A close above $5 could indicate institutional involvement rather than just retail enthusiasm, supported by positive fundamentals and industry momentum.
The bearish scenario hinges on failure to hold $4. Dropping below this level could lead to retesting support at $2.72 and possibly $2.25. The extreme daily RSI makes a near-term reversion plausible. If the Novo Nordisk catalyst loses steam or the biotech sector weakens, the premium might evaporate quickly, turning the move into a short-lived liquidity spike.
Conclusion: Veru Stock Faces Volatility and a Critical Juncture
Veru stock is in a volatile but pivotal position. The daily chart shows a clear breakout supported by news and improving fundamentals. However, the extreme RSI, intraday price rejection near $7.33, and short-term bearish signals caution against complacency. Traders and investors must navigate heightened volatility with discipline, as the margin for error remains narrow at these levels.