

The price of Cardano crypto has been in a technically compromised phase in recent months. At $0.16, the token is well below every relevant moving average, with the daily chart showing aggressive selling and an almost total absence of demand. The general context does not help: Bitcoin dominance is at 56.2%, total market capitalization has decreased by 2% in the last 24 hours, and the Fear & Greed Index stands at 12 — Extreme Fear. For those following a Cardano investment now, it is essential to understand whether this is a final capitulation or a continuation of the bearish trend.
The situation is clear: the regime remains bearish on all timeframes, with predominant selling pressure and no reliable technical signal of a reversal. However, some indicators are reaching extreme values, suggesting the possibility of a short-term technical rebound, not a definitive reversal.
Summary
The daily structure: everything is under pressure
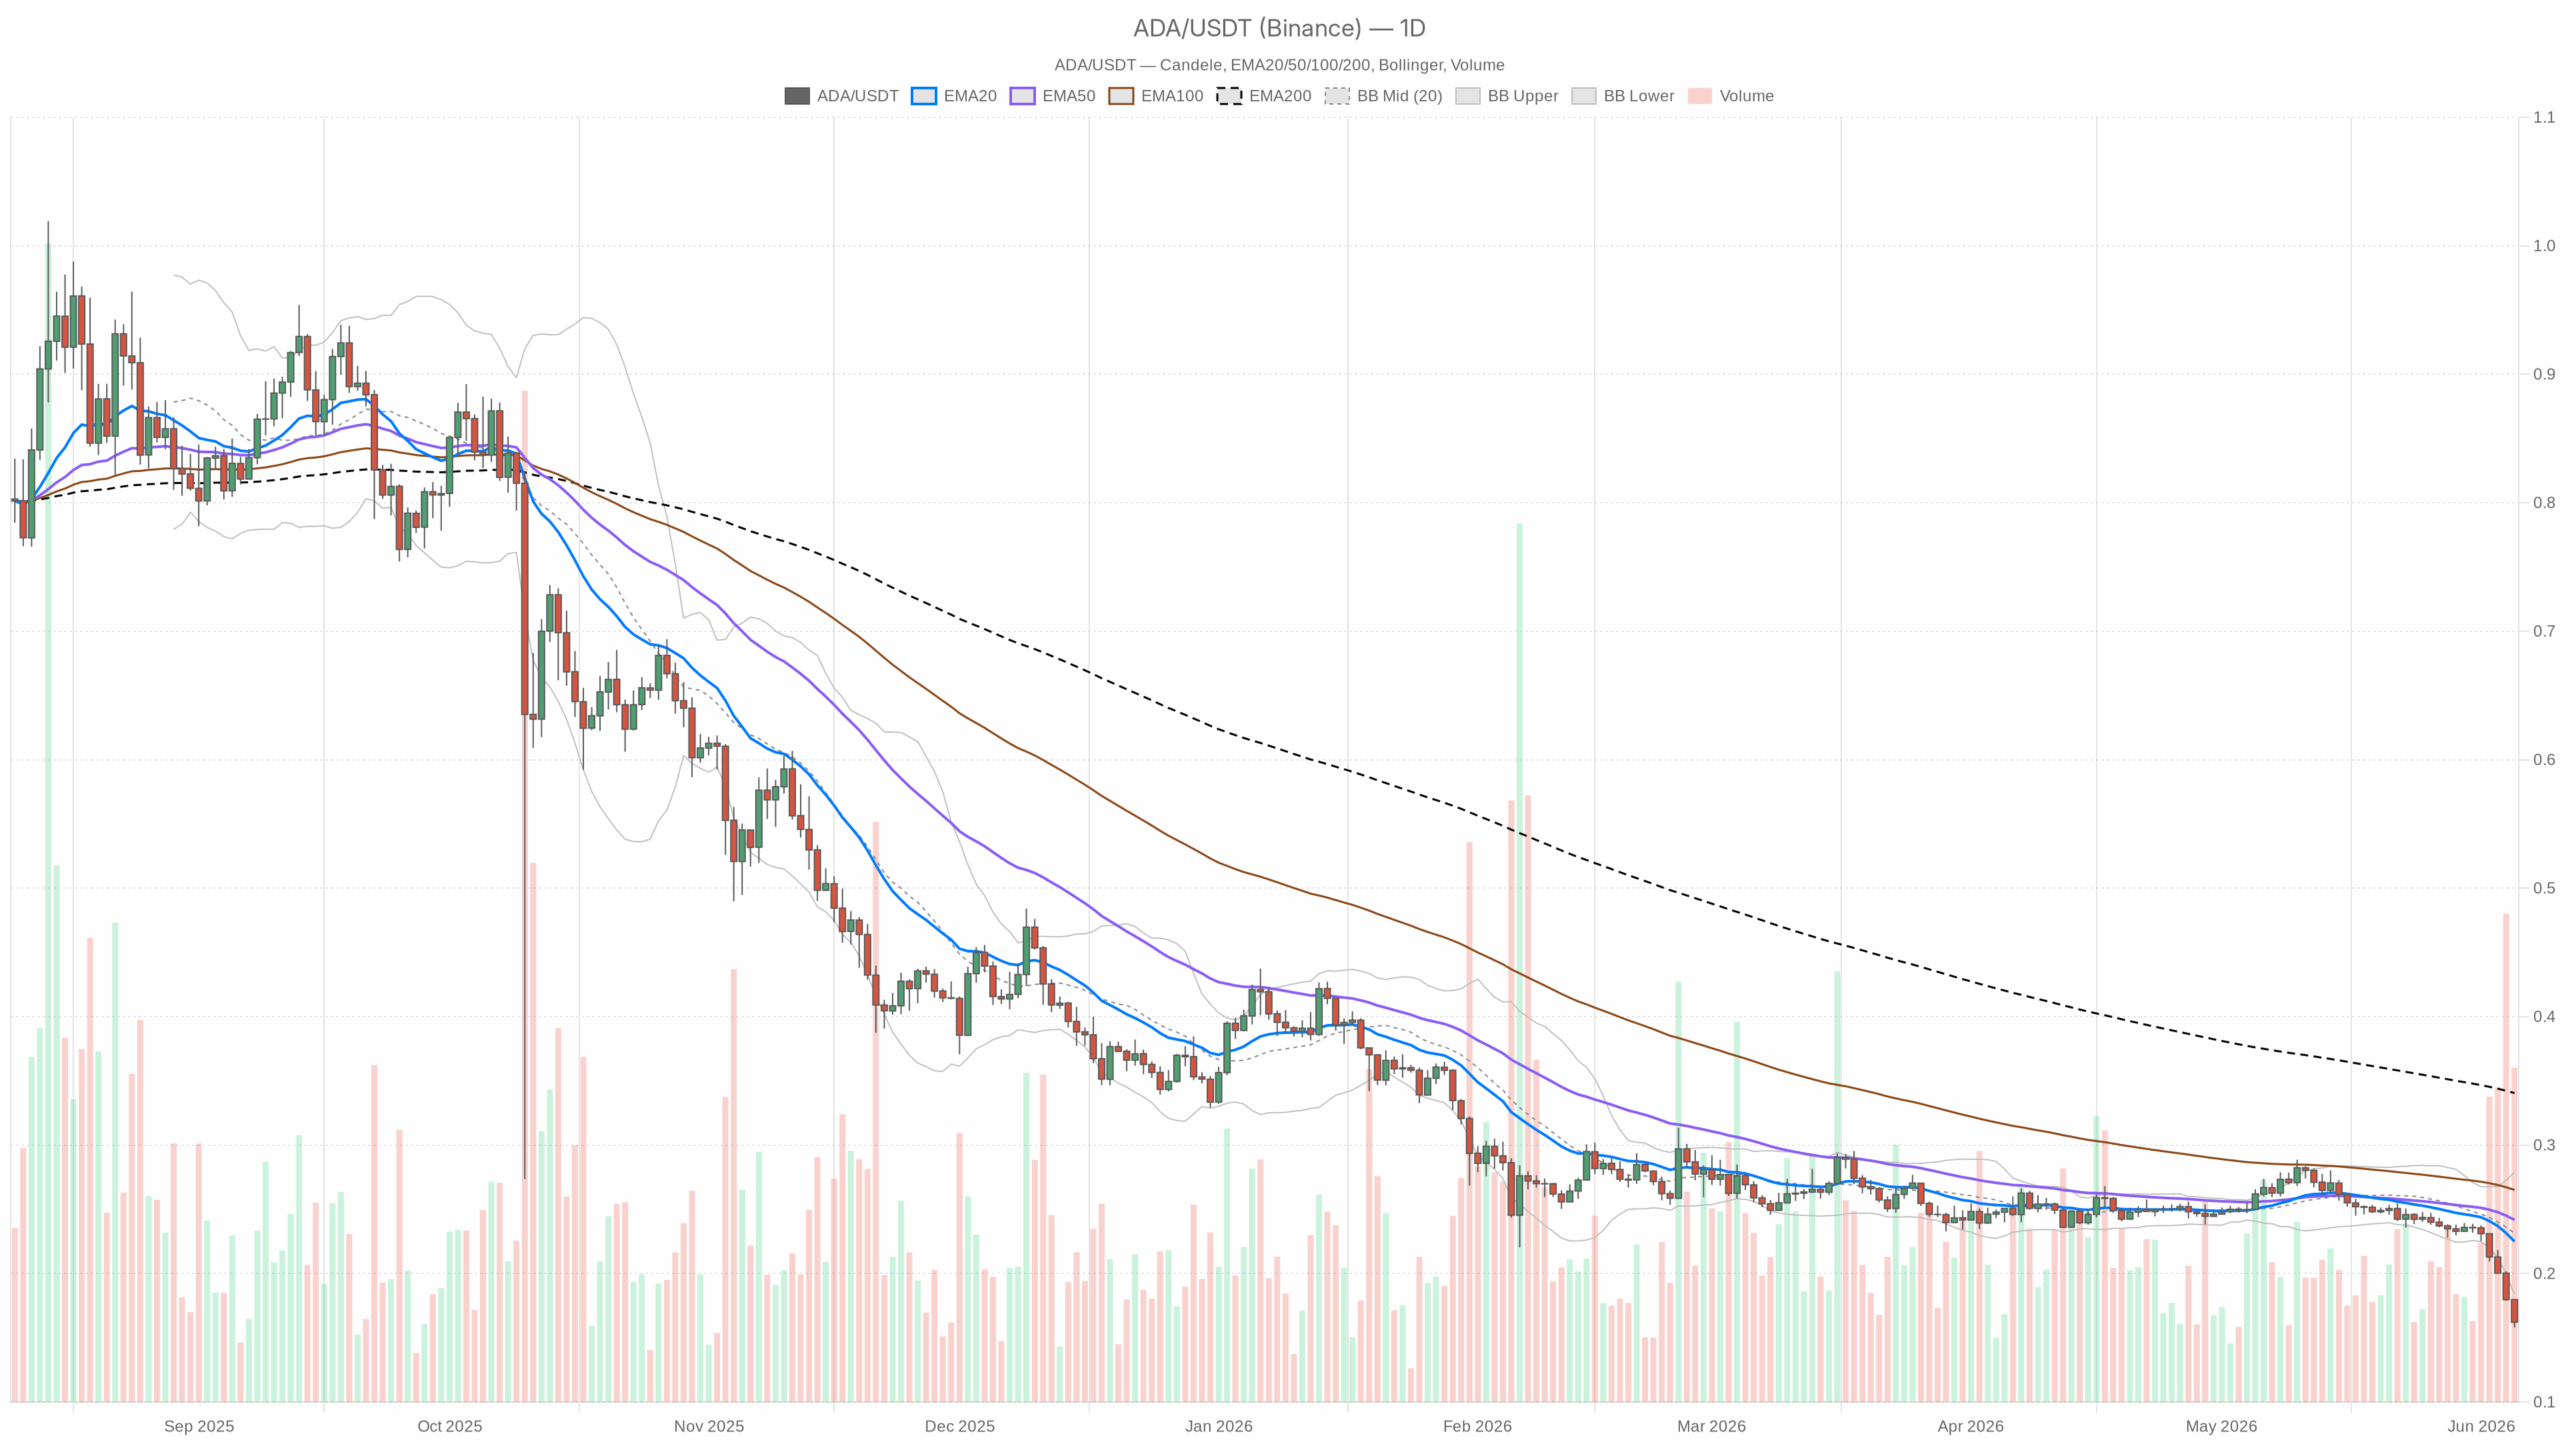
On the daily chart, the close at $0.16 confirms an extremely weak underlying structure. The exponential moving averages are far away: EMA20 at $0.23, EMA50 at $0.24 and EMA200 at $0.34. The price remains clearly below all of them, with a wide percentage gap. This is not a simple pullback, but a consolidated bearish trend, where every attempt at a rebound has been blocked by sellers. Anyone looking at the Cardano price today must consider these averages as strong technical resistances.
The 14-period daily RSI reads 12.97, a rare figure that highlights a possible exhaustion of selling pressure. Even if it does not indicate an immediate buy, historically such a low RSI signals that the bearish move may be running out of steam due to a lack of additional sellers. The risk of a short is asymmetric: there is little room left for further declines, while a technical rebound could be sudden and significant.
The daily MACD shows negative values (line at -0.02, signal at -0.01 and histogram at -0.01), confirming bearish momentum with no signs of slowing or imminent reversal.
The daily Bollinger Bands are wide, with the lower band at $0.18, the middle band at $0.23 and the upper band at $0.28. The price at $0.16 is below the lower band, a rare event that signals market stress and high volatility. Under these conditions, a move back toward the middle band is likely, although timing and form remain unpredictable.
The 14-day ATR is $0.01, indicating contained volatility despite the drop. This can mean either stabilization at current levels or a buildup of tension ahead of a sharp move. Considering the Extreme Fear, the latter hypothesis appears more likely.
The daily pivots indicate a PP at $0.17, R1 at $0.18 and S1 at $0.15. The price at $0.16 is between the pivot and support, with the $0.15–$0.16 area as a critical level. Holding here could lead to a test of the pivot at $0.17, while a break below $0.15 could trigger an acceleration toward new lows.
The intraday picture: attempt at stabilization, but without conviction
On the hourly (H1) chart, the situation improves slightly, but the narrative remains bearish. The price stays below EMA20 ($0.17), EMA50 ($0.19) and EMA200 ($0.22). The H1 RSI is at 29.45, still in oversold territory but less extreme than on the daily. The hourly MACD with a zero histogram shows slowing momentum, a possible sign of a flattening of the decline, worth monitoring.
The H1 Bollinger Bands show a lower band at $0.15, middle band at $0.18 and upper band at $0.20. The price has re-entered the channel, absorbing part of the panic from previous hours. The H1 pivots at $0.16 indicate a flat intraday market, with no directional thrust.
On the 15-minute timeframe, RSI is at 40.5, MACD is near zero, ATR is flat and Bollinger Bands are compressed between $0.16 and $0.17. This is a micro consolidation phase, with no clear trading signals. Anyone looking for an intraday entry now will find a market without defined triggers.
DeFi on Cardano: the only positive note in the picture
Despite the price crash, Cardano’s DeFi ecosystem is showing signs of growth. Minswap has a +88% increase in fees over the last 24 hours and +206% over 7 days; WingRiders records +116% daily and +404% weekly, while SundaeSwap V2 shows a monthly increase in fees of more than +5,000%.
These figures contrast the market value compression of ADA with the increase in real activity on the blockchain. Anyone looking at the Cardano token from a medium-term perspective should consider this element: an ecosystem that grows in activity while price is at lows can anticipate revaluation phases. It is not an immediate entry signal, but a crucial aspect for analysis.
Bullish scenario: possible, but conditional
For a recovery, precise conditions are needed: a stable hold of the $0.15–$0.16 area with rising volumes (not with the current compressed ATR), a daily RSI above 20 with a positive divergence versus price (new price lows but RSI with higher lows), and a move back above the pivot point at $0.17 and then above $0.18 (R1).
In this case, the first realistic target would be a test of the middle Bollinger Band at $0.23, a level that also converges with EMA20 and EMA50. The scenario is invalidated by a daily close below $0.14.
Bearish scenario: the current default
The bearish trend will continue until concrete reversal signals appear. A confirmed break of the $0.15 area could push ADA toward the recent low zone between $0.12 and $0.13. The daily MACD shows no signs of reversal, and high Bitcoin dominance with Fear & Greed at 12 penalizes altcoins.
This scenario is canceled only by a daily close above $0.18 accompanied by rising volumes.
How to read this moment on ADA
Currently, Cardano is in free fall toward extreme technical stress levels, with a daily RSI below 13, almost never seen before. Chasing further declines carries high risk, not because there is an imminent reversal, but because the risk/reward ratio for new shorts is unfavorable.
Anyone assessing where to buy Cardano must know that there are still no technical reversal signals. The market is historically oversold, while the DeFi ecosystem is accelerating unusually with the price at lows. The main risk is a false rebound: a recovery to $0.17–$0.18 could attract buyers only to then collapse below $0.15. This type of trap is typical in bear markets with panic sentiment.
Patience is not weakness, but strategy: waiting for technical confirmations, even if it means missing a few cents of potential rebound, remains the most prudent approach in a still compromised picture, despite the initial signs of exhaustion.