

Bitcoin is currently trading around $62,828, and the daily technical picture leaves little room for optimism: we are in a full bearish phase, far from all the significant moving averages. The market sentiment, indicated by the Fear & Greed Index, is in Extreme Fear at 12, a signal not to be underestimated. The current price is below the lower band of the Bollinger Bands on the daily, an area that tends to produce technical rebounds but that, in a negative trend, can turn into a trap for those who buy too hastily.
The dominant force is clearly distributive. Those who bought in recent months are at a loss, DEX volume has dropped drastically in the last 24 hours (-68.7% on global crypto volume) and the news, from the sale of Strategy to Bitcoin ETF outflows up to the competition from major IPOs, tells the story of a market looking for exits rather than entries.
Summary
The daily structure: a trend that does not forgive
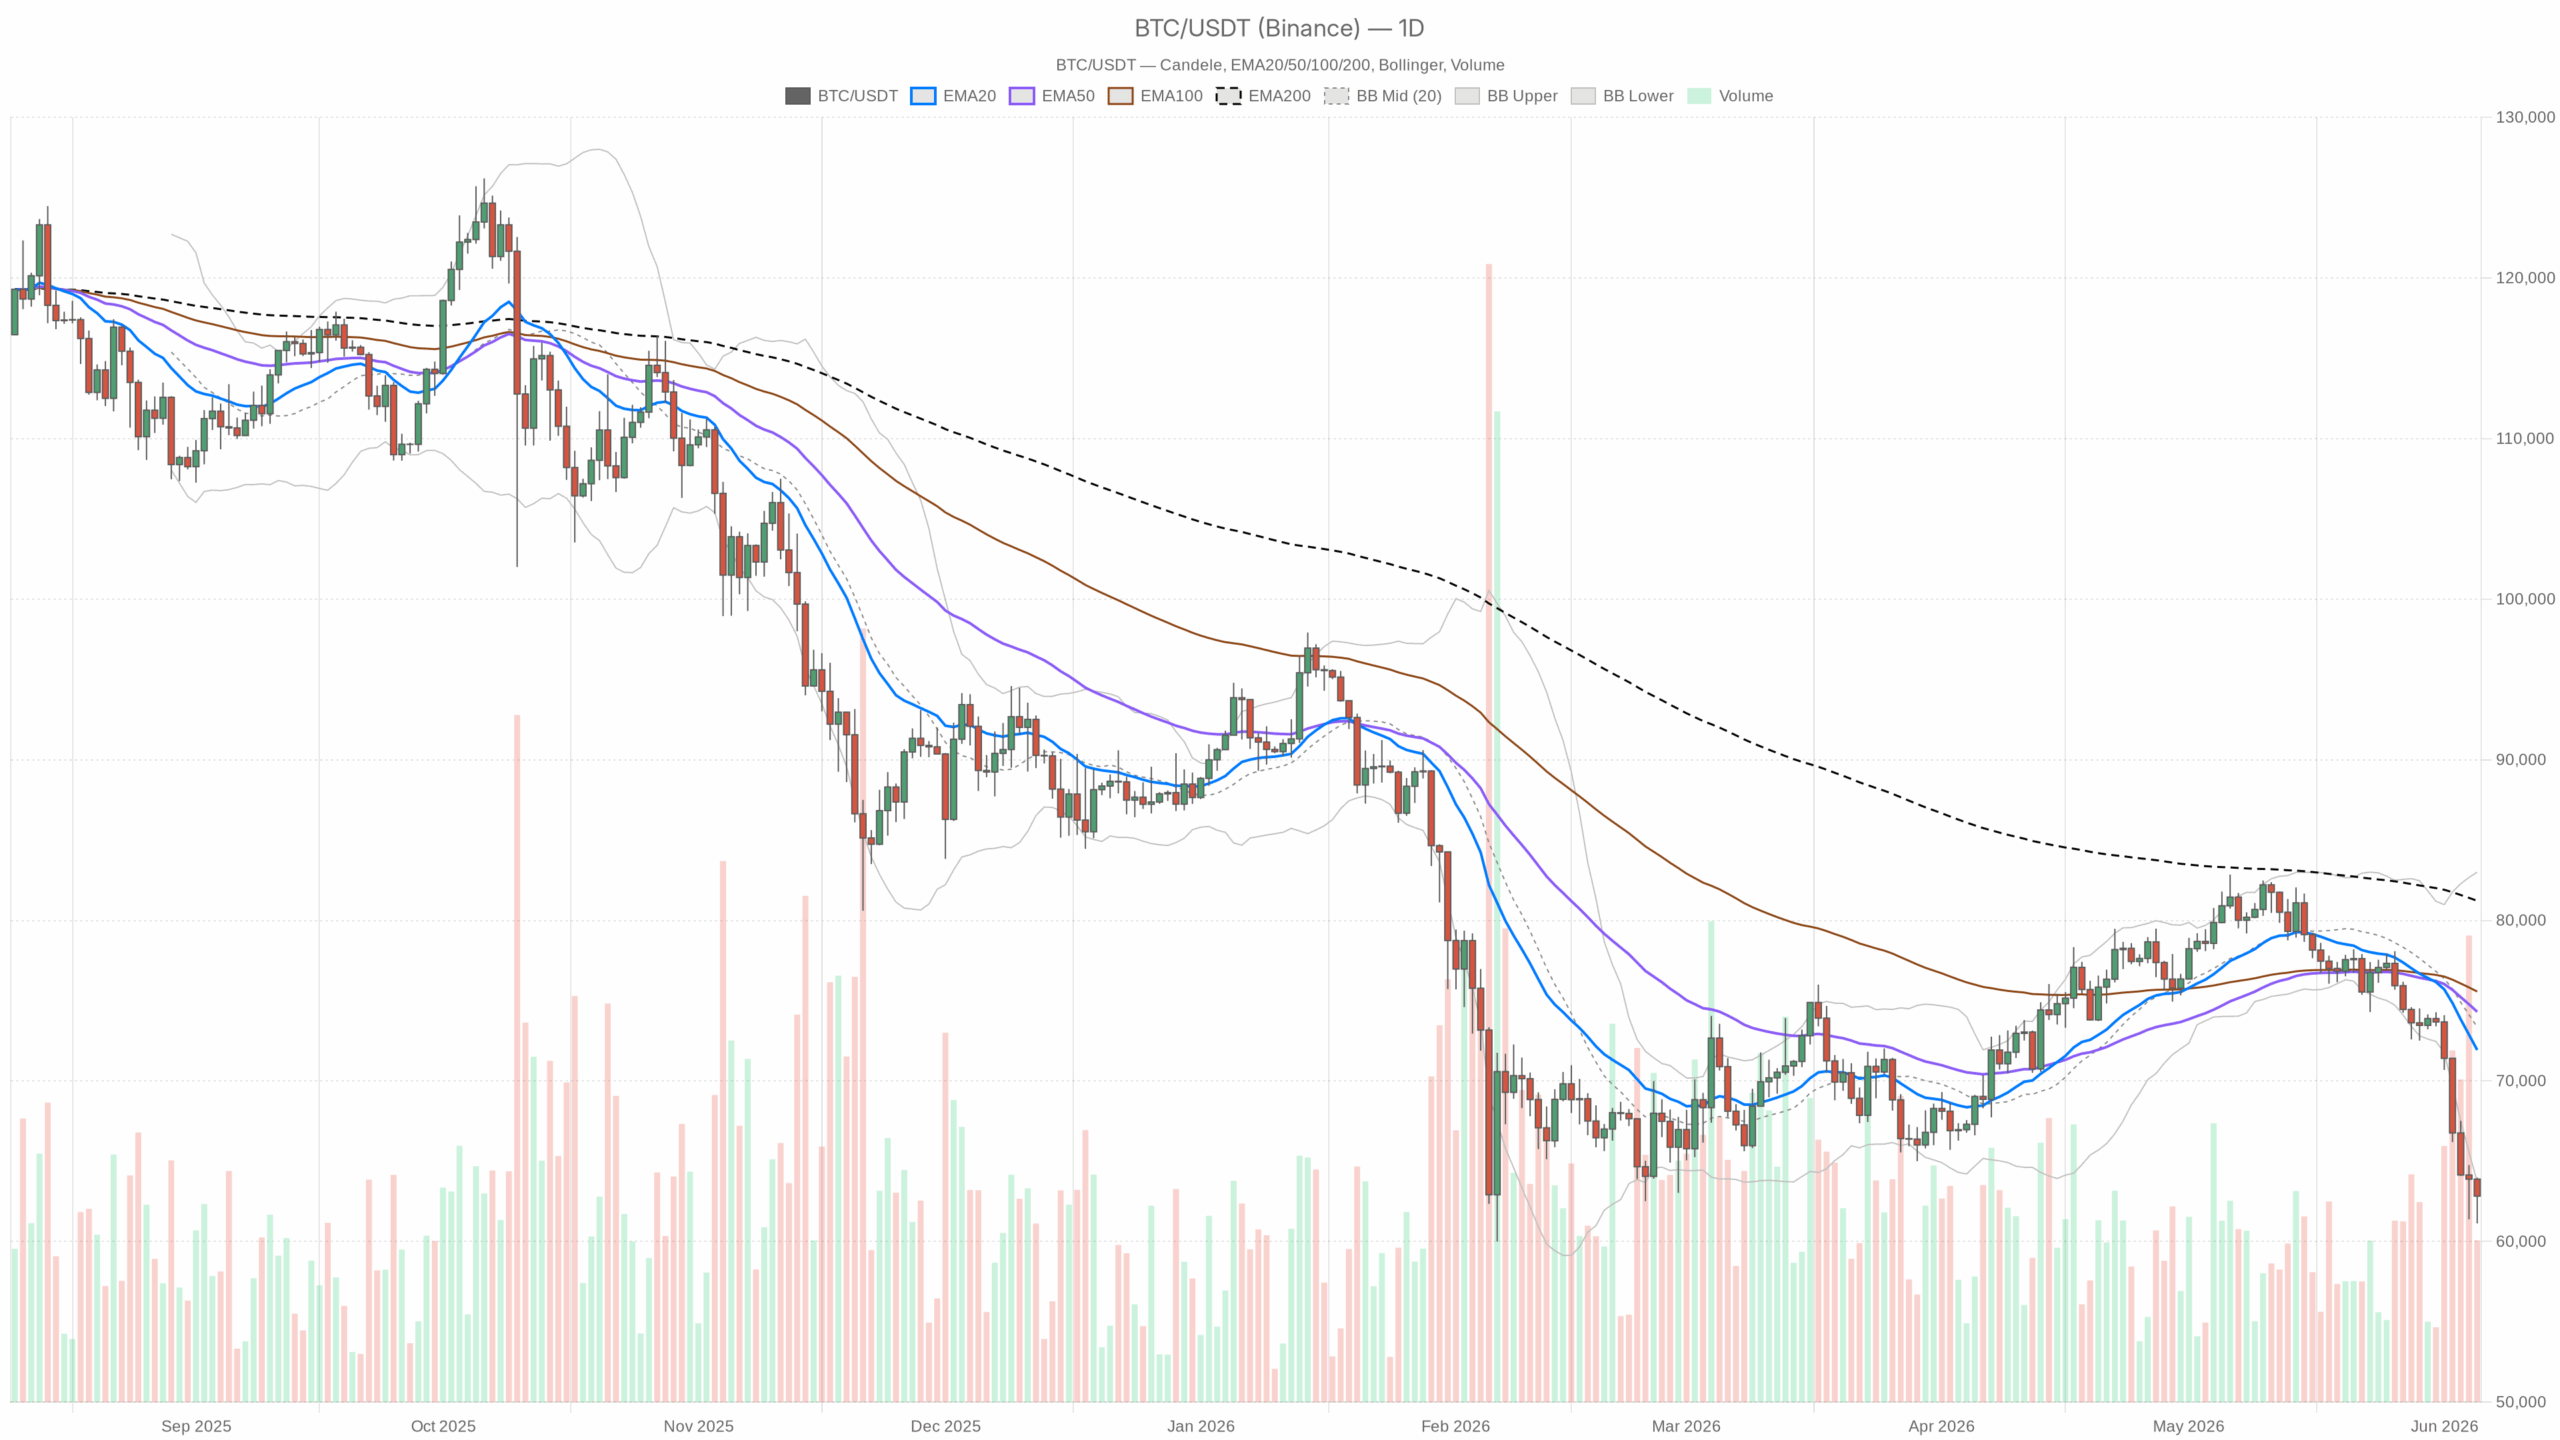
On the daily timeframe, the message is clear. The updated BTC price at $62,828 is about $9,000 below the EMA20 (at 71,924) and almost $12,000 below the EMA50 (at 74,303). The EMA200, at $81,215, seems distant as if it belonged to another market. A price so far from the averages does not indicate a temporary oversold condition, but confirms that the bearish trend has mass and structure.
The Bollinger Bands on the daily show that the lower band is at $63,718, and the price has already broken this threshold to the downside, remaining technically below the band. This type of extension usually leads to a return towards the middle band, which is located at $73,359. Such a move would mean +16%, which would require a radical change in narrative, not just a simple technical rebound.
The 14-period ATR on the daily is $2,426, indicating significant average daily volatility, which is essential to consider in risk management, especially for those who want to understand where to buy bitcoin safely today.
The daily pivots place the equilibrium point (PP) at $62,644, with resistance R1 at $64,162 and support S1 at $61,310. The price is moving within this narrow range: as long as it does not decisively break above R1, every recovery attempt must be treated with caution.
RSI and MACD: extreme signals that tell a precise story
The most striking figure on the daily is the RSI at 17.27. This is a rare level, indicating deep oversold conditions. However, such a low RSI in a bearish trend can remain depressed for a long time. It is not an automatic buy signal, but rather an indicator of a capitulating market, which can unfold in several stages. Those expecting a V-shaped rebound just because the RSI is below 20 risk bitter disappointment.
The daily MACD confirms this pressure: line at -3,355, signal at -1,942 and histogram at -1,413 show a widening negative divergence. There are no signs of a slowdown in bearish pressure, and the momentum remains strong and negative.
Hourly and 15-minute: something is moving, but is it enough?
On the 1-hour timeframe, the picture remains bearish but with some nuances. The price at $62,825 is below the EMA20 (63,250) and EMA50 (64,477), both sloping downward, confirming a bearish regime. The hourly RSI at 44.68 is neutral-negative, far from oversold or recovery signals. The only slightly positive element is the MACD on 1H: the line, while remaining below zero (-451), sees the histogram move to +7.43, suggesting a micro-rebound that should not be overestimated.
The Bollinger Bands on the hour indicate a range of $62,202–64,514, with the price positioned in the lower part. As long as it does not consistently break above the middle band at $63,358, every rise remains a technical pullback within a negative trend.
The 15-minute timeframe shows a less negative signal: neutral regime, RSI at 51.2 and MACD with histogram at +73.61, indicating a very short-term recovery attempt. The price has broken above the EMA20 at 62,660 and is approaching the EMA50 at 62,989, but this is a micro-recovery, of very little significance compared to the daily trend that has lost thousands of dollars.
The timeframes are therefore in conflict: the daily screams bearish, the 1H is neutral-negative, the 15 minutes is trying to stabilize. However, in these situations the main direction usually prevails in the medium term, and the main direction is bearish.
Bullish scenario: when and under what conditions
A credible recovery requires breaking above $64,162 (daily R1) on an hourly basis, followed by a return above the hourly EMA20 at 63,250 and then a test of $64,477. Stable consolidation above 64,500 with rising volumes could open the door to a structured rebound towards $66,000–67,000, levels where old supports are now resistances.
This scenario is invalidated if the price falls below $61,310 (daily S1) with a confirmed daily close.
Bearish scenario: the natural trajectory of the trend
The most likely path targets $61,310 as first support, then the psychological area of $59,000–60,000, a zone of historical buying. A decisive break below $61,000 with volume would pave the way for a deeper drop towards $57,000–58,000, where previous lows are located.
This bearish scenario remains valid as long as there is no sustained recovery above $65,000, currently far from the existing technical structure.
How to read this market right now
The current situation highlights a market in acute stress, with BTC dominance at 56.2%, indicative of a flight downward even from altcoins. When Bitcoin falls and dominance rises, it means the entire crypto ecosystem is suffering. Total market capitalization has lost over 2% in the last 24 hours.
Today’s bitcoin price is squeezed between fragile supports and distant resistances. Anyone operating in this context must consider the real risk of false rebounds: such a depressed RSI and a price below the lower Bollinger band produce technical recoveries of even 3–5% in a few hours, but these often fizzle out without changing the underlying structure. They are dangerous for those convinced that the worst is over.
The operational advice is maximum caution on longs, without haste and with attention to two key levels: $61,310 to the downside and $64,162 to the upside. As long as these values are not decisively broken, the market remains unstable and deciding to wait is often the most advisable strategy.