




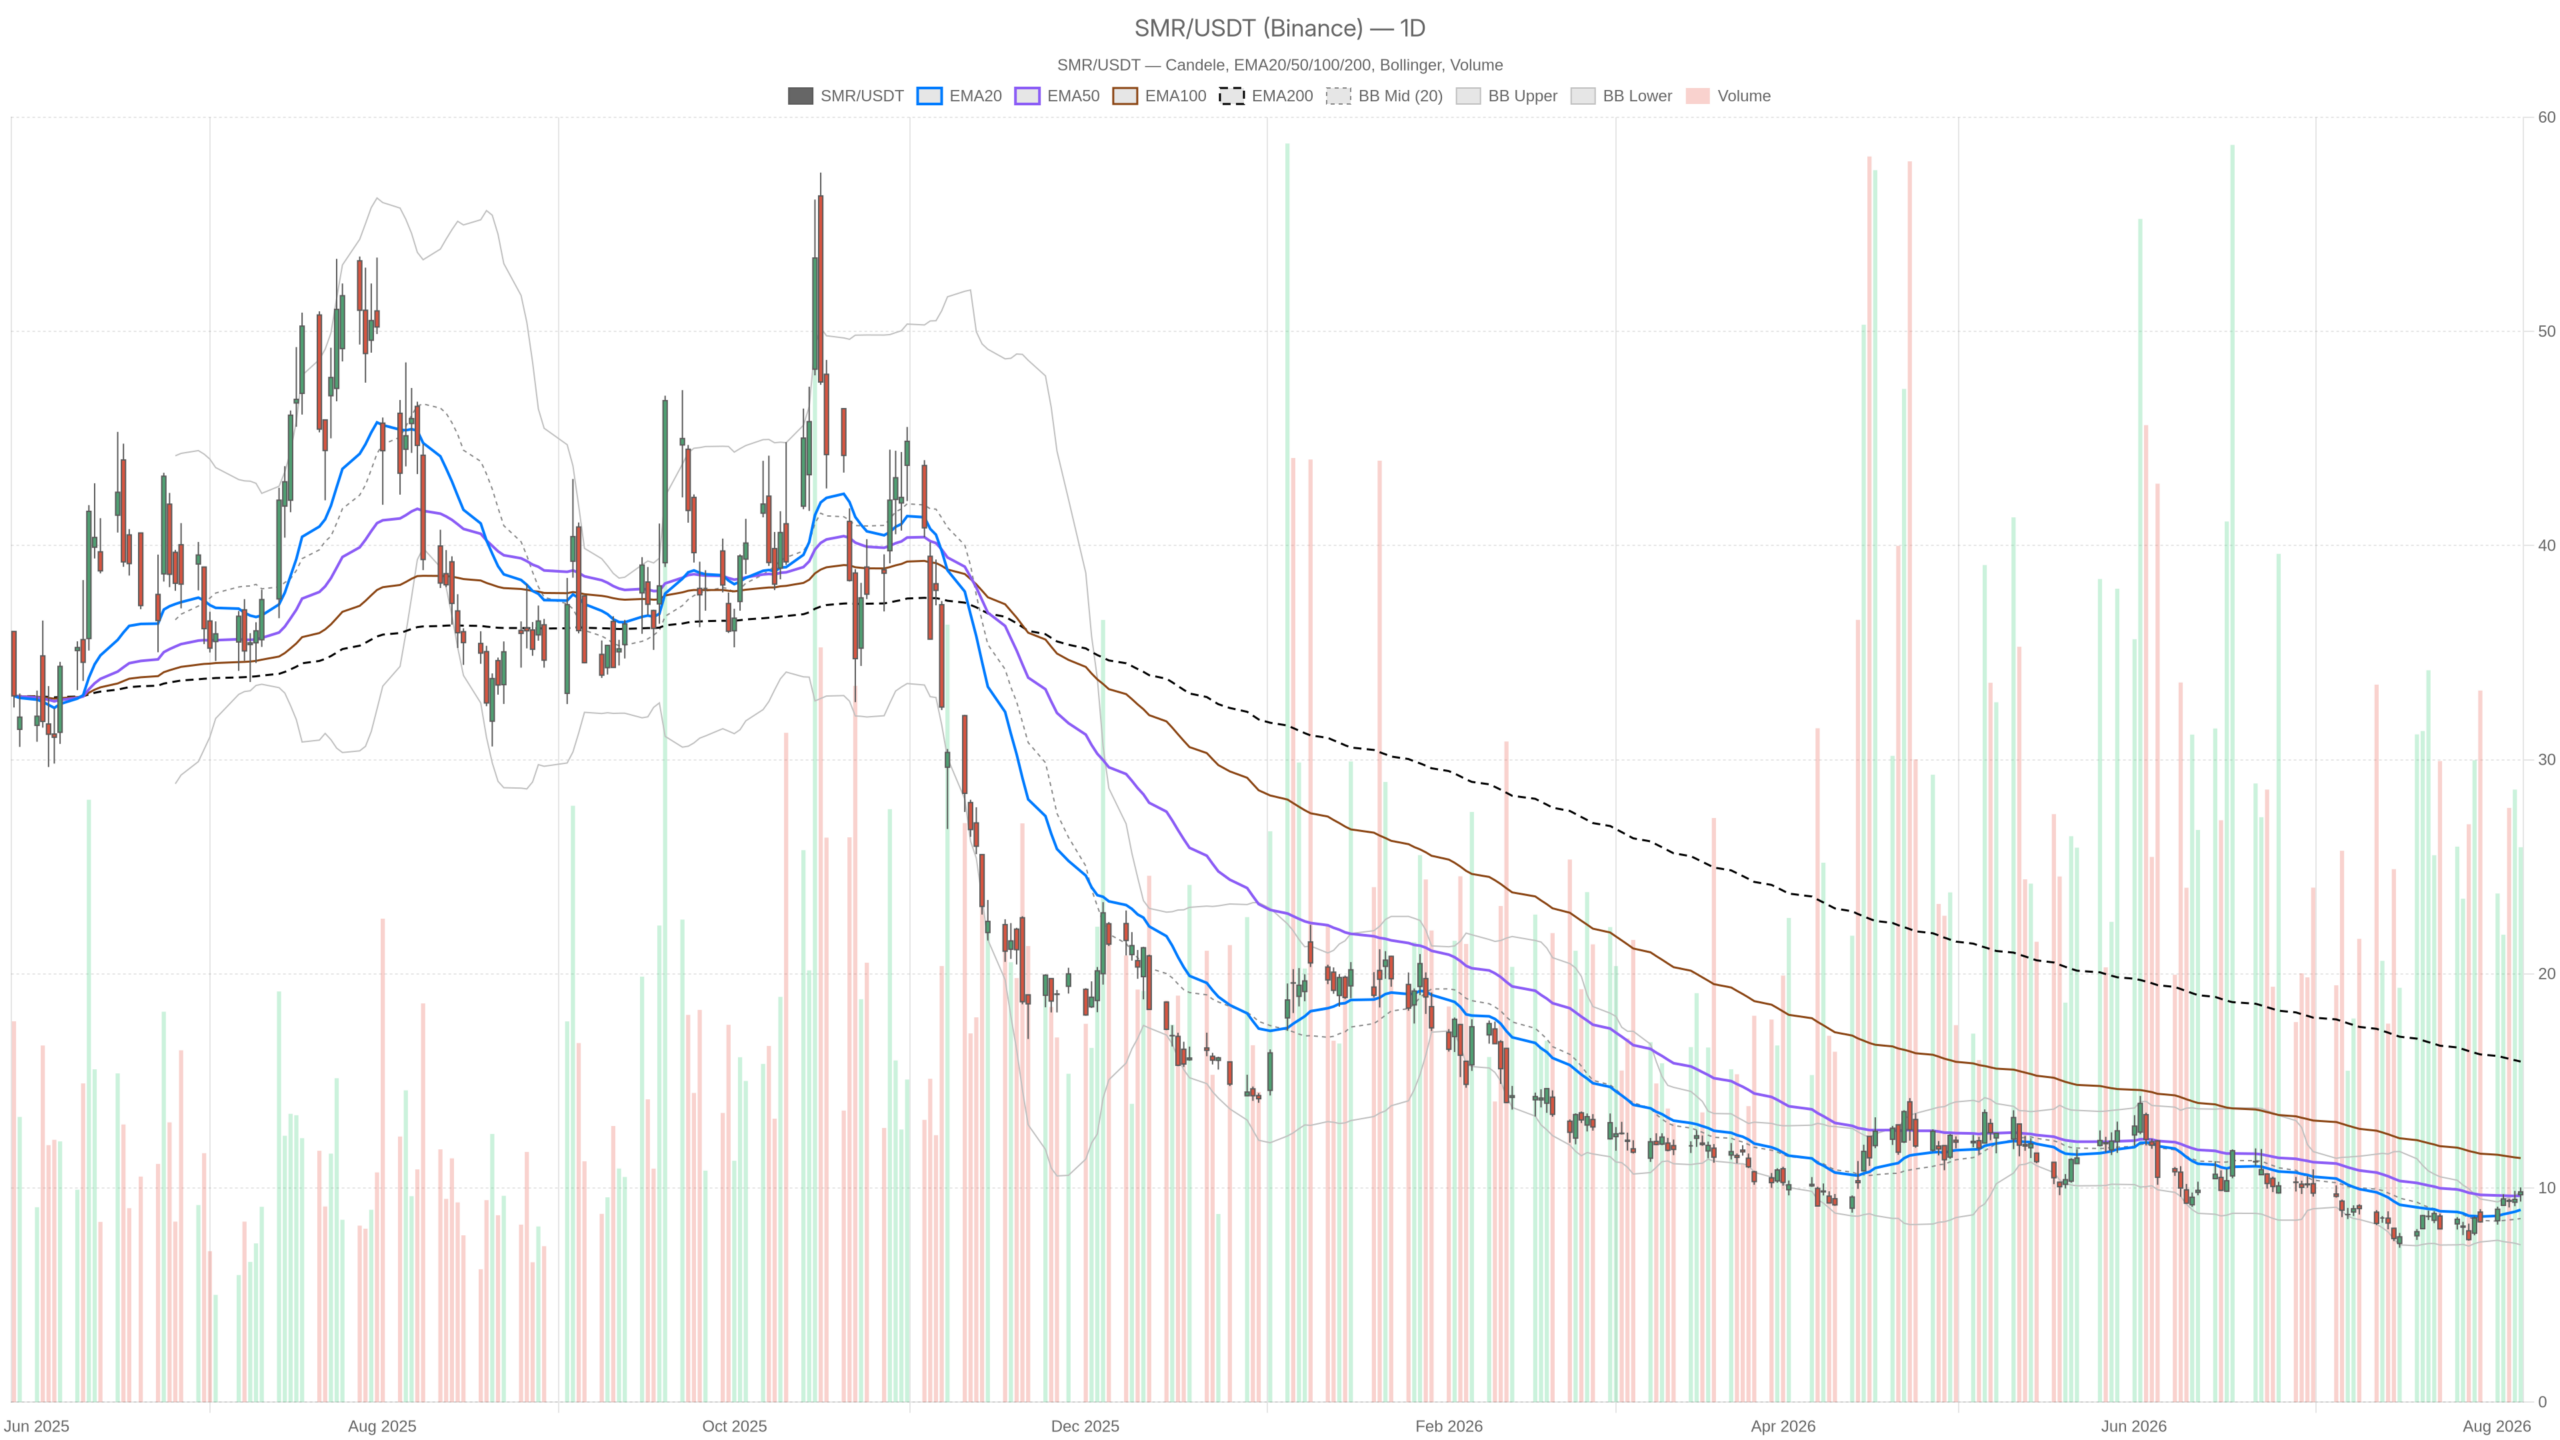
NuScale Power Corporation stock has reclaimed both its 20-day and 50-day daily averages simultaneously — a rare feat in recent months. The last session closed at $9.82 on 30.2 million shares. Yet the broader downtrend remains firmly intact, and the chart makes that distinction impossible to ignore.
Summary
Key takeaways
- SMR closed at $9.82, above the 20-day EMA ($8.98) and 50-day EMA ($9.64) — the first simultaneous reclaim in months
- Daily MACD histogram at +0.25 and RSI at 57.15 reflect early-stage recovery, not a confirmed trend
- The 200-day EMA at $15.91 sits roughly 60% above spot, keeping the structural downtrend intact
- Pivot resistance at $10.11 must be cleared on a daily close to confirm the recovery has legs
- A daily ATR of $0.69 implies ~7% swings, leaving little tolerance for imprecise risk management
Why the daily chart on NuScale Power Corporation stock is constructive but not yet trending
The daily chart places NuScale Power Corporation stock in early-stage recovery within a larger downtrend — constructive but unconfirmed. The main bias is neutral with a short-term upward tilt, as the 200-day EMA at $15.91 remains roughly 60% above spot.
The moving average stack tells the story of a gradual repair. Price at $9.82 sits above the 20-day EMA at $8.98 and above the 50-day EMA at $9.64. Reclaiming the 50-day is the more meaningful of the two. It signals that buyers have absorbed the supply that had been capping this name and are now defending higher lows.
The MACD supports that read, though carefully. The line is at -0.05 against a signal at -0.30, with the histogram at +0.25. In other words, momentum has flipped in favour of the bulls while the underlying trend measure is still marginally negative. That is textbook early-stage recovery: pressure has eased, but the trend has not yet been confirmed.
Meanwhile, RSI at 57.15 reinforces the same message. It sits above the midpoint, comfortably clear of oversold territory, and nowhere near a stretched reading. There is room to run before the daily oscillator becomes a constraint.
Volatility and pivot structure define the near-term battlefield
Volatility, however, is where the caution enters. Bollinger Bands on the daily are centred at $8.57, with the upper edge at $9.80 and the lower at $7.34. The close at $9.82 is effectively pinned to the upper band. Closes at the band edge after a strong impulse rarely extend cleanly without a pause. Either the band expands and price rides it, or the market digests back toward the mid-band.
Notably, the average true range of $0.69 puts that in context. On a sub-$10 stock, that is a daily swing of roughly 7% of price. Position sizing matters far more here than entry precision.
Meanwhile, pivot structure frames the immediate battlefield. The pivot sits at $9.74, resistance at $10.11 and support at $9.45. Notably, the session high of $10.03 stalled just under R1. That is a clean, identifiable line. A daily close above $10.11 would be the first genuine confirmation that this recovery has legs.
The 1H chart confirms the bid — and shows where it gets tired
The hourly chart is unambiguously bullish, strengthening the daily case. However, momentum indicators are approaching levels where the bid typically begins to fatigue.
Price sits above all three hourly EMAs. The 20-period is at $9.57, the 50 at $9.22 and the 200 at $9.07. The stack is properly ordered — short above medium above long. That is trend structure, not noise.
Hourly MACD is positive at 0.19 against a 0.18 signal, with a thin +0.01 histogram. The direction is right, but the impulse is flattening. At the same time, hourly RSI at 65.10 is approaching the upper end of its comfortable range. Buyers are still in control, yet they are paying progressively more for each new high.
Meanwhile, hourly Bollinger Bands run from $9.12 to $9.96 with a $9.54 midline. Price is trading in the upper half but has not broken the upper band. Hourly ATR of $0.28 suggests intraday swings remain wide enough to shake out tight stops around the $9.71 hourly support level.
Execution context from the 15m chart
On the 15-minute timeframe, the regime is still bullish, but short-term momentum is cooling. Price at $9.82 sits just below the $9.84 Bollinger midline, with the upper band at $10.02. RSI has slipped back to 53.65, and the MACD histogram has turned slightly negative at -0.02.
In contrast to the hourly, this looks like a consolidation phase. The 15-minute EMA20 at $9.78 and EMA50 at $9.65 are the levels to watch for near-term control. ATR of just $0.09 confirms compression. Tight ranges before a defined level tend to resolve with a move, not a drift.
The fundamental backdrop behind NuScale Power Corporation stock’s price action
The technical recovery in NuScale Power Corporation stock is unfolding despite a severe revenue miss. The market appears focused on commercialisation timing rather than current top-line metrics.
Q2 earnings met estimates at a 0.00% surprise. Revenue, however, missed badly — a -92.50% surprise as revenues fell 98.8% on the RoPower wind-down. On the face of it, that is a brutal top line.
Yet the market appears to be looking past it. The earnings call emphasised TVA discussions, deployment readiness, approved designs, available fuel, supplier progress and $1.9 billion in liquidity. That combination explains why the stock held its ground into and after the print. Balance-sheet strength buys time, and the story is being priced on commercialisation timing rather than current revenue.
Bullish scenario
The bullish case requires a daily close above $10.11 to confirm the recovery. This would need volume comparable to the 30.2 million shares just traded. Clearing that level would confirm a break of the daily upper band rather than a rejection from it. Support for this scenario would come from the hourly structure holding above $9.57. The daily MACD line would also need to cross into positive territory. From there, the next objective becomes closing the distance toward the 200-day EMA at $15.91 — a long journey requiring repeated higher lows.
Bearish scenario
The bearish case activates if $9.64 gives way. Losing the 50-day EMA would turn the recent reclaim into a failed breakout. Focus would shift to the $9.45 daily support. Below that, the daily mid-band at $8.57 and the 20-day EMA at $8.98 become the reference zone. On the hourly chart, a break under the $9.07 EMA200 would dismantle the bullish lower-timeframe regime entirely. The rejection at the daily upper band, combined with fading 15-minute momentum, is exactly the kind of signature that precedes such a fade.
Positioning and the uncertainty facing NuScale Power Corporation stock
The timeframes align in direction but disagree on conviction — a conflict resolved by price at $10.11 or $9.64. The daily says neutral and recovering. The hourly says bullish and slightly overextended. The 15-minute says pause. That is not a conflict to be resolved by argument.
With a daily ATR near 7% of the share price, NuScale Power Corporation stock offers little tolerance for imprecise risk management. The revenue collapse is real, and the liquidity cushion is real. The chart is caught between the two. Traders working this range should respect one fact: the stock sits far beneath its long-term average. Counter-trend recoveries are the fastest to unwind when confirmation fails to arrive.
FAQ
Is NuScale Power Corporation stock in a confirmed uptrend?
No. SMR has reclaimed both the 20-day and 50-day EMAs. However, the 200-day EMA at $15.91 sits roughly 60% above the current price. The daily MACD line remains marginally negative at -0.05. A daily close above $10.11 is still needed to confirm the recovery.
What are the key levels to watch for NuScale Power Corporation stock?
Resistance sits at $10.11 (pivot R1), which the session high of $10.03 failed to clear. Support stands at the 50-day EMA of $9.64, followed by $9.45 (daily pivot support). On the downside, losing the hourly 200 EMA at $9.07 would dismantle the bullish lower-timeframe structure entirely.
How does the fundamental picture affect SMR’s stock outlook?
Q2 revenue missed by -92.50% as the RoPower project wound down. Still, the market appears to be looking past it. The company cited TVA discussions, approved designs, available fuel, and $1.9 billion in liquidity. Balance-sheet strength buys time while the market prices commercialisation timing rather than current revenue.
Disclaimer: This article is for informational purposes only and does not constitute financial advice, an investment recommendation, or a solicitation to buy or sell any financial instrument or cryptocurrency. The analysis provided is not indicative of future results. Investing in crypto assets and financial markets carries a high risk of capital loss. Always do your own research (DYOR) and consult a qualified financial advisor before making any decision.
Article produced with the assistance of artificial intelligence and reviewed by the editorial team.
