




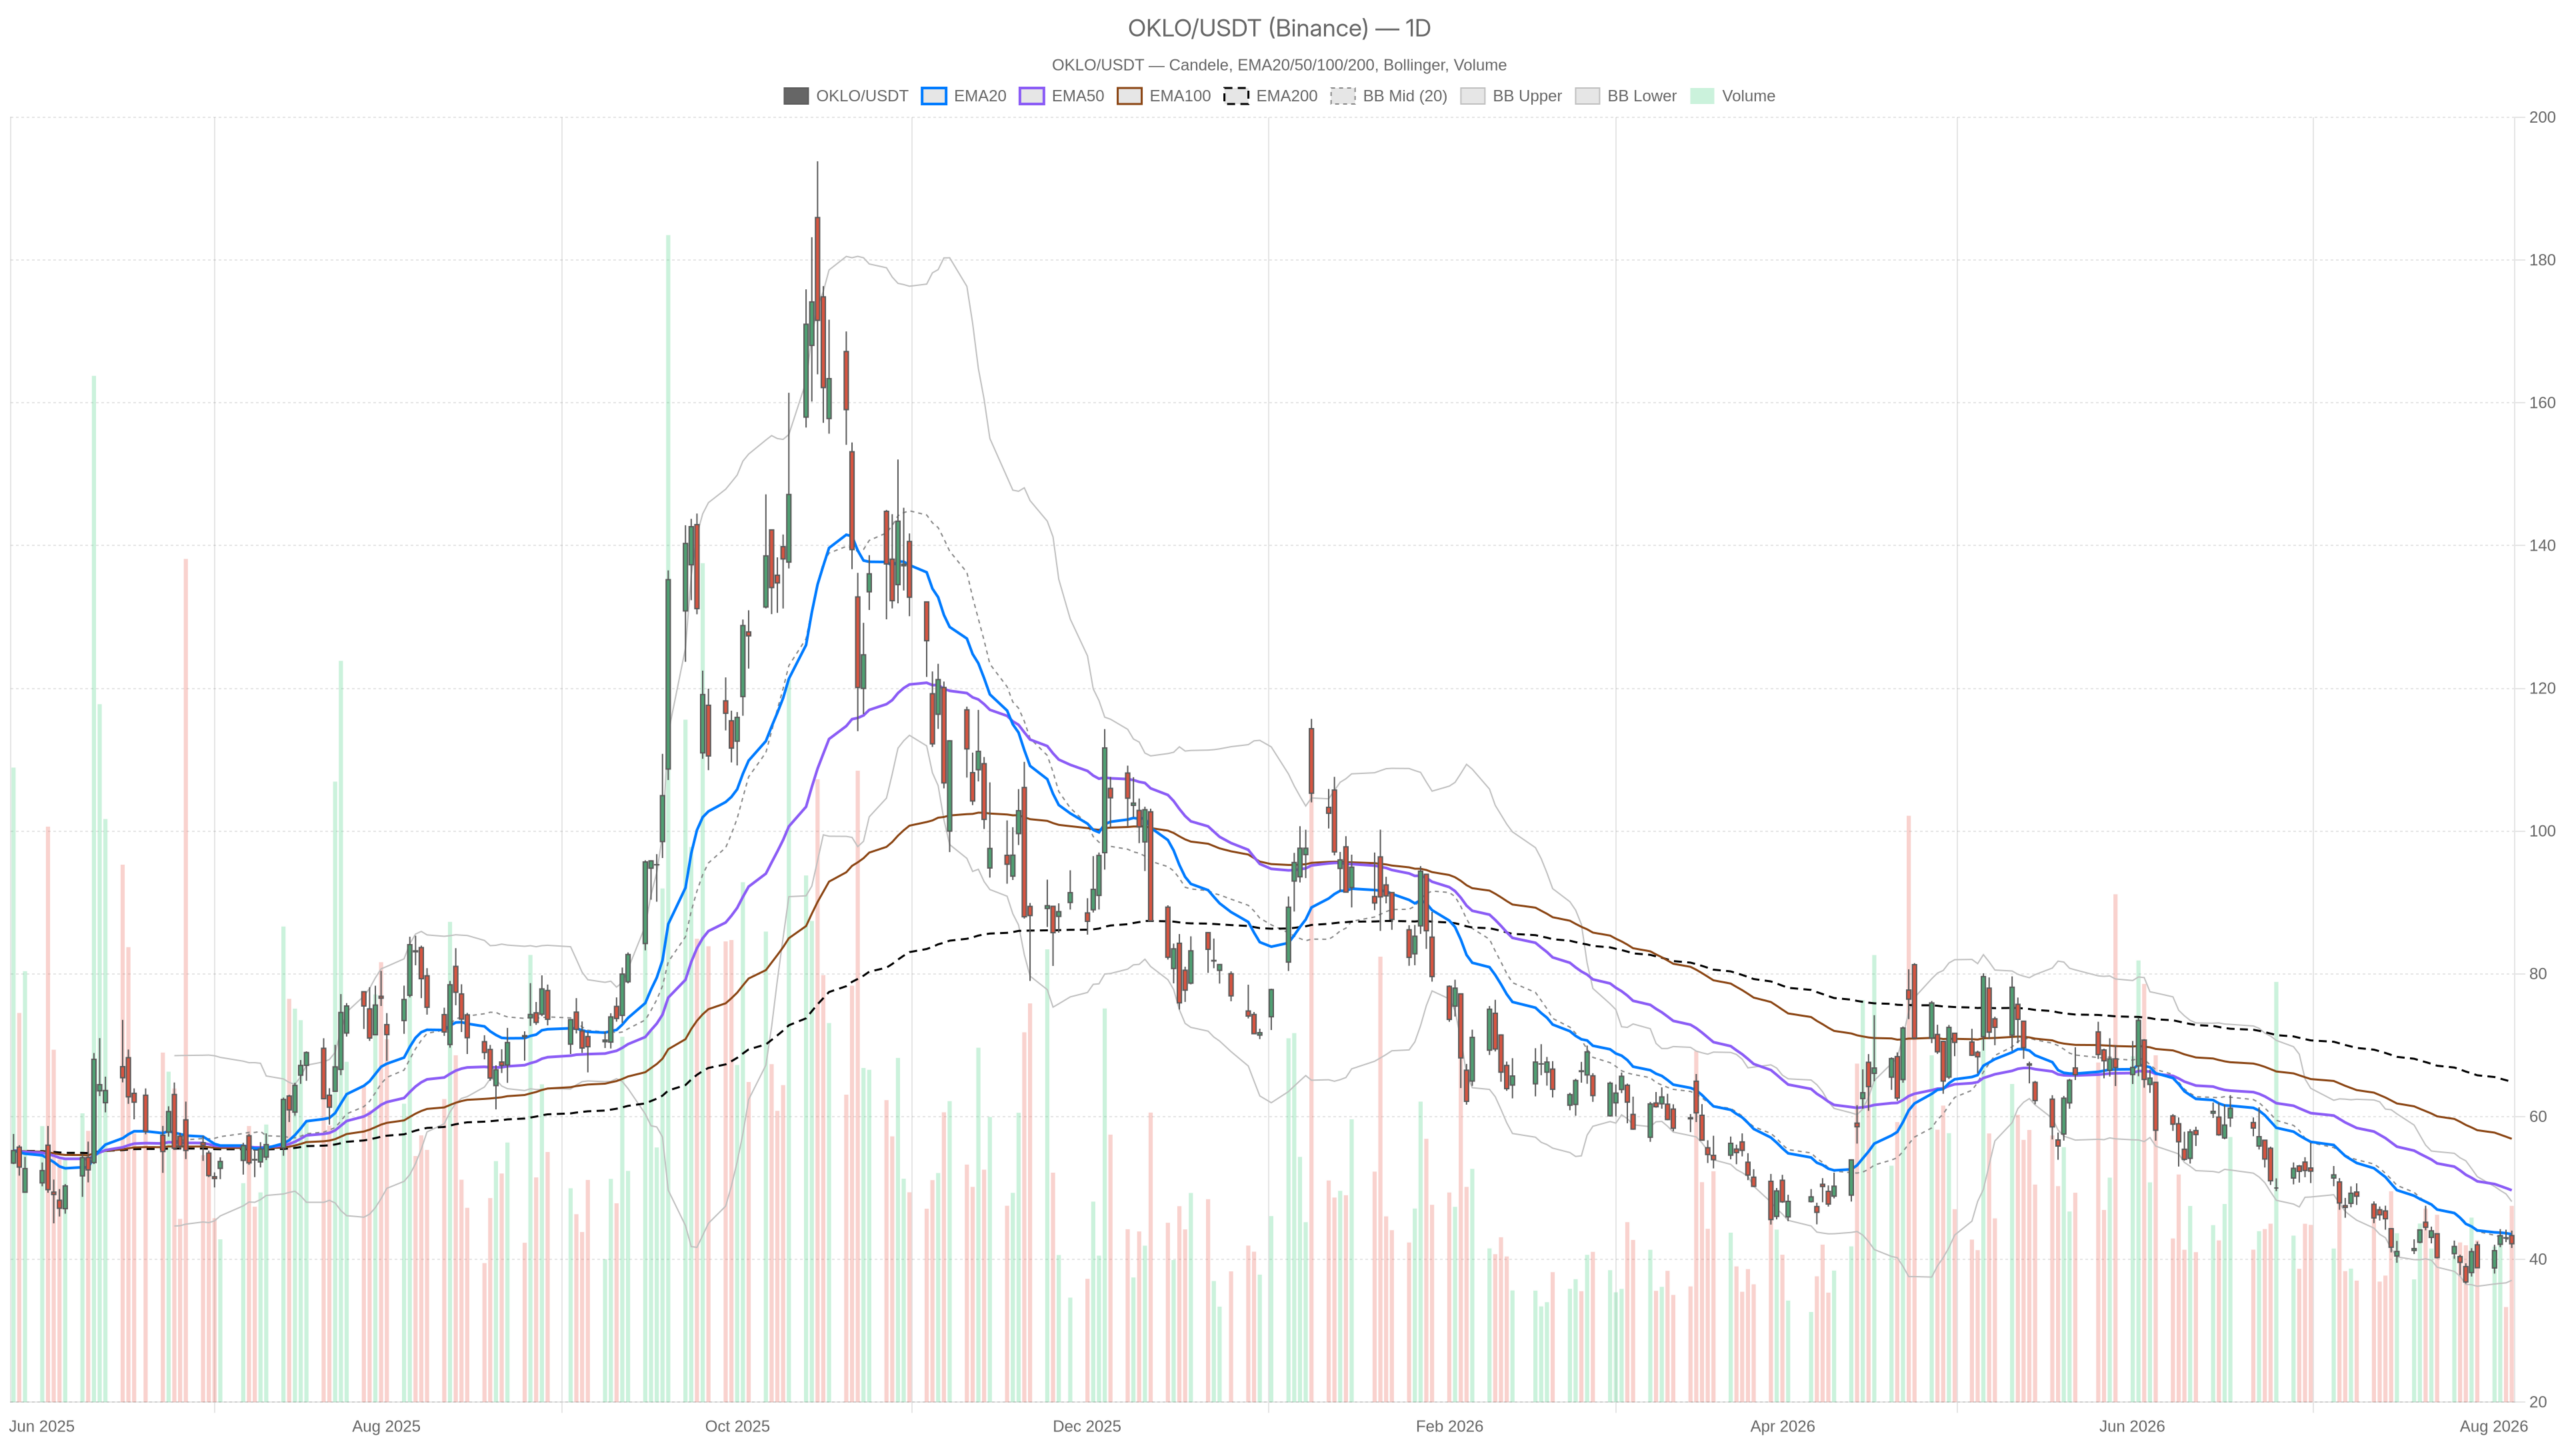
Oklo Inc. stock enters this session in an awkward place. The daily trend remains broken, yet news flow has turned constructive. On 6 August, shares closed at $42.19, trading between $41.60 and $44.03 on roughly 10.7 million shares — a market trying to stabilise, not reclaiming leadership.
Summary
Key takeaways
- Oklo Inc. stock closed at $42.19 on 6 August, with a daily range of $41.60–$44.03 on approximately 10.7 million shares.
- Price remains below the 20-day EMA at $43.53, the 50-day at $49.68, and the 200-day at $64.87 — a deeply bearish moving average stack.
- Daily RSI at 44.07 and a positive MACD histogram of 0.74 suggest the downtrend is losing intensity rather than reversing.
- Oklo’s Groves Isotope Test Reactor achieved first criticality in Lockhart, Texas, confirmed by the U.S. Energy Department — a significant credibility milestone.
- A daily ATR of $3.11 represents roughly 7% of the stock price, making volatility the dominant near-term risk.
- A daily close below $41.18 (S1) would invalidate the stabilization thesis, while a reclaim of $43.61 (R1) is needed for any bullish follow-through.
Why the Daily Chart Still Sets a Bearish Bias for Oklo Inc. Stock
The daily chart remains bearish because Oklo Inc. stock sits below all three key moving averages. The 200-day average stands more than 20 points above spot — a clear measure of accumulated damage. Price closed beneath the 20-day EMA at $43.53, the 50-day at $49.68, and the 200-day at $64.87. The spacing matters more than the levels themselves, and the reported 78% below its high fits that picture.
Momentum Indicators Signal Deceleration
Momentum, however, is no longer accelerating lower. Daily RSI at 44.07 is soft but not stressed. It has drifted back toward the midline rather than probing oversold territory. MACD tells a similar story. The line at -2.79 remains deep below zero. Yet it sits above its signal at -3.52, leaving a positive histogram of 0.74. That combination is typical of a downtrend losing intensity, not reversing.
Volatility and Pivot Context
Bollinger Bands frame the current balance well. The daily mid-band sits at 42.58, almost exactly where price closed. Meanwhile, the upper band at 48.10 and the lower at 37.07 leave an unusually wide envelope. Volatility has expanded, and the stock now oscillates around the centre of that range. Until the mid-band is decisively reclaimed, rallies remain corrective within a broader decline.
Notably, daily ATR at 3.11 is the number traders should respect most. On a 42-handle stock, that is roughly 7% of average daily range. Position sizing built for a quiet tape will not survive here. It also means daily pivot levels can be swept in a single impulse without changing the structural picture.
Those pivots are tight relative to that volatility. The daily pivot at $42.61 sits just above the close, with R1 at 43.61 and S1 at 41.18. Closing back above 42.61 would put the 20-day EMA immediately in play. In contrast, losing 41.18 reopens the path toward the lower band region near 37.
The 1H Picture Weakens the Bearish Case Without Reversing It
The hourly chart reads neutral rather than bearish. Price is balanced between the 1H 50-EMA and the 20-EMA — a profile typical of a stock attempting to build a base after a heavy markdown. Price at 42.18 sits above the 1H 50-EMA at 42.04 but below the 20-EMA at 42.59. Short-term supply and demand are close to balanced. However, the 1H 200-EMA at 45.24 is the real ceiling, lining up conceptually with the daily 20-EMA zone.
Hourly momentum is fading at the margin. RSI at 47.74 is neutral. MACD has rolled over: the line at 0.23 has slipped below its 0.47 signal, producing a -0.24 histogram. In other words, the intraday bounce that pushed the hourly MACD into positive territory is now losing traction.
Bollinger positioning on the 1H chart is instructive. Price closed at 42.18, effectively hugging the lower band at 42.08, with the mid at 43.12 and the upper at 44.16. Pressing the lower band is not automatically bullish or bearish. What matters is whether buyers defend it. With hourly ATR at 0.89, a fast 1% move in either direction is routine.
Therefore, the conflict is clear rather than hidden. The daily regime is bearish. The hourly regime is neutral. And the two disagree about the immediate next move. That is the classic profile of a stock attempting to build a base. Bases are not confirmed until proven, and this one is not proven yet.
15m Execution Context
On the 15-minute chart the tone is mildly heavy. Price at 42.18 sits below the 20-EMA at 42.46 and the 50-EMA at 42.68. Still, it remains above the 200-EMA at 42.02. RSI at 41.27 leans soft, and MACD is marginally negative at -0.24 against a -0.20 signal. The 15m ATR of 0.34 defines realistic intraday noise. Pivot support at 41.93 and resistance at 42.33 bracket a very narrow zone. The 200-EMA at 42.02 acts as the short-term line in the sand.
Notably, both the 1H and 15m pivot points cluster at 42.08. That convergence turns the low-42 area into the day’s decision point for Oklo Inc. stock.
Bullish Scenario
The bull case requires Oklo’s fundamental catalyst to find technical validation through a reclaim of the $42.61 daily pivot. Oklo announced that its Groves Isotope Test Reactor achieved first criticality in Lockhart, Texas, with the Energy Department confirming the milestone. Achieving a controlled, self-sustaining chain reaction in under a year is a credibility event for an advanced nuclear developer.
For that story to translate into price, buyers need to reclaim the 42.61 daily pivot and hold it. Above that, the objectives are R1 at 43.61 and the 20-day EMA at 43.53. These sit almost on top of each other. A sustained push through that cluster would open the 45.24 area, where the 1H 200-EMA waits. Confirmation would come from the daily MACD histogram continuing to expand and RSI pushing above 50.
At the same time, the hourly structure would need to flip. Recovering the 1H 20-EMA at 42.59 would be the first step. Turning the MACD histogram positive again would signal that intraday sellers have lost control.
Bearish Scenario
The bearish path remains the path of least resistance given the moving average stack. A break below $41.18 is needed to re-engage the full downtrend. Losing the 15m 200-EMA at 42.02 and the clustered 42.08 pivot would put 41.93 in focus. From there, daily S1 at 41.18 becomes the next objective. A daily close below 41.18 would invalidate the stabilisation thesis and re-engage the downtrend. The daily lower Bollinger band at 37.07 then becomes the measured downside reference.
The earnings event is the obvious accelerant. Coverage ahead of the Q2 report highlights that there is virtually no revenue line to assess. When valuation rests on milestones rather than cash flow, guidance language and execution updates carry disproportionate weight. Meanwhile, a stock trading 78% below its high has little tolerance for disappointment.
Any failed rally that stalls beneath 43.61 and rolls over would reinforce the bearish reading. So would a rejection at the daily mid-band, which would confirm 42.58 as resistance rather than support.
Positioning and Uncertainty
Oklo Inc. stock presents a mixed tape with a bearish structural backbone. The daily chart signals a downtrend with decaying momentum. The hourly and 15-minute charts, in contrast, reflect indecision inside a tight range. Neither reading is strong enough to dominate the other right now.
Volatility is the dominant risk factor. A daily ATR of 3.11 dwarfs an intraday decision zone barely a quarter of a point wide. Stops placed on 15-minute logic will be tested by daily-scale swings. The earnings release compounds that asymmetry. Until price reclaims 43.61 or breaks 41.18 on a closing basis, the honest conclusion is clear: the market has not decided on Oklo Inc. stock, and neither should traders.
FAQ
Is Oklo Inc. stock currently in a bearish trend?
Yes. The stock trades below the 20-day EMA at $43.53, the 50-day at $49.68, and the 200-day at $64.87. However, daily RSI at 44.07 and a flattening MACD histogram suggest the downtrend is losing momentum rather than accelerating lower.
What does Oklo’s reactor achieving first criticality mean for the stock?
First criticality — a controlled, self-sustaining chain reaction — is a credibility milestone for an advanced nuclear developer. Oklo achieved it at the Groves Isotope Test Reactor in Lockhart, Texas, in under a year, with Energy Department confirmation. However, with earnings approaching and minimal revenue to assess, milestone-based valuation carries significant uncertainty.
What are the key levels to watch for Oklo Inc. stock?
Support sits at $41.18 (daily S1), with the clustered pivot zone near $42.08 acting as the near-term line in the sand. Resistance begins at $42.61 (daily pivot), extends to the $43.53–$43.61 zone (20-day EMA and R1), and the 1H 200-EMA at $45.24 represents the next structural ceiling.
How does the upcoming earnings report affect the outlook?
With virtually no revenue line to assess, guidance language and execution updates carry disproportionate weight. A stock trading 78% below its high has limited tolerance for disappointment, making the earnings event a potential accelerant in either direction.
Disclaimer: This article is for informational purposes only and does not constitute financial advice, an investment recommendation, or a solicitation to buy or sell any financial instrument or cryptocurrency. The analysis provided is not indicative of future results. Investing in crypto assets and financial markets carries a high risk of capital loss. Always do your own research (DYOR) and consult a qualified financial advisor before making any decision.
Article produced with the assistance of artificial intelligence and reviewed by the editorial team.
