




Rubrik stock enters the session with a split personality. Technically, the chart is bullish across every timeframe. Yet shares reportedly tumbled after-hours following Thursday’s Q2 report despite a raised outlook. That contrast is the tension traders must weigh.
Summary
Key takeaways
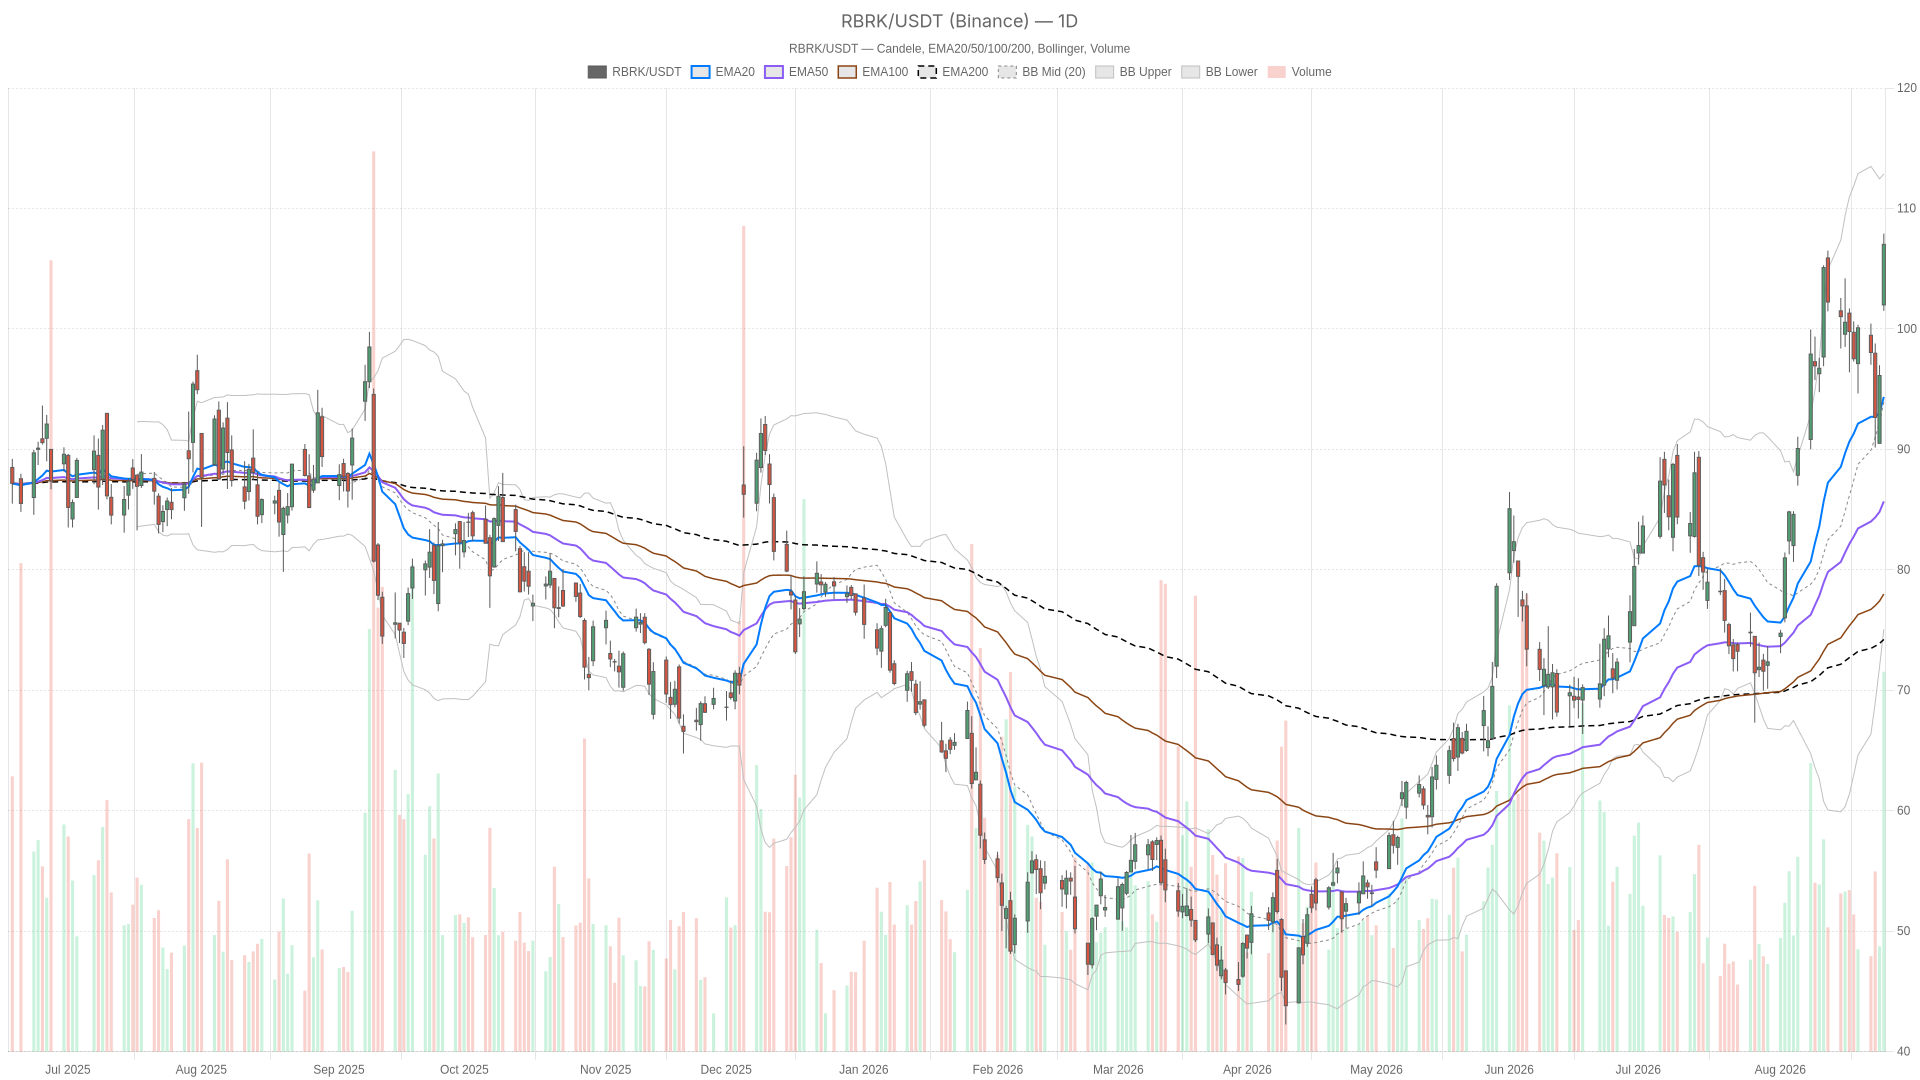
- RBRK closed at 107.02 on the daily chart, above stacked bullish EMAs (EMA20 94.36, EMA50 85.68, EMA200 74.22).
- Daily RSI14 sits at 67.63, while the 1H RSI14 is overbought at 73.99.
- Q2 FY2027 subscription ARR reached $1.66B, with free cash flow of $66M and raised full-year guidance.
- Rosenblatt raised its price target on Rubrik citing cyber resilience demand.
- Despite the raised outlook, RBRK shares reportedly tumbled in after-hours trading.
Rubrik Stock Technical Picture: Daily Trend Still Points Higher
The daily chart shows Rubrik stock in a firm uptrend. RBRK closed at 107.02, up sharply from an open of 101.99. Price sits well above the EMA20 (94.36), EMA50 (85.68), and EMA200 (74.22). That stacked EMA alignment is a textbook bullish structure. It confirms the broader trend has been intact for some time, not just a one-day spike.
Momentum Check
Daily RSI14 reads 67.63. That is strong momentum, but not yet overbought. There is still room before the indicator flags exhaustion. However, the daily MACD tells a slightly different story. The MACD line sits at 5.38 versus a signal of 5.39, producing a histogram of -0.01. That is essentially flat, hinting at a subtle stall in momentum even as price keeps pushing higher. It is not a reversal signal on its own. Still, it is worth watching closely over the next sessions.
Volatility and Key Levels
Meanwhile, the daily Bollinger Bands frame the move well. With the mid-band at 93.96 and the upper band at 112.86, price at 107.02 is running hot but has not tagged the ceiling. That leaves room for further upside before volatility bands become a constraint. Daily ATR14 stands at 6.04, an elevated reading that confirms large single-session swings are possible. Key daily levels are the pivot at 105.48, resistance at 109.45, and support at 103.04.
Rubrik Stock 1H Chart: Confirms the Trend, But Flags Overheating
The 1-hour chart confirms the daily bullish bias. Meanwhile, its RSI signals that the move is overstretched. EMA20 (101.08), EMA50 (99.15), and EMA200 (91.59) are stacked bullishly, and the regime reads bullish. MACD on this timeframe is more convincing than on the daily. The MACD line at 2.58 sits well above the signal at 1.26, with a healthy positive histogram of 1.32. That is a cleaner bullish momentum signal.
At the same time, RSI14 on the 1H sits at 73.99. That is firmly overbought. It does not invalidate the trend, but it raises the odds of a short-term pause or pullback before the next leg higher. In other words, the 1H confirms the daily uptrend structurally while warning that the move may be stretched. Price at 107.10 is also pressing toward the 1H Bollinger upper band at 110.17, reinforcing a sense of a market running ahead of itself.
15-Minute View: Short-Term Cooling Near Resistance
The 15-minute chart shows the first signs of cooling. The immediate push is losing steam near resistance. RSI14 has eased to 68.67 from the more extreme 1H reading. Meanwhile, the MACD has flipped negative, with the line at 1.65 below the signal at 1.96 for a histogram of -0.30. That is a short-term bearish crossover. It appears right at the 15m pivot resistance of 107.67 and the Bollinger upper band of 107.86.
This does not contradict the larger bullish case. Instead, it simply reflects normal digestion after a sharp advance. The EMA structure on the 15m chart (EMA20 105.73, EMA50 102.44, EMA200 99.36) remains bullish. Therefore, this looks more like consolidation than a trend change. Traders using this timeframe for execution should treat it as a timing tool, not a directional signal.
Rubrik Stock News Conflict: Strong Guidance, Weak Reaction
The fundamental picture is constructive. Yet the after-hours reaction reportedly turned negative. Rubrik’s Q2 FY2027 results showed subscription ARR at $1.66B and free cash flow of $66M. The company also raised its full-year outlook to $1.88B-$1.885B in subscription ARR and $323M-$333M in free cash flow. On paper, that is a constructive set of numbers. Notably, Rosenblatt also raised its price target on Rubrik citing cyber resilience demand.
However, reporting indicates RBRK shares tumbled in after-hours trading despite those strong results and guidance. That is a classic sell-the-news pattern. It matters because the technical readings above are based on the regular session close, before that after-hours move played out. Therefore, there is a real risk that the next cash session opens under pressure. That would test whether the daily uptrend can absorb a fundamentally driven gap.
Bullish Scenario
The bullish case holds if RBRK defends its daily EMA20 and reclaims the first resistance. The stock needs to defend the EMA20 at 94.36 and keep price above the daily pivot at 105.48. A recovery through the daily R1 at 109.45 would open the path toward the upper Bollinger Band near 112.86. Continued strength in subscription ARR guidance and further analyst target increases, such as Rosenblatt’s move, would support that continuation. That would also help absorb any near-term after-hours weakness.
Bearish Scenario
The bearish case activates if after-hours selling breaks the first support level. On the other hand, if that selling pressure carries into the regular session, a break below the daily S1 at 103.04 would be the first warning sign. A daily MACD histogram that turns decisively negative, building on the current -0.01 reading, would confirm a genuine momentum shift rather than a pause. In that case, the EMA20 at 94.36 becomes the next meaningful test. A break there would put the broader uptrend in question.
Closing Take
Overall, Rubrik stock remains technically bullish, but the post-earnings reaction adds near-term risk. The trend structure, EMA alignment, and hourly MACD all point the same direction across the daily, 1H, and 15m timeframes. Meanwhile, an overbought 1H RSI near 74 and a stalling daily MACD histogram suggest the move is due for some digestion. The bigger uncertainty comes from outside the chart: a reported after-hours drop despite raised guidance and a bullish analyst target increase. That disconnect, combined with an elevated daily ATR of 6.04, argues for caution around position sizing. It also calls for close attention to how price behaves around the daily pivot and support levels.
FAQ
Why did Rubrik stock fall after-hours despite strong Q2 results?
Reporting indicates RBRK shares tumbled in after-hours trading even after the company reported Q2 FY2027 subscription ARR of $1.66B and raised its full-year outlook. That pattern resembles a classic sell-the-news reaction, where strong guidance was already reflected in price.
What are the key levels to watch for Rubrik stock?
On the daily chart, the pivot is 105.48, with resistance at 109.45 and support at 103.04. Below that, the daily EMA20 at 94.36 is the next meaningful test. The upper Bollinger Band near 112.86 marks a further upside reference.
Is the bullish trend in Rubrik stock still intact?
Yes. RBRK closed at 107.02, above the stacked daily EMAs (EMA20 94.36, EMA50 85.68, EMA200 74.22). The 1H and 15m EMA structures also remain bullish. However, the 1H RSI at 73.99 and a flat daily MACD histogram signal a possible short-term pause.
Disclaimer: This article is for informational purposes only and does not constitute financial advice, an investment recommendation, or a solicitation to buy or sell any financial instrument or cryptocurrency. The analysis provided is not indicative of future results. Investing in crypto assets and financial markets carries a high risk of capital loss. Always do your own research (DYOR) and consult a qualified financial advisor before making any decision.
Article produced with the assistance of artificial intelligence and reviewed by the editorial team.
