




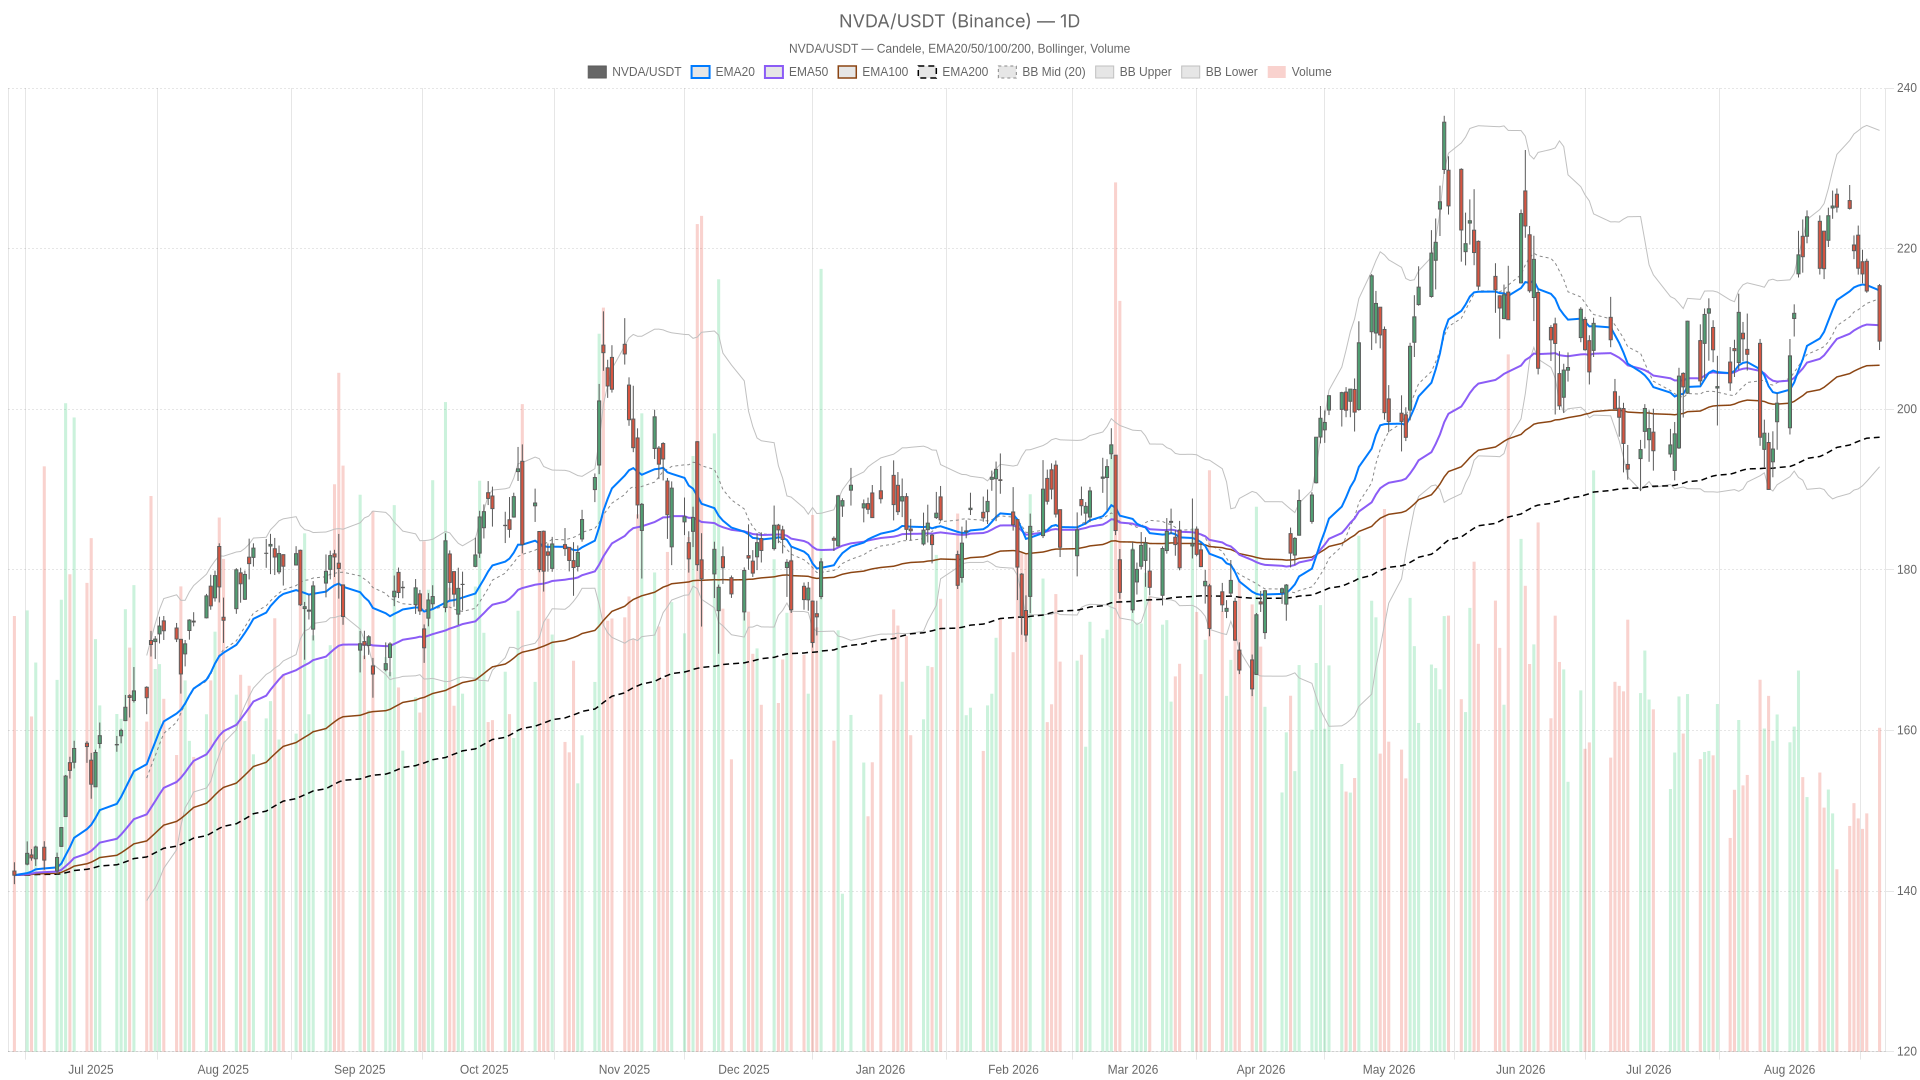
Nvidia stock enters its Q2 2027 earnings report on a defensive note, with momentum fading even as the broader uptrend survives. NVDA closed at $208.48 on August 24, sliding from a $215.38 open to a $207.37 low. Sellers control the immediate narrative into this binary event.
Summary
Key takeaways
- NVDA closed at $208.48 on August 24, below its 20-day EMA of $214.79 and its 50-day EMA of $210.46.
- The daily trend still holds above the 200-day EMA at $196.51, keeping the longer-term uptrend intact.
- Daily RSI14 at 44.65 and a MACD histogram of -1.13 confirm that short-term momentum has faded.
- The hourly chart shows a fully bearish EMA stack, with RSI14 at 26.89 in oversold territory.
- Daily ATR14 of 5.88 points to elevated volatility heading into the Q2 2027 earnings report.
Daily Structure: Uptrend Intact, But Momentum Has Turned
Nvidia stock still holds its long-term uptrend on the daily chart, but short-term momentum has turned defensive. Price trades below the 20-day EMA of $214.79 and the 50-day EMA of $210.46. It still sits well above the 200-day EMA at $196.51. This is a textbook sign of a long-term uptrend that has lost its short-term thrust. The bigger trend has not broken, but the recent leg lower shows distribution rather than accumulation.
The daily RSI14 at 44.65 sits below the neutral 50 line, confirming that momentum has faded rather than reversed. Meanwhile, the MACD tells a more pointed story. The line at 2.65 remains below the signal at 3.77, producing a negative histogram of -1.13. That bearish gap is widening, which usually means the recent decline still has room to run before momentum stabilizes.
On the daily chart, Bollinger Bands show price near the mid-band of $213.78. The upper band sits at $234.72 and the lower band at $192.83. Price is not stretched in either direction, so this is not a volatility extreme yet. Instead, it is a market searching for direction with unusually wide bands ahead of the print. The daily ATR14 of 5.88 confirms that daily ranges have expanded. That is exactly what to expect two sessions before a major earnings release.
Pivot levels reinforce the cautious read. The daily pivot sits at $210.48, with price trading below it. Price is closer to the S1 support at $205.37 than the R1 resistance at $213.59. Overall, the daily regime is classified as neutral, but internal evidence leans mildly bearish into the report.
1H Timeframe: Confirmation, Not Contradiction
The hourly chart confirms the daily caution and sharpens the bearish tilt. Price at $208.46 sits below the 1H EMA20 at $213.23 and the EMA50 at $216.54. It also trades below the EMA200 at $213.03. That is a fully bearish EMA stack on this timeframe, something not visible on the daily.
RSI14 on the 1H has dropped to 26.89, deep into oversold territory. That is an important nuance. Still, oversold readings can precede short-term bounces, but they can also persist during strong directional moves. This is especially true heading into a volatility catalyst like earnings. The 1H MACD backs the bearish case. Its line at -2.75 sits below the signal at -2.37, with a histogram of -0.38. Momentum is still tilted to the downside, though the negative histogram is relatively modest compared to the move already seen.
The 1H Bollinger Bands show price hugging the lower band at $207.46. The mid-band sits at $213.75 and the upper band at $220.04. This is a classic signature of sustained selling pressure rather than calm consolidation. Therefore, the 1H timeframe confirms the daily caution and, in some respects, amplifies it.
15-Minute Execution Context
The 15-minute chart reinforces the bearish execution context, even as short-term momentum shows a subtle stabilization signal. On the 15-minute chart, the regime is explicitly tagged as bearish, and the structure agrees. Price at $208.46 trades below the 15m EMA20 at $209.94 and the EMA50 at $212.01. It also sits below the EMA200 at $217.37. RSI14 at 31.71 is approaching oversold but has not fully capitulated.
Notably, the 15m MACD shows a subtle shift. The line at -0.94 and the signal at -1.01 produce a slightly positive histogram of 0.07. That is a small but real divergence. Momentum on the shortest timeframe may be stabilizing even as the broader trend remains down. This is typical short-term chop within a larger corrective move. It matters mainly for timing entries or exits rather than defining the overall bias.
Bollinger Bands here are tight, with price near the lower band at $208.58 against a mid-band of $209.71. That is consistent with a market compressing ahead of the earnings catalyst.
The Nvidia Stock Thesis Into Earnings
Nvidia stock sits in a genuine tension zone ahead of earnings, with a still-positive long-term trend overlaid by bearish short-term momentum. The daily trend remains technically intact above the 200-day EMA. However, momentum indicators across the daily, 1H, and 15m timeframes are aligned in showing weakness. This is not a case of conflicting signals. It is closer to a consistent bearish momentum picture layered on top of a still-positive long-term trend.
That combination is exactly what markets tend to produce before a high-stakes earnings report. Positioning gets cautious, ranges widen, and short-term technicals deteriorate while the bigger structure waits for a catalyst.
This lines up with the news backdrop. CNBC described a “flashing yellow light” heading into Wednesday’s report. Seeking Alpha framed the print as potentially “the last hurrah before ASIC”, a nod to competitive pressure narratives around custom silicon. At the same time, Yahoo Finance noted that Nvidia’s valuation “looks surprisingly cheap heading into earnings.”
That raises the question of whether the market has already priced in a strong quarter, leaving limited room for further upside surprise. The Motley Fool piece pointed out that Nvidia’s results could act as a bellwether for other AI chip and memory names. That underscores how much broader sentiment is riding on this single print.
Bullish Scenario
A bullish resolution would require Nvidia stock to reclaim the daily pivot at $210.48 and push back above the daily EMA20 near $214.79. On the 1H chart, a recovery above the EMA200 at $213.03 would be an early signal that sellers are losing control. The oversold 1H RSI at 26.89 leaves room for a relief bounce on its own.
However, for that bounce to matter structurally, it would need to be paired with the daily MACD histogram narrowing from its current -1.13 reading. A strong Q2 print could supply exactly that catalyst. Guidance addressing margin and ASIC competition concerns raised in the earnings previews would help, especially given how cheap the valuation narrative has become.
Bearish Scenario
The bearish case is, in some ways, the path of least resistance right now. A daily close below the S1 support at $205.37 would confirm that sellers are extending the current leg. The 1H EMA stack is already fully bearish, and the 15m regime is tagged the same way.
Earnings guidance could disappoint relative to the elevated expectations discussed in the Seeking Alpha and Yahoo Finance previews. In that case, the daily ATR14 of 5.88 suggests the reaction could be sizable. A break of the daily Bollinger mid-band with continued downside would open the door toward the lower band near $192.83. That would also test the 200-day EMA as a longer-term trend line.
Closing Take
Nvidia stock enters its earnings window with a technical setup that reflects genuine uncertainty rather than a clean directional bias. The daily trend still leans constructive above the 200-day EMA. Yet momentum across every timeframe examined here — daily, 1H, and 15m — points to recent weakness rather than strength. In contrast to a market with clear conviction, this is one where positioning discipline matters more than prediction.
With ATR readings elevated and the earnings catalyst still ahead, volatility is likely to remain the dominant feature. That should hold for Nvidia’s price action in the sessions immediately following the report, regardless of which direction the initial reaction takes.
FAQ
Is Nvidia stock still in an uptrend?
The daily trend remains technically intact above the 200-day EMA at $196.51. NVDA closed at $208.48 on August 24. It sits below its 20-day EMA of $214.79 and its 50-day EMA of $210.46, but the longer-term structure has not broken.
What are the key support and resistance levels for NVDA heading into earnings?
The daily pivot sits at $210.48, with S1 support at $205.37 and R1 resistance at $213.59. Below that, the daily Bollinger lower band near $192.83 aligns with the 200-day EMA as a longer-term trend line.
What does the hourly chart say about Nvidia stock’s momentum?
The 1H chart shows a fully bearish EMA stack. Price at $208.46 sits below the EMA20 at $213.23, the EMA50 at $216.54, and the EMA200 at $213.03. RSI14 at 26.89 is deep in oversold territory.
How volatile is Nvidia stock ahead of the Q2 2027 report?
The daily ATR14 of 5.88 confirms expanded daily ranges. Bollinger Bands are unusually wide, consistent with elevated volatility two sessions before the earnings release.
Disclaimer: This article is for informational purposes only and does not constitute financial advice, an investment recommendation, or a solicitation to buy or sell any financial instrument or cryptocurrency. The analysis provided is not indicative of future results. Investing in crypto assets and financial markets carries a high risk of capital loss. Always do your own research (DYOR) and consult a qualified financial advisor before making any decision.
Article produced with the assistance of artificial intelligence and reviewed by the editorial team.
