




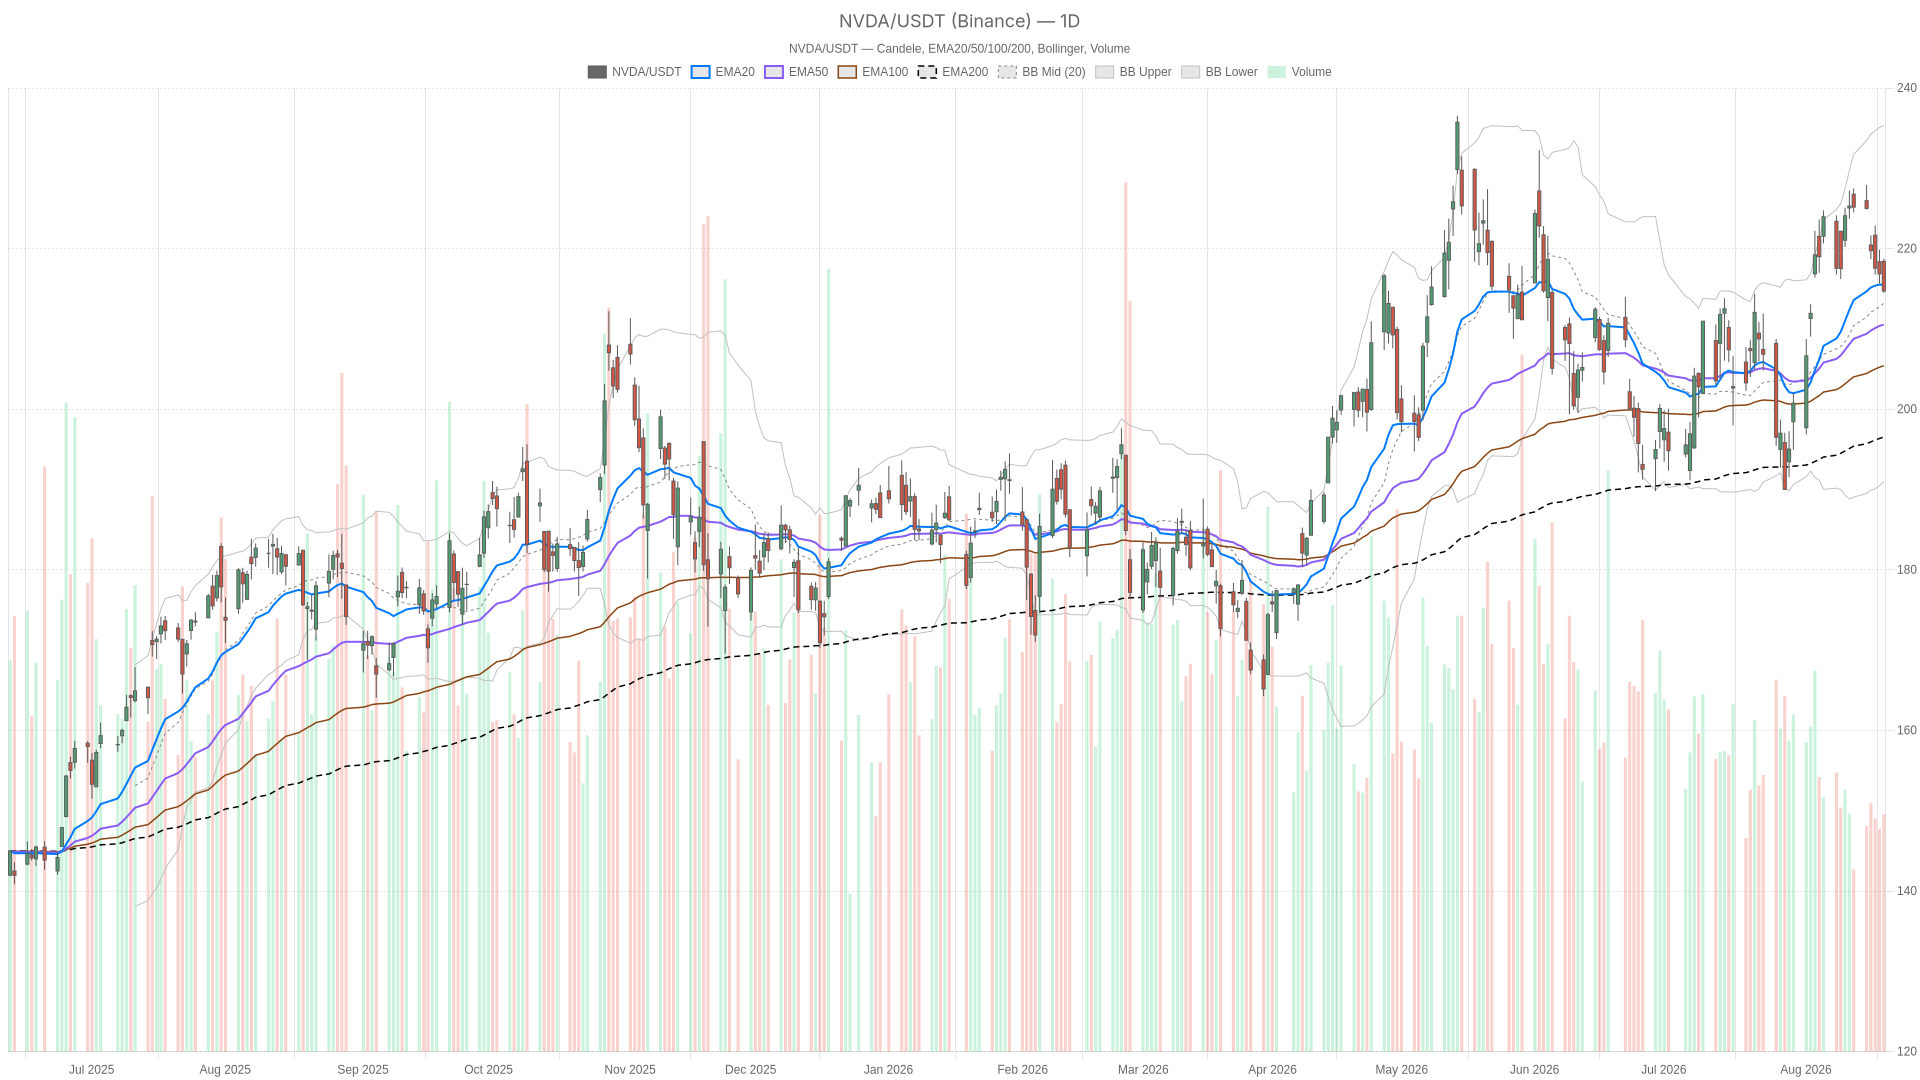
Nvidia stock enters earnings week at a tension point: a structurally intact uptrend versus short-term selling pressure. Shares closed at $214.72, with momentum cooling beneath the surface. The daily chart signals pause, not breakdown — but conviction is thin ahead of the print.
Summary
Key takeaways
- Nvidia stock closed at $214.72, caught between a structurally intact daily uptrend and growing short-term selling pressure.
- Daily RSI sits at neutral 51.01, while MACD shows a bearish crossover — momentum is fading but the trend has not reversed.
- The hourly chart confirms sellers are in control, with RSI at 32.9 and price trading below the EMA20 and EMA50.
- Daily support at $213.23 is the critical line; a break below opens the path to the EMA50 at $210.54.
- Earnings and Jackson Hole inflation data are expected to keep volatility elevated, with daily ATR at 5.75.
Notably, the setup arrives at a sensitive moment. Nvidia earnings headline a week that also includes the Jackson Hole inflation reading, according to reporting from Yahoo Finance. That combination alone is enough to keep implied volatility elevated regardless of which way price ultimately breaks.
Nvidia Stock Price: Daily Trend Still Intact, But Momentum Fades
The daily trend for Nvidia stock remains structurally intact, with price holding above both key moving averages. However, momentum indicators are flashing caution signals that demand attention. Price sits above the EMA50 at 210.54 and the EMA200 at 196.54, keeping the broader uptrend technically valid. Yet price has slipped below the EMA20 at 215.45. The short-term average has flipped from support into resistance — an early warning sign, not a trend-ending one.
RSI14 on the daily sits at 51.01, essentially neutral territory offering no strong directional edge. Meanwhile, the MACD tells a more cautionary story: the line at 3.65 sits below the signal at 4.06, producing a histogram of -0.4. In plain terms, daily momentum is fading even though the broader trend has not reversed. The bearish crossover on the MACD is the clearest technical concern right now.
Bollinger Bands on the daily are wide, with the upper band at 235.34 and the lower band at 191.02. The midline sits at 213.18. Price is trading just above that midline, pointing to no extreme condition and plenty of room to move either way. Meanwhile, ATR14 stands at 5.75, a level consistent with a market bracing for an earnings-driven volatility event. The daily pivot structure adds precision: pivot point at 215.99, resistance at 217.47, and support at 213.23. Price is trading right against that support. That is why the system still tags the daily regime as neutral. Despite the long-term structure leaning bullish, the immediate battle is happening right at this pivot zone.
Hourly Chart Confirms Short-Term Weakness
Short-term weakness in Nvidia stock is confirmed on the hourly chart, where sellers remain in control. Still, the larger hourly structure has not broken down entirely. RSI14 has dropped to 32.9, approaching oversold territory and reflecting persistent selling pressure over recent sessions. The MACD line at -1.65 sits just below the signal at -1.62, with a histogram of -0.03. That narrowing histogram hints momentum may be stabilizing, but the setup remains bearish for now.
Meanwhile, price is trading below both the EMA20 at 216.96 and the EMA50 at 218.79 on the hourly chart. However, it still holds above the EMA200 at 213.28. That detail matters. It means intraday sellers are active and clearly in control of the recent move. Yet the larger hourly trend structure has not been broken outright. This is the conflict worth flagging: the daily chart leans constructive on a longer horizon, while the hourly chart confirms real short-term weakness. Neither view cancels the other — they operate on different clocks.
The hourly Bollinger Bands, with a midline of 216.96 and lower band at 213.73, show price hugging the bottom of its recent range. ATR14 on the hourly sits at 1.63, and the pivot levels are tight: pivot at 214.93, resistance at 215.3, support at 214.38. That compression suggests indecision immediately ahead of a major catalyst.
15-Minute Chart: Execution Context Only
On the 15-minute chart, the regime is explicitly bearish. RSI14 reads 40.37, and the MACD histogram is essentially flat at 0, with the line and signal both at -0.38. Price sits below the EMA20 at 215.45, the EMA50 at 216.37, and the EMA200 at 219.46 — a fully bearish alignment across short-term averages. For traders focused on timing rather than direction, this simply confirms that near-term pressure remains toward the pivot and support zone around 214.38 to 213.23.
What the News Flow Means for Nvidia Stock
The news backdrop for Nvidia stock is fundamentally constructive. However, it is running directly into a market that is digesting recent gains. Nvidia earnings are the headline event, arriving alongside the Jackson Hole inflation reading that could move the entire risk complex. Separately, reports indicate Nvidia plans a major price hike. Microsoft, Google and Oracle have already been notified of the forthcoming increases on the data center chips they rely on. That detail supports the longer-term margin and pricing-power argument behind the stock, even as short-term technicals wobble.
At the same time, a nine-year Nvidia coverage veteran at The Motley Fool noted that valuation is arguably the most surprising attribute of Nvidia stock right now. That comment captures the market’s ongoing debate about how much further the rally can stretch. Retail trader attention has also stayed elevated, with NVDA among the most closely watched names last week according to Yahoo Finance’s roundup. Overall, the fundamental narrative remains supportive, but it is colliding with a market that is, for now, pausing to absorb recent gains.
Bullish Scenario
For the bullish case to reassert itself, Nvidia stock needs to reclaim the daily EMA20 at 215.45 and hold above daily support at $213.23. A push through the daily pivot at 215.99 and resistance at $217.47 would be the first concrete sign that buyers are back in charge. From there, a daily MACD histogram flipping positive — combined with RSI moving back above the 50 midpoint — would confirm renewed momentum.
A strong earnings print, paired with the pricing-power narrative from the reported chip price increases, could realistically supply that catalyst. In that scenario, the wide daily Bollinger Band upper level at 235.34 becomes a plausible longer-term reference point. That would require a sustained move rather than a single-session spike, however.
Bearish Scenario
On the other hand, the bearish case gains traction if Nvidia stock loses daily support at $213.23 outright. That would open the door toward the daily EMA50 at 210.54 as the next meaningful level. This scenario becomes more likely if earnings disappoint or if the Jackson Hole inflation reading pressures broader risk appetite.
In contrast to the bullish setup, this path would be reinforced by the already-bearish hourly and 15-minute alignment. A confirmed break below current support, combined with continued RSI weakness on the hourly chart, would invalidate the near-term bullish thesis. Control would shift back to sellers, particularly if the daily MACD bearish crossover extends rather than stabilizes.
Positioning Into a High-Volatility Week
Overall, Nvidia stock is sitting at a genuine inflection point. The daily chart still favors the longer-term uptrend, while the hourly and 15-minute timeframes lean bearish into the print. Therefore, the signals across timeframes are mixed rather than aligned — and that mismatch itself is the key takeaway.
With daily ATR at 5.75 and an earnings report landing in the same week as the Jackson Hole inflation data, volatility is likely to remain elevated regardless of direction. Given that backdrop, this remains a market defined by uncertainty rather than conviction. Positioning should reflect that reality until price confirms a clear break in either direction.
FAQ
Is Nvidia stock still in an uptrend?
Yes, on the daily chart Nvidia stock remains above both the EMA50 at $210.54 and the EMA200 at $196.54. This keeps the broader uptrend structurally intact despite short-term weakness on lower timeframes.
What are the key levels to watch for Nvidia stock?
Key support sits at $213.23, with the EMA50 at $210.54 below. Resistance stands at $215.99 and $217.47. A break above $217.47 would signal renewed buyer control, while a loss of $213.23 opens the path lower.
Why is volatility expected to remain high for Nvidia stock?
Nvidia reports earnings this week, coinciding with the Jackson Hole inflation reading. Daily ATR stands at 5.75, reflecting elevated implied volatility ahead of these dual catalysts.
What would invalidate the bullish thesis for Nvidia stock?
A confirmed break below daily support at $213.23, combined with continued RSI weakness on the hourly chart and an expanding daily MACD bearish crossover, would shift control back to sellers and invalidate the near-term bullish thesis.
Disclaimer: This article is for informational purposes only and does not constitute financial advice, an investment recommendation, or a solicitation to buy or sell any financial instrument or cryptocurrency. The analysis provided is not indicative of future results. Investing in crypto assets and financial markets carries a high risk of capital loss. Always do your own research (DYOR) and consult a qualified financial advisor before making any decision.
Article produced with the assistance of artificial intelligence and reviewed by the editorial team.
