




Applied Optoelectronics, Inc. stock is caught between two narratives. A long-term AI-driven optical networking story supports the bullish case. Yet the chart just produced a sharp, high-volume pullback from recent highs. Reconciling those two pictures is the core challenge for anyone reading AAOI price action right now.
Summary
Key takeaways
- Daily MACD remains constructive with a positive histogram of 0.8, keeping the broader uptrend intact
- RSI14 at 49.19 on the daily chart offers no directional edge either way
- Hourly RSI at 40.09 signals active near-term selling pressure that cannot be ignored
- The 200-day EMA at 105.89 provides a distant but structurally intact floor beneath the recent pullback
- Daily ATR14 of 17.05 means outsized swings should be expected in either direction
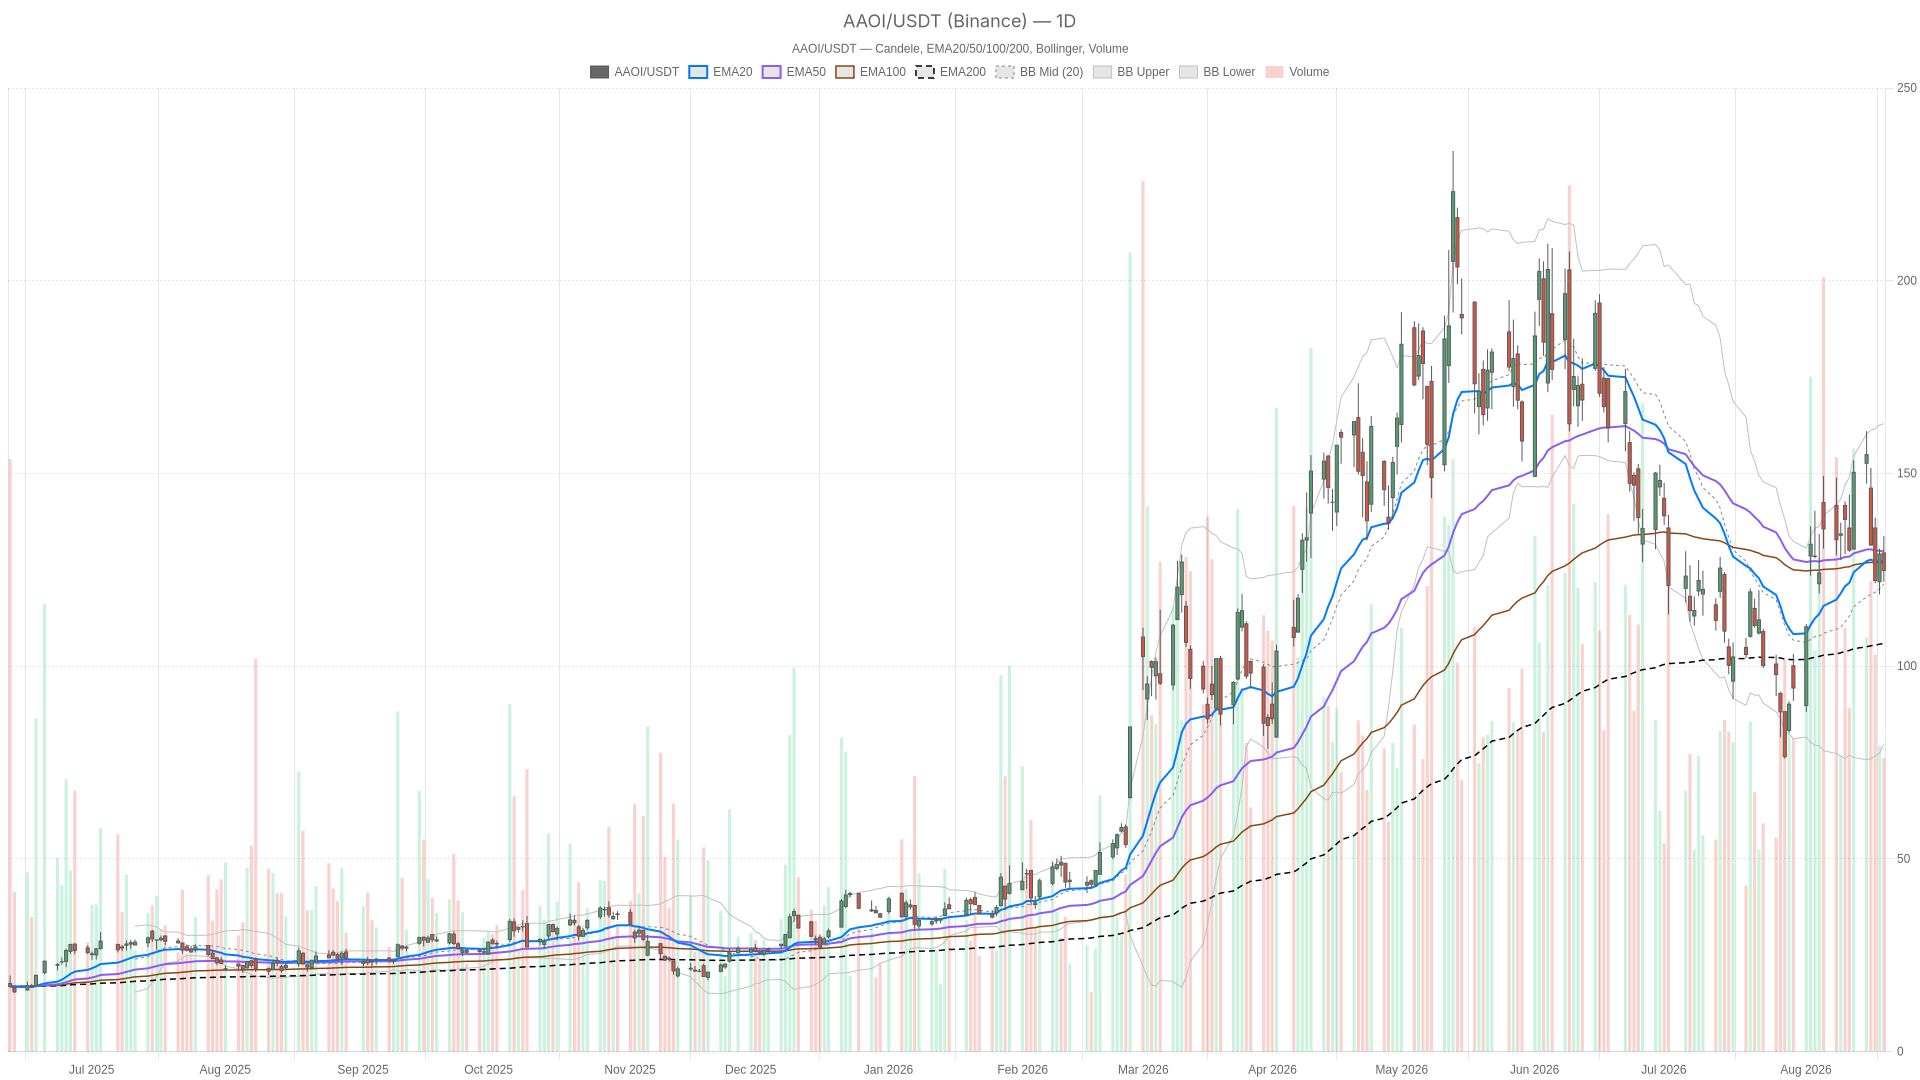
The daily candle from August 21 tells the story bluntly. AAOI opened at 129.37, spiked to 133.72, then reversed hard to close at 124.82 on volume of 9.14 million shares. That is a wide, volatile range. It left the stock sitting below both its 20-day EMA (127.08) and 50-day EMA (129.76). However, the 200-day EMA sits far below at 105.89. This means the broader uptrend remains technically intact despite the recent shakeout.
Applied Optoelectronics, Inc. Stock Technical Analysis: Daily Structure Stays Neutral
The daily chart has not broken down. Despite the August 21 selloff, momentum remains neutral-to-constructive. The broader uptrend anchored by the 200-day EMA is still intact.
Meanwhile, momentum on the daily timeframe is genuinely balanced. RSI14 reads 49.19, essentially dead center, offering no directional edge on its own. MACD is more constructive. The line at 2.87 sits above the signal at 2.07, with a positive histogram of 0.8. That keeps daily momentum tilted bullish. However, the gap between line and signal has narrowed following the selloff. The daily regime reading itself is labeled neutral. This fits a market that is digesting a sharp move rather than confirming a new trend in either direction.
At the same time, Bollinger Bands add useful context here. The daily mid-band sits at 121.26. The upper band stretches to 162.87, while the lower band sits at 79.64. That is an unusually wide band structure. It reflects the elevated ATR14 reading of 17.05. In practical terms, this stock moves in large increments. Traders should expect outsized daily swings rather than tight, orderly ranges. The daily pivot sits at 126.81, with resistance at R1 (131.73) and support at S1 (119.9). These levels now frame the near-term battle between buyers defending the pullback and sellers pressing the reversal.
1H Timeframe Weakens the Bullish Case
The hourly chart shows active selling pressure. Price is trading below both the 20-period and 50-period EMAs, with RSI at 40.09 reflecting genuine downside momentum rather than simple consolidation.
On the hourly chart, price closed at 124.77. It sits below the 1H EMA20 (127.68) and EMA50 (131.65), and also below the EMA200 at 126.75. That is a mixed alignment. However, the short-term EMAs stacking above price is a clear sign of near-term selling pressure. RSI14 on the hourly comes in at 40.09, meaningfully below the neutral 50 line. This is consistent with active downside momentum rather than simple consolidation.
Meanwhile, MACD on the 1H reinforces that weaker read. The line sits at -3.14 versus a signal of -3.5. Both are negative. However, the histogram at 0.36 is positive. This hints that downside momentum may be losing steam even as the trend stays negative. Hourly Bollinger Bands show a mid-line of 125.88 with price trading below it. The hourly pivot sits at 124.62, with R1 at 125.45 and S1 at 123.95. Price is essentially glued to the pivot point, reflecting genuine short-term indecision.
The Timeframe Conflict
Here is the conflict worth flagging directly. The daily structure remains neutral-to-constructive, anchored by a still-rising 200-day EMA and a positive MACD histogram. The hourly timeframe, in contrast, shows a market under active short-term pressure. It trades beneath its key moving averages with momentum still negative. That disagreement matters. It suggests the daily uptrend has not been invalidated, but it is being tested. The near-term path of least resistance may stay choppy until the hourly chart repairs itself.
15-Minute Chart: Execution Context Only
The 15-minute chart is bearish and aligns with hourly weakness rather than daily neutrality. It should be used only for execution framing around the 123.95–125.45 pivot zone. It is not where the broader AAOI stock outlook is decided.
Notably, on the 15-minute chart, the regime reading is explicitly bearish. That lines up with the hourly weakness rather than the daily neutrality. Price closed at 124.77, essentially in line with its 20-period EMA (124.87). However, it sits well below the 50-period EMA (126.25) and far below the 200-period EMA (132.55). RSI14 at 47.57 and a nearly flat MACD histogram of 0.07 both point to short-term indecision. This is typical of a market pausing near a pivot before the next directional push. ATR14 here is just 0.93, confirming that intraday volatility has compressed relative to the daily swings seen earlier in the week.
This timeframe should be read purely as execution context. It is not where the broader AAOI stock outlook is decided. But it does help frame short-term entries around the 123.95–125.45 pivot zone.
The Bullish Case for Applied Optoelectronics, Inc. Stock
The bullish case rests on a strong fundamental backdrop and an intact daily structure. Manufacturing expansion and AI-driven demand provide the narrative, while key technical levels define the path to recovery.
The fundamental backdrop still leans constructive. Recent coverage has framed the pullback as a buying opportunity. It cites Applied Optoelectronics’ manufacturing capacity approaching 200,000 units per month for 800G and 1.6T products. At Rosenblatt’s Technology Summit, CFO and Chief Strategy Officer Stefan Murry emphasized U.S.-based laser manufacturing and automated production. He framed these as differentiators for AI data-center customers. One widely cited thesis targets over 170% year-over-year revenue growth in 2027. This is driven by demand for high-speed optical transceivers. The stock trades at roughly 4x sales, a valuation some analysts view as inexpensive relative to that growth trajectory.
For the bullish scenario to gain technical traction, however, AAOI would need to reclaim the daily pivot at 126.81. It must also push back above the daily EMA20 near 127.08. A recovery through R1 at 131.73 and toward the daily EMA50 (129.76) would help repair the hourly chart’s negative alignment.
A shift in hourly RSI back above 50 would be the first signal. A MACD histogram turning consistently positive across both the 1H and 15m timeframes would confirm it. Together, these would be the clearest sign that the pullback was a pause within the larger uptrend rather than the start of something more serious.
The Bearish Case
The bearish case centers on short-term deterioration spreading into the daily structure. Key support sits at S1 (119.9), and the hourly chart’s negative momentum remains the primary headwind.
On the other hand, a daily close below S1 at 119.9 would be a meaningful technical warning. This is especially true given the stock’s already elevated ATR14 of 17.05. Large moves can happen quickly here in either direction. If the hourly EMA20 and EMA50 continue capping rallies and RSI stays anchored below 50, sellers would likely keep control of the near-term tape. A drift toward the daily Bollinger mid-band at 121.26, or further, would invalidate the constructive daily read. It would shift the broader bias toward neutral-to-bearish.
It is also worth noting the competitive framing in recent coverage. AAOI benefits from the same AI-driven optical networking demand as peers like Lumentum. However, some analysis suggests Lumentum currently holds the edge on growth estimates. That relative positioning does not change AAOI’s own technical picture. Still, it is a data point worth keeping in mind when sizing conviction around the bullish thesis.
Closing Thoughts
Overall, Applied Optoelectronics, Inc. stock sits at a genuine crossroads between timeframes. The daily chart has not broken its longer-term structure. Momentum remains technically neutral. The fundamental story around AI infrastructure and manufacturing capacity continues to draw attention. Meanwhile, the hourly and 15-minute charts both show short-term weakness that cannot be ignored.
Given the daily ATR14 of 17.05, volatility alone will likely dictate near-term price action as much as any single indicator. Until the shorter timeframes align with the daily structure, positioning around AAOI stock price levels near the 119.9–131.73 range should account for elevated uncertainty. This is not yet a settled directional call.
FAQ
Is Applied Optoelectronics, Inc. stock still in an uptrend?
The daily chart shows the broader uptrend remains technically intact. The 200-day EMA sits at 105.89, well below the current price of 124.82. Daily MACD also remains constructive with a positive histogram of 0.8. However, short-term weakness on the hourly chart means the uptrend is being tested.
What are the key support and resistance levels for AAOI stock?
The daily pivot sits at 126.81. Immediate resistance is R1 at 131.73, while key support is S1 at 119.9. On the hourly chart, the pivot is 124.62 with a tight range between R1 at 125.45 and S1 at 123.95. A daily close below S1 at 119.9 would be a meaningful technical warning.
What does the RSI indicate for AAOI right now?
Daily RSI14 reads 49.19, essentially neutral and offering no directional edge. However, hourly RSI14 sits at 40.09, meaningfully below the neutral 50 line and consistent with active near-term selling pressure. The conflict between these two readings is central to the current technical picture.
Why did AAOI stock pull back from recent highs?
The August 21 session saw AAOI open at 129.37 and spike to 133.72 before reversing hard to close at 124.82 on elevated volume of 9.14 million shares. The selloff left the stock below both its 20-day EMA (127.08) and 50-day EMA (129.76). Despite this, the fundamental story around AI-driven optical networking demand and manufacturing expansion remains intact.
Disclaimer: This article is for informational purposes only and does not constitute financial advice, an investment recommendation, or a solicitation to buy or sell any financial instrument or cryptocurrency. The analysis provided is not indicative of future results. Investing in crypto assets and financial markets carries a high risk of capital loss. Always do your own research (DYOR) and consult a qualified financial advisor before making any decision.
Article produced with the assistance of artificial intelligence and reviewed by the editorial team.
