




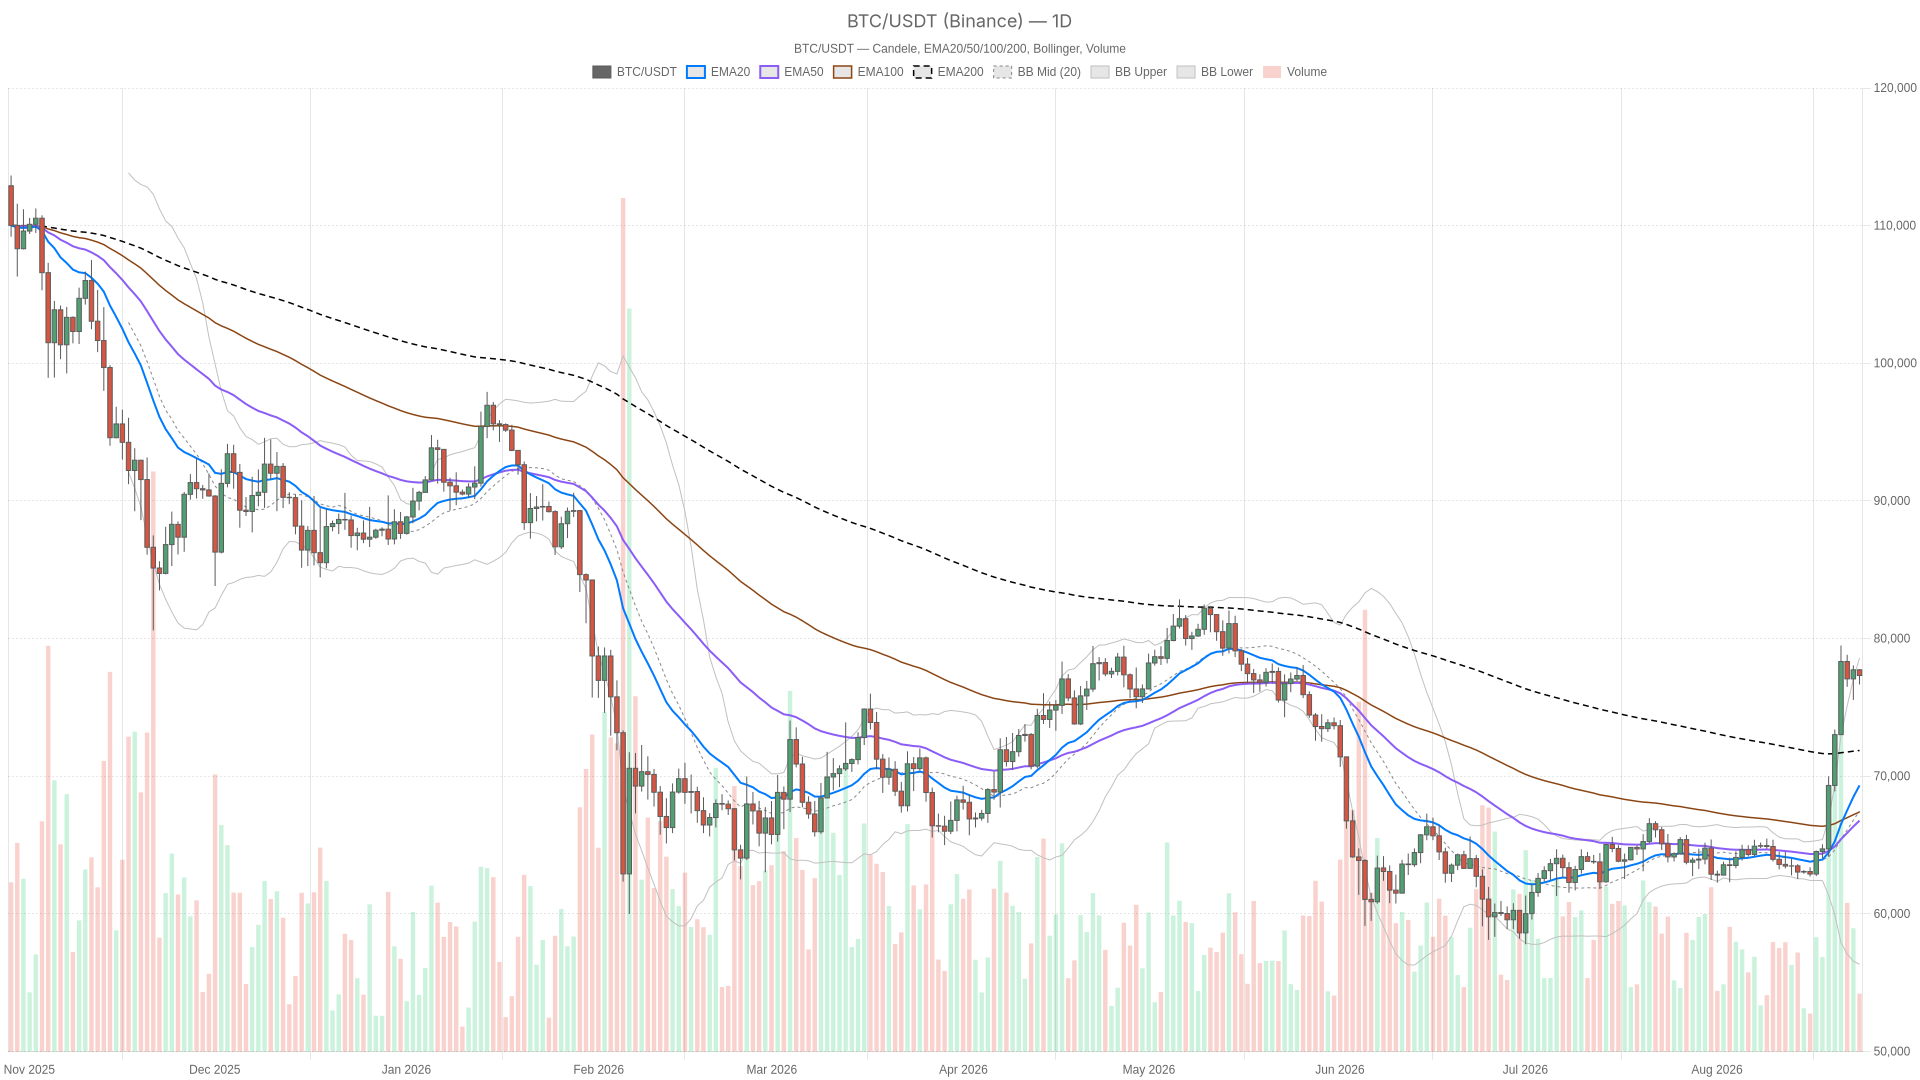
As of August 24, 2026, BTC value trades near $77,320, just below the psychological zone that has defined this leg higher. The daily trend remains strong, but stretched momentum makes chasing the move uncomfortable. That tension between a powerful macro trend and an exhausted short-term condition defines the current setup.
Summary
Key takeaways
- BTC trades near $77,320 on August 24, 2026, above the daily EMA20, EMA50, and EMA200.
- Daily RSI14 reads 78.85, deep in overbought territory, while price hugs the upper Bollinger Band at $78,598.61.
- Bitcoin ETFs posted their biggest weekly inflow in ten months, and Ray Dalio called to buy bitcoin as a debt crisis looms.
- Bitcoin dominance sits at 59.21%, and the Fear & Greed Index reads 73 (Greed).
- The 1H MACD histogram has turned negative at -19.44, signaling cooling momentum inside a bullish structure.
Macro Backdrop: Inflows, a Short Squeeze, and Debt Fears
The rally is not only about chart mechanics; macro flows and a short squeeze have powered the move.
According to Bloomberg, Bitcoin ETFs just posted their biggest weekly inflow in ten months during this rally. Bloomberg reporting linked the move higher to fiscal concerns pushing capital toward scarce assets. Meanwhile, Fortune reported that a crowded short position betting BTC would stay below $67,000 got blown up in a single afternoon after a Treasury buyback announcement.
That classic short squeeze accelerated an already directional move. Moreover, Ray Dalio publicly called to sell bonds and buy gold and bitcoin as a debt crisis looms. That macro narrative is currently doing more work than any single technical signal.
Daily Timeframe: Strong Trend, Overbought Warning
The daily chart confirms a strong uptrend, yet overbought momentum warns against chasing the move at current levels.
The daily close of $77,320 sits comfortably above the EMA20 at 69,337.79, the EMA50 at 66,780.23, and the EMA200 at 71,877.52. That bullish stack confirms the primary trend remains up. However, RSI14 reads 78.85 on the daily, deep into overbought territory. It signals that buyers have been in near-total control, but the move has outrun itself in the short run. Stretched readings like this often resolve through a sharp pause or a fast, sloppy pullback.
Additionally, the MACD reinforces the trend-strength argument. Its line at 3,302.66 sits well above the signal at 1,738.88, with a histogram of 1,563.78 confirming genuine acceleration. Bollinger Bands add another layer. Price hugs the upper band at 78,598.61, while the mid-band sits far lower at 67,471.55.
That wide gap means either the trend keeps riding the upper band or price snaps back toward the mid-band once buyers pause. ATR14 at 2,239.36 shows how much room price has in either direction. Pivot levels place support at 76,729.94 and resistance at 77,850.12, tight brackets around a market deciding its next move.
1H Timeframe: Momentum Cooling Inside a Bullish Structure
The hourly chart still shows a bullish structure, but momentum is cooling right after the squeeze that launched this rally.
On the 1H chart, the regime is still tagged bullish, and the structure holds. The EMA20 at 77,257 and the EMA50 at 76,897.04 both sit below price, keeping the short-term trend intact. However, RSI14 has cooled to 51.92, essentially neutral. The MACD histogram has flipped slightly negative at -19.44, with the MACD line at 56.76 now trailing the signal line at 76.2.
That marks a subtle divergence from the daily picture. The bigger trend remains up, but the hourly engine is losing some thrust. Price sits almost exactly on the 1H pivot at 77,298, between support at 77,252 and resistance at 77,390. This narrow range reflects a market digesting recent gains rather than pushing for new highs immediately.
15-Minute View: Execution Context Only
The 15-minute chart offers execution context rather than direction, showing buyers and sellers in near balance.
The 15m chart shows RSI14 at 50.51 and a small positive MACD histogram of 24.62. That points to tentative, low-conviction buying rather than aggressive follow-through. The EMA20, EMA50, and EMA200 are bunched tightly together around the 77,130 to 77,330 zone. Such clustering is typical of a market pausing to consolidate rather than committing to a direction. This timeframe does not show where BTC is headed next. It simply confirms that intraday buyers and sellers are roughly balanced for now.
Bullish Scenario
The bullish case depends on holding short-term support while the daily trend resets from overbought conditions.
If BTC value holds above the 1H EMA50 at 76,897.04 and the daily pivot support at 76,729.94, the broader uptrend has room to keep pushing. The next target is the daily upper Bollinger Band at 78,598.61 and beyond. This scenario is helped by the macro backdrop: continued ETF inflows, a debt-crisis narrative pushing capital toward scarce assets, and Bitcoin dominance at 59.21% of total crypto market cap.
That concentration signals capital rotating into BTC rather than spreading into altcoins. Meanwhile, for real traction to return, the 1H MACD histogram would need to flip back positive. RSI would also need to reset from overbought without a meaningful price decline, letting the daily trend catch its breath while price holds its ground.
Bearish Scenario
The bearish case starts with a decisive break below the 1H EMA50 and daily S1 pivot.
In contrast, the invalidation case begins with a decisive break below the 1H EMA50 at 76,897.04 and the daily S1 pivot at 76,729.94. Combined with a daily RSI already sitting at 78.85 and vulnerable to rolling over, that break would open the door to a mean-reversion move. Price could head back toward the daily EMA20 at 69,337.79 or even the Bollinger mid-band at 67,471.55.
Given the daily ATR14 of 2,239.36, a couple of sharp down days could quickly erase a meaningful chunk of this rally’s premium. The early warning sign is already visible on the 1H chart, where the MACD histogram has turned negative. If that weakness spreads and drags 1H RSI decisively below 50 while price loses the pivot, sellers would have a legitimate technical case.
Positioning and Risk
The market sits in a two-sided spot: the daily trend favors patience, while overbought momentum discourages chasing.
Right now the daily trend is strong enough to justify staying constructive on Bitcoin. However, the overbought RSI reading and the system’s neutral daily regime tag both flag a problem. This is not a moment to assume the trend continues in a straight line. The Fear & Greed Index reading of 73, classified as Greed, lines up with that overbought signal. Sentiment is stretched right alongside price, and stretched sentiment plus stretched momentum is usually when volatility picks up in either direction.
Total crypto market cap slipped slightly over 24 hours, at -0.875%, while BTC dominance holds near 59%, according to aggregated market-cap data. That suggests capital is rotating toward Bitcoin rather than leaving the space outright, a detail that matters if broader risk appetite gets tested. Whichever way this resolves, the recent move’s size and the width of the daily Bollinger Bands mean the next few sessions carry real two-way risk. Position sizing should reflect that rather than a fixed directional view.
FAQ
Is the uptrend still intact?
Yes. As of August 24, 2026, price trades near $77,320, above the daily EMA20 at 69,337.79, the EMA50 at 66,780.23, and the EMA200 at 71,877.52, confirming a bullish stack.
What levels matter most for the bearish case?
A decisive break below the 1H EMA50 at 76,897.04 and the daily S1 pivot at 76,729.94 could open a mean-reversion move toward the daily EMA20 at 69,337.79 or the Bollinger mid-band at 67,471.55.
Disclaimer: This article is for informational purposes only and does not constitute financial advice, an investment recommendation, or a solicitation to buy or sell any financial instrument or cryptocurrency. The analysis provided is not indicative of future results. Investing in crypto assets and financial markets carries a high risk of capital loss. Always do your own research (DYOR) and consult a qualified financial advisor before making any decision.
Article produced with the assistance of artificial intelligence and reviewed by the editorial team.
