



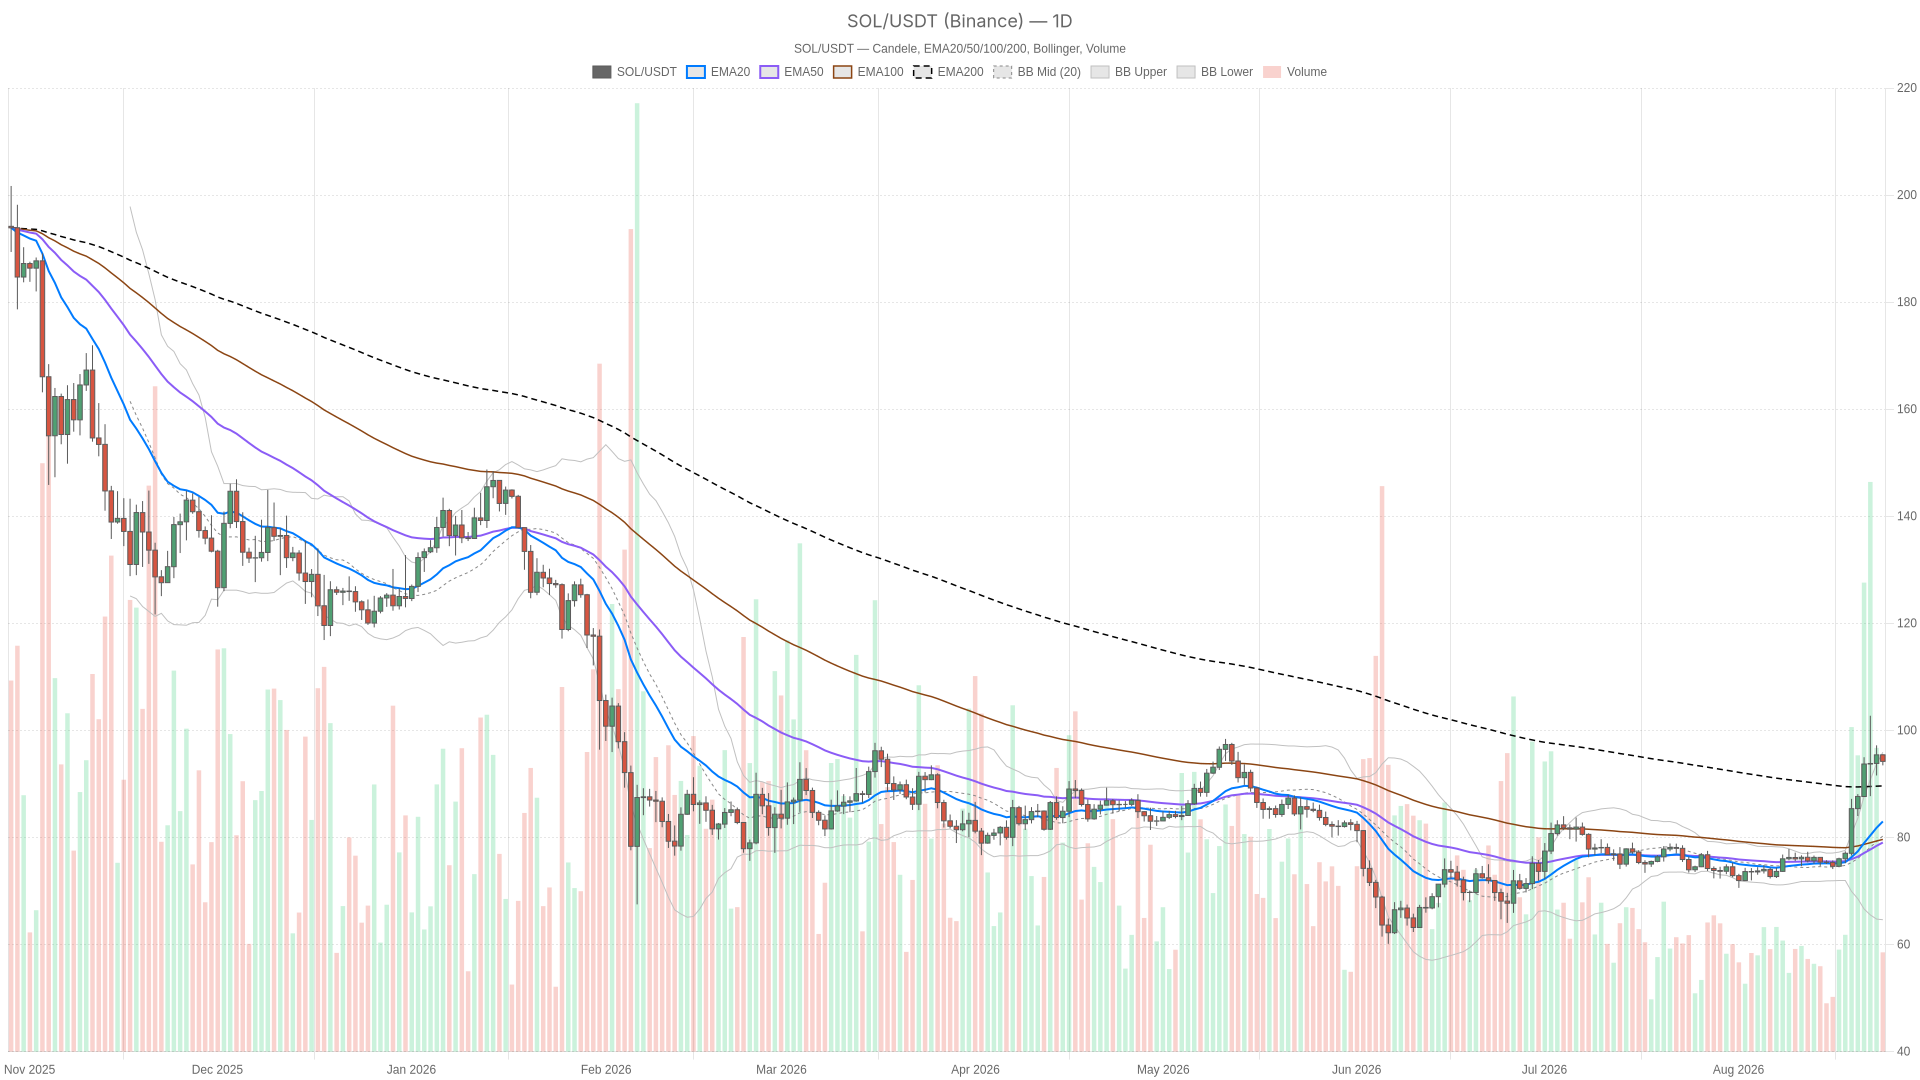
As of August 24, 2026, SOL/USDT sits at $94.21, above every major moving average yet flashing a daily RSI of 79.78. The Solana crypto market now faces a tension between a strong uptrend and exhausted momentum, forcing traders to decide between riding the trend or waiting for a reset.
Summary
Key takeaways
- SOL/USDT trades at $94.21 on August 24, 2026, above the EMA20, EMA50 and EMA200.
- The daily RSI reads 79.78, deep into overbought territory, while the 1-hour RSI has cooled to 48.08.
- The Fear & Greed Index sits at 73 (“Greed”), and total crypto market cap slipped 0.88% over 24 hours to roughly $2.61 trillion.
- Solana DEX fees jumped: Raydium up 253.22% over 7 days, Orca up 532.09% and BisonFi up 458.6%.
- Daily ATR stands at 4.16, with the daily pivot at 94.41 and support S1 at 93.27.
Daily Trend: The Dominant Force Behind Solana Right Now
The daily trend for SOL is unambiguously bullish. Price at $94.21 trades above the EMA20 (82.99), the EMA50 (79.06) and the EMA200 (89.63). This clean stack confirms that buyers have been in control across multiple horizons. The MACD backs it up: the line sits at 4.79 against a signal of 2.63, with a histogram of 2.16 still expanding on the bullish side.
However, the catch is the RSI. At 79.78, it sits well past the threshold where trend-followers get nervous and mean-reversion traders look for a fade. Price also presses against the upper Bollinger Band (95.92), with the midline at 80.28 and the lower band at 64.64. That band width reflects how much SOL has already expanded from its recent base.
Daily ATR of 4.16 shows volatility is real, not noise. The daily pivot sits at 94.41, with resistance R1 at 95.36 and support S1 at 93.27. Price trades just under the pivot, a subtle sign the immediate push higher has stalled even as the broader trend stays intact.
Intraday Reality Check: H1 and 15-Minute Charts Are Cooling
The shorter timeframes are cooling rather than confirming fresh strength. On the 1-hour chart, RSI has dropped to a neutral 48.08, and the MACD histogram has flipped negative at -0.14. The MACD line sits right at zero against a 0.14 signal. Price at $94.22 is wedged between the EMA20 (94.50) and EMA50 (93.85), chopping around its own short-term averages instead of pushing decisively in either direction.
The H1 Bollinger Bands (94.86 mid, 96.05 upper, 93.67 lower) show price below the midline, matching the softer momentum reading. Meanwhile, on the 15-minute chart, the picture is flatter: RSI at 47.89, MACD histogram barely positive at 0.02 after sitting negative, and EMA20/50/200 bunched between 94.07 and 94.52. ATR has compressed to 0.6, a classic sign of a market pausing rather than deciding. The daily trend is bullish, but the shorter timeframes are consolidating right under recent highs.
Market Backdrop: Greed, Dominance and On-Chain Activity
The market backdrop is one of cooling greed and rising on-chain usage. Bitcoin dominance stands at 59.21%, and SOL’s share of total market cap is around 2.1%. Even with SOL performing well on its own chart, this remains a BTC-led market. Sentiment is generous but cooling: the Fear & Greed Index sits at 73, in “Greed” territory, while total crypto market cap slipped about 0.88% over 24 hours to roughly $2.61 trillion.
What is more interesting for the Solana crypto thesis is the on-chain fee data across its DEX ecosystem. Raydium AMM fees are up 253.22% over 7 days and 216.28% over 30 days. Orca DEX is up 532.09% over 7 days and 286.47% over 30 days, while BisonFi has jumped 458.6% over 7 days and 215.16% over 30 days. PumpSwap has also grown, up 41.82% over 7 days and 20.59% over 30 days.
That is a genuine pickup in usage across Solana’s trading infrastructure, even if daily changes on some venues were negative. Activity is choppy day-to-day but trending up structurally. However, not every venue shared the gains: HumidiFi’s fee activity collapsed, down 100% over both 7 and 30 days. That serves as a reminder that flows within the Solana ecosystem are not uniform.
Bullish Scenario
The bullish case points toward R1 at 95.36 and a retest of the daily upper Bollinger Band near 95.92. If SOL holds above the daily pivot support zone (S1 at 93.27) and the 1-hour chart reclaims its EMA20/EMA50 cluster with RSI pushing back above the mid-50s, the path of least resistance points to those levels.
Moreover, sustained growth in Solana DEX fee activity, particularly the multi-week strength seen on Raydium, Orca and BisonFi, would give this move real fundamental support. This scenario is invalidated if price cannot hold the 93.27–94.03 zone (daily S1 and H1 pivot support) and slips back through it with rising selling pressure.
Bearish Scenario
The bearish case is a mean-reversion pullback toward the daily EMA20 near 82.99. The overbought daily RSI (79.78) combined with fading H1 momentum (negative MACD histogram) is a classic setup for such a move. If the shorter timeframes keep losing ground, price could break below the 93.52–93.67 support band seen on the 15-minute and 1-hour Bollinger lower bands. That would make the daily EMA20 the next real magnet. The Bollinger midline at 80.28 is a deeper reversion target if selling accelerates.
That said, this scenario is invalidated if buyers step back in at current levels, reclaim the H1 EMA20/EMA50, and push the 1-hour RSI back above 55–60. That would suggest the daily uptrend is simply resuming after a shallow pause rather than rolling over.
Positioning and Risk
Right now, the SOL chart is a study in conflicting signals rather than a clean directional call. The daily trend is strong, and on-chain fee data across Solana’s DEX ecosystem backs up the idea that real usage is growing. But a daily RSI near 80 and stalling momentum on the 1-hour and 15-minute charts mean this is not a moment to assume the trend continues in a straight line.
Moreover, daily ATR of 4.16 and the broader market’s slight 24-hour pullback are both reminders that volatility can cut in either direction. With Fear & Greed at 73, sentiment is generous, which historically tends to precede sharper corrections when momentum stalls. Traders watching this setup should treat the daily pivot and S1 levels as the key line in the sand, and let the 1-hour momentum readings decide whether this is a pause before continuation or the early stage of a deeper pullback.
FAQ
Is Solana overbought right now?
The daily RSI reads 79.78, deep into overbought territory, while the 1-hour RSI has cooled to 48.08 and the 15-minute RSI sits at 47.89. The higher timeframe is stretched, but intraday momentum has paused.
What are the key Solana price levels to watch?
The daily pivot sits at 94.41, with support S1 at 93.27 and resistance R1 at 95.36. The daily upper Bollinger Band near 95.92 marks the next upside test, while the daily EMA20 near 82.99 is a deeper support magnet.
Is Solana DEX activity actually growing?
Yes. Raydium AMM fees rose 253.22% over 7 days, Orca DEX rose 532.09% over 7 days, and BisonFi jumped 458.6% over 7 days. HumidiFi, however, saw fee activity fall 100% over both 7 and 30 days.
Disclaimer: This article is for informational purposes only and does not constitute financial advice, an investment recommendation, or a solicitation to buy or sell any financial instrument or cryptocurrency. The analysis provided is not indicative of future results. Investing in crypto assets and financial markets carries a high risk of capital loss. Always do your own research (DYOR) and consult a qualified financial advisor before making any decision.
Article produced with the assistance of artificial intelligence and reviewed by the editorial team.
