




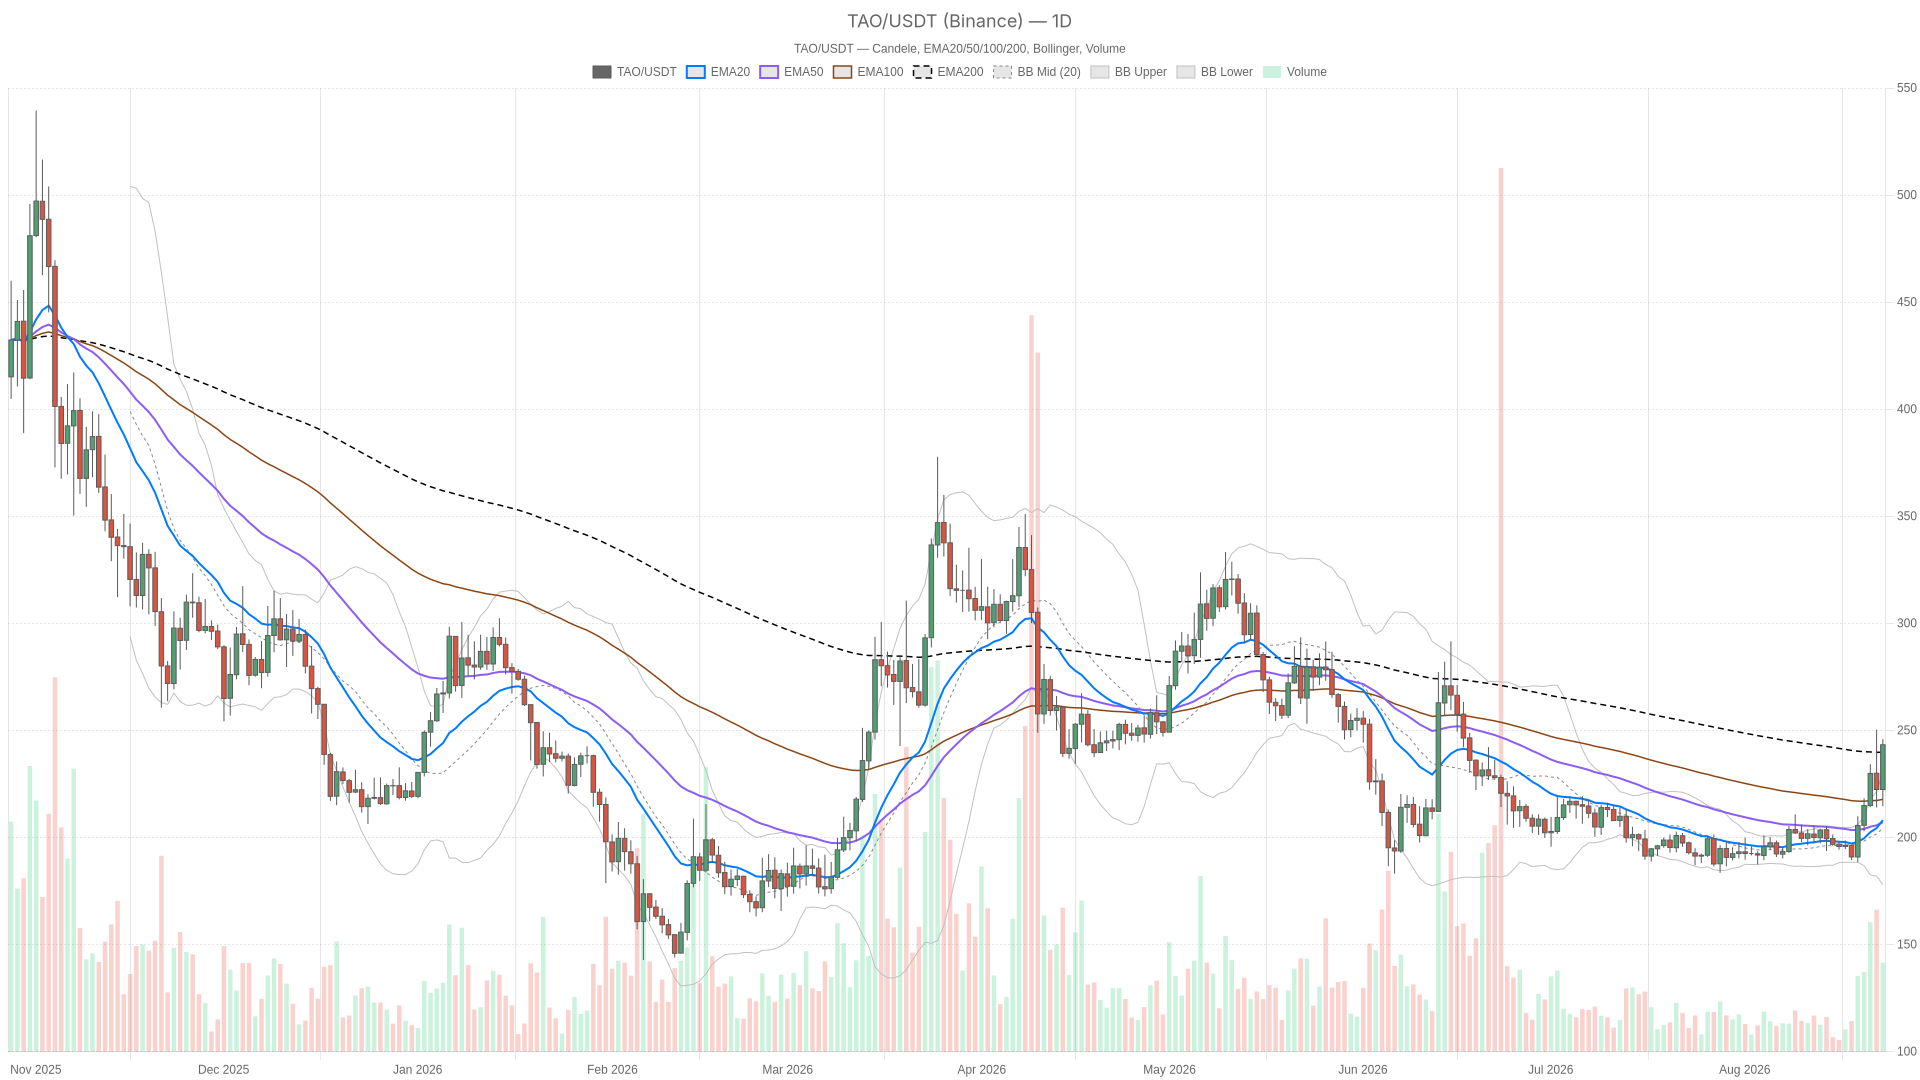
As of August 23, 2026, Bittensor crypto is trading at $243.3. It has just reclaimed its daily 200-period EMA after a sharp rally. The move has pushed the RSI deep into overbought territory at 72.13, setting up a tense moment for traders.
Summary
Key takeaways
- TAO trades at $243.3, sitting above the daily EMA200 of 239.8 after a rapid rally that outpaced short-term moving averages.
- Daily RSI at 72.13 signals firmly overbought conditions, mirrored on the hourly chart at 72.43.
- Total crypto market cap stands around $2.63 trillion, down 1.98% in 24 hours, with Bitcoin dominance elevated at 59.16%.
- The Fear & Greed Index at 66 (Greed) supports risk appetite, but high BTC dominance limits altcoin follow-through.
- A daily ATR of 13.36 points suggests that double-digit swings in either direction can materialize quickly.
The Daily Picture: Overbought Push Above EMA200
On the daily chart, TAO’s EMA20 at 208.09 and EMA50 at 207.17 sit more than 35 points below the current price. That gap reveals this was not a slow grind higher. It was an aggressive move that outran its own short-term averages. The EMA200 at 239.8 has just been reclaimed, which supports a bullish long-term bias. However, the daily regime reading remains neutral, and the indicators explain why.
The daily RSI at 72.13 sits firmly in overbought territory. The MACD confirms the picture, with the line at 6.99 well above the signal at 2.37 and a histogram of 4.62. That is genuine bullish momentum, but the kind that often precedes a cooling-off period. Meanwhile, price at 243.3 trades above the daily upper Bollinger Band of 230.51, with the mid-band at 204.24 and the lower band at 177.97.
However, being outside the upper band on the daily timeframe is a classic sign of an overextended move. It is not necessarily a reversal signal, but a warning that mean reversion risk is building. The daily ATR of 13.36 reinforces that this asset can move fast. A single average daily range swing could send price back toward pivot support at 223.3, or up toward resistance at 254.6, with the pivot point itself at 234.6.
Hourly Chart Confirms the Trend, But Momentum Is Thinning
The 1H chart is unambiguously bullish in structure. EMA20 at 233.2 sits above EMA50 at 227.86, which sits above EMA200 at 213.9, and price trades above all three. RSI at 72.43 mirrors the daily overbought condition. Moreover, the MACD histogram of 1.91, with the line at 5.11 versus the signal at 3.19, confirms upside momentum remains technically intact on this timeframe.
The hourly pivot cluster is tight. Pivot sits at 243.53, resistance at 244.97, and support at 241.87. This tells you price is coiling right at a decision point rather than trending cleanly in either direction. On the 15-minute chart, however, the picture shifts. RSI has cooled to 64.56, still bullish but notably less stretched. More importantly, the MACD histogram has flipped negative at -0.13, with the line at 3.06 dipping just under the signal at 3.19.
That is a small but real signal that short-term momentum is fading right as price presses against the top of its recent range. The daily and hourly timeframes remain constructively bullish. Yet the lowest timeframe is already showing early signs of exhaustion. That does not invalidate the bigger trend, but it argues against chasing strength blindly at current levels.
Bullish and Bearish Scenarios for TAO
The bullish case rests on the daily EMA200 reclaim holding. If price consolidates above 239.8 and holds the pivot zone around 234.6, the path of least resistance opens toward the daily R1 at 254.6. The bullish EMA stack across H1 and D1 provides structural support underneath. For this scenario to play out, buyers need to absorb the current overbought reading without a sharp flush. Essentially, they must digest gains sideways rather than giving them back.
The bearish, or mean-reversion, scenario builds on what is already visible on the 15-minute MACD: momentum fading at the point of maximum extension. With daily RSI at 72 and price above the upper Bollinger Band, a failure to hold the 234.6 pivot would expose a move down toward daily support at 223.3. Given the daily ATR of 13.36, that kind of retracement would not require an unusual move. It sits within the asset’s normal volatility range.
A deeper unwind that breaks S1 would put the gap back toward the 207-208 daily EMA cluster in play. That said, this would represent a much more significant correction than a routine pullback. This scenario gains weight if broader market cap continues sliding. Total crypto market cap is already down 1.98% over 24 hours. Additionally, Bitcoin dominance near 59% keeps capital away from altcoins like TAO.
Positioning, Risk and What to Watch
Right now, Bittensor crypto presents a textbook case of a strong trend meeting a stretched short-term condition. The daily and hourly structure both lean bullish. However, the overbought RSI readings across both timeframes, the price sitting above the daily upper Bollinger Band, and the early momentum fade on the 15-minute MACD all argue for caution. Volatility here is real. A daily ATR north of 13 points means swings in either direction can happen quickly.
The tight hourly pivot range, from 241.87 to 244.97, suggests the market is currently deciding its next move rather than committing to one. With Fear & Greed at 66 and BTC dominance elevated, sentiment and capital flows are not fully aligned in TAO’s favor. That is true even though its own chart structure looks constructive. It is the kind of environment where patience around key levels matters more than reacting to every intraday swing.
Whatever happens next, overbought conditions can persist longer than expected in strong trends. That said, they rarely resolve without at least some volatility along the way. The 234.6 daily pivot on the downside and the 254.6 R1 on the upside are the levels that matter most right now.
FAQ
What does the overbought RSI mean for TAO?
An RSI reading above 70, such as TAO’s daily 72.13, signals that the asset may be overextended after a rapid price surge. It does not guarantee an immediate reversal, but it indicates that mean reversion risk is building. In strong trends, overbought conditions can persist, though they are often followed by periods of consolidation or pullbacks.
Can TAO continue rising despite being overbought?
Yes, overbought conditions do not automatically halt a rally. If buyers absorb the current levels through sideways consolidation above the EMA200 at 239.8, the path toward the daily R1 at 254.6 remains open. The bullish EMA structure on both the daily and hourly timeframes provides technical support for continuation, but momentum fading on lower timeframes warrants caution.
What are the key levels to watch for TAO?
The most important levels are the 234.6 daily pivot on the downside and the 254.6 R1 resistance on the upside. A failure to hold 234.6 would expose support at 223.3. Below that, the EMA cluster around 207-208 becomes relevant. The tight hourly pivot range between 241.87 and 244.97 represents the immediate decision zone.
How does Bitcoin dominance affect TAO?
With Bitcoin dominance at 59.16%, capital remains concentrated in BTC rather than rotating aggressively into altcoins. This limits follow-through for assets like TAO, even when sentiment is positive. The Fear & Greed Index at 66 shows risk appetite is present, but high dominance means altcoin rallies face additional headwinds from constrained capital flows.
Disclaimer: This article is for informational purposes only and does not constitute financial advice, an investment recommendation, or a solicitation to buy or sell any financial instrument or cryptocurrency. The analysis provided is not indicative of future results. Investing in crypto assets and financial markets carries a high risk of capital loss. Always do your own research (DYOR) and consult a qualified financial advisor before making any decision.
Article produced with the assistance of artificial intelligence and reviewed by the editorial team.
