



SELLAS Life Sciences Group, Inc stock closed at 15.46, surging more than 20% over five sessions on volume of 15.2 million shares. The move caps three straight weeks of gains — the stock’s best week since early July — and marks an aggressive continuation of a building uptrend.
Summary
Key takeaways
- SLS closed at 15.46, above the daily upper Bollinger Band of 14.65
- RSI14 sits at 69.8, just below the classic overbought threshold
- All three timeframes (daily, 1H, 15m) register a bullish regime with aligned EMA stacks
- Daily pivot at 14.8, with R1 resistance at 16.33 and S1 support at 13.92
- The rally is partly fueled by unconfirmed REGAL trial developments
Momentum and Volatility Signals on the SLS Stock Chart
Across the daily chart, momentum on the SLS stock chart is strong but approaching overbought territory. Volatility has expanded alongside the rally, keeping both breakout and pullback risks elevated.
Daily Trend Structure and EMA Alignment
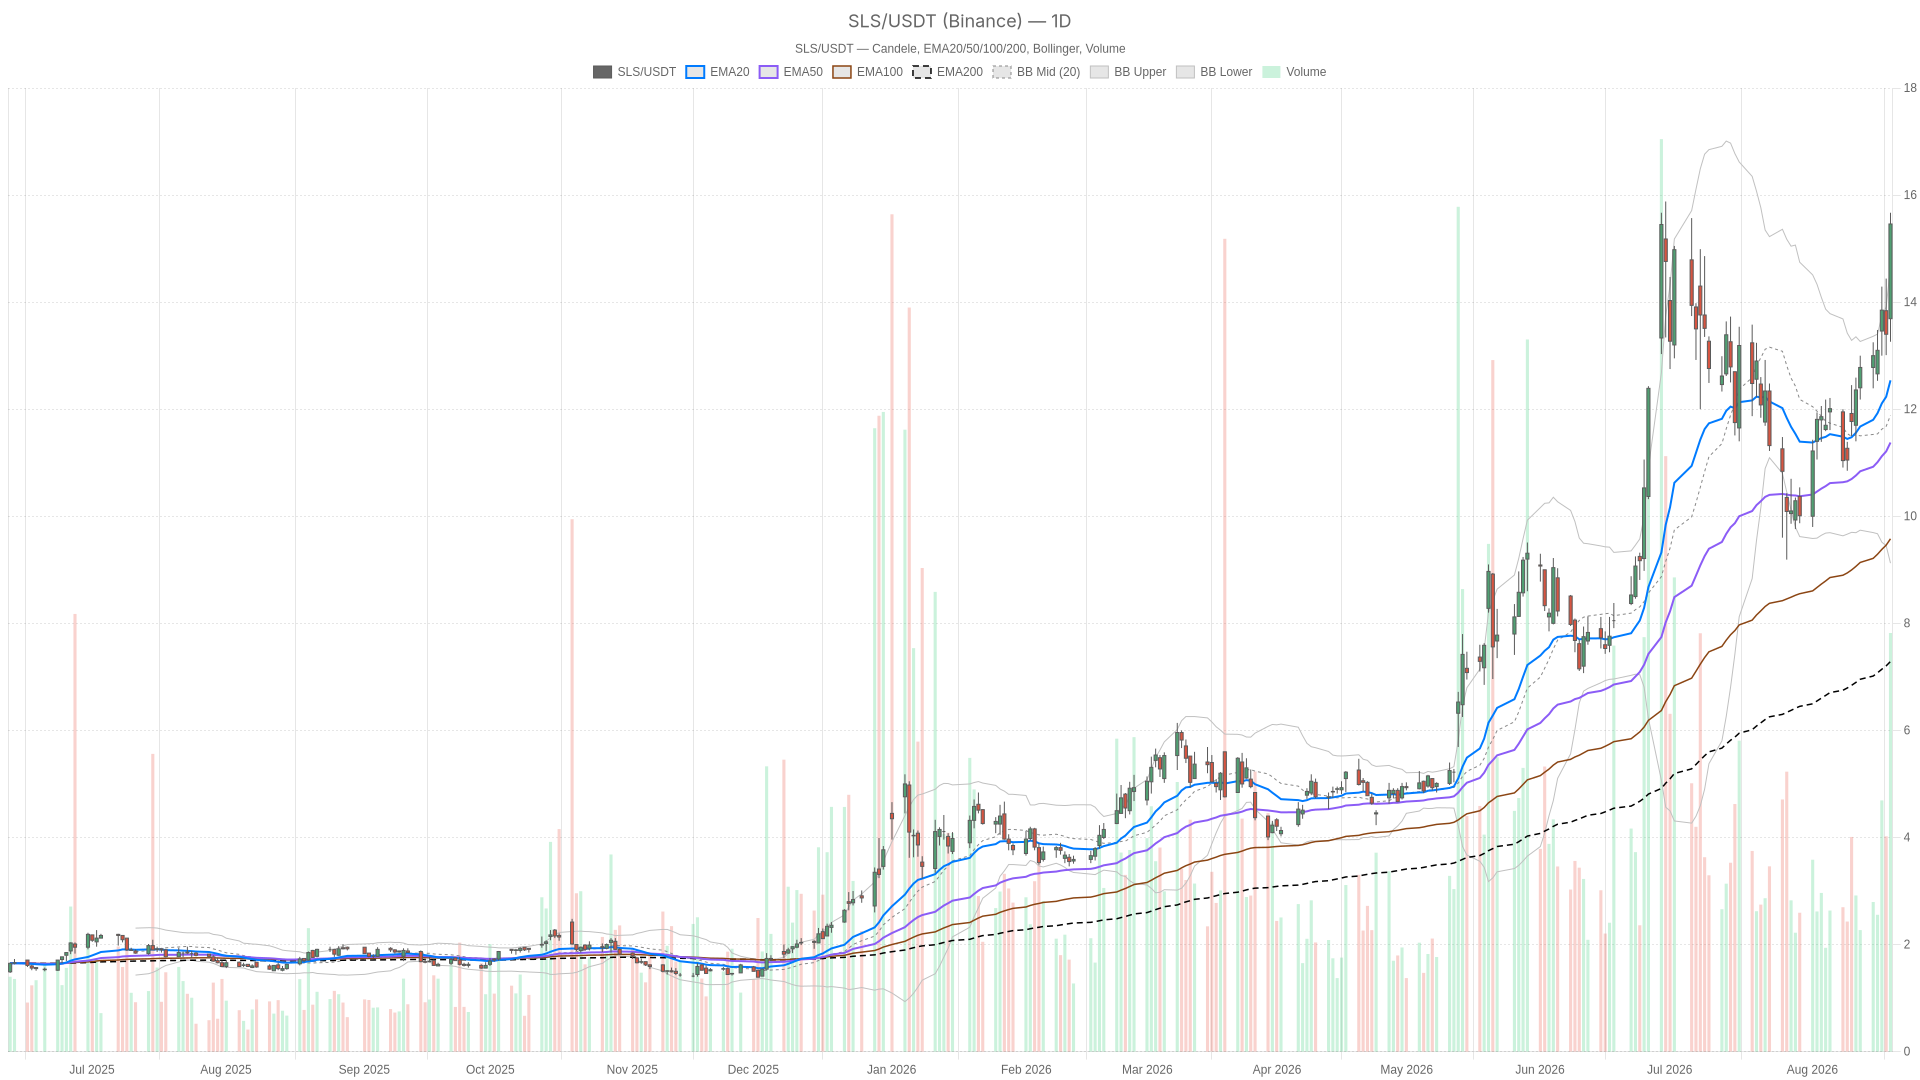
The daily timeframe shows an unambiguously bullish regime. The 20-day EMA at 12.54 sits above the 50-day EMA at 11.38. Both sit well above the 200-day EMA at 7.29. This is a textbook uptrend stack, with short-term price action leading the longer-term trend by a wide margin. The rally is not a one-day spike on a flat base — it is a trend that has been building for weeks.
Overbought Readings and Bollinger Band Extension
Momentum is strong, arguably too strong. The RSI14 reading of 69.8 sits just below the classic overbought threshold of 70. Meanwhile, daily MACD shows the line at 0.69 comfortably above the signal at 0.36, with a positive histogram of 0.33. That combination confirms upward momentum is intact. However, it also flags that buyers have pushed the tape aggressively in a short window.
Bollinger Bands reinforce that read. The daily close at 15.46 is trading above the upper band of 14.65, with the mid-band at 11.89. Price stretched above the upper band typically signals an extended move rather than a broken trend. Still, it does raise the odds of a pause or pullback toward the band.
Volatility has also expanded. The daily ATR14 sits at 1.05 — a meaningful figure relative to a stock trading in the mid-teens. It confirms that price swings have widened alongside the rally. Daily pivot levels put the pivot point at 14.8, with resistance at 16.33 (R1) and support at 13.92 (S1). Those levels frame the near-term battle. A clean push through 16.33 would extend the bullish structure. A slip back under 13.92 would start to challenge it.
What the 1H Timeframe Adds to the SLS Picture
The 1-hour chart confirms the bullish bias but reveals sharper overbought conditions and decelerating intraday momentum. The H1 regime is also bullish. The EMA stack mirrors the daily setup: 20-EMA at 14.26 above the 50-EMA at 13.45, above the 200-EMA at 12.22.
Notably, RSI14 on the 1H climbs to 73.8, even more stretched than the daily reading. MACD on the hourly remains positive, with the line at 0.55 above the signal at 0.42. However, the histogram has narrowed to 0.13 versus the daily’s 0.33. That narrowing is worth noting — it suggests intraday momentum is decelerating even as the broader trend stays intact.
Bollinger Bands on the 1H add to that nuance. Price closed at 15.46, right at the upper band of 15.48, with the mid-band at 14.17. The hourly chart is pressing directly against its ceiling. Combined with an ATR14 of 0.56, this points to a market that has run hard in a short window. It is now testing resistance in real time. The H1 pivot levels are tight: pivot at 15.37, R1 at 15.58, S1 at 15.26. This frames a narrow near-term range where any breakout or breakdown could move quickly.
15-Minute Execution Context for SLS Stock
The 15-minute chart shows intraday momentum stalling at resistance, with a flat MACD histogram at 0. Price sits well above the EMA20 at 15.01 and the EMA50 at 14.47. The EMA200 at 13.35 remains far below — still a clean bullish stack.
RSI14 at 69.74 mirrors the daily reading closely, staying just under overbought territory. Notably, the 15m MACD histogram sits flat at 0, with the line and signal both at 0.36. That flattening signals intraday momentum has stalled right at resistance. Still, the broader structure across all three timeframes remains bullish. For execution purposes, the 15m pivot resistance at 15.58 and support at 15.26 mark the immediate battle lines. These are the levels intraday traders are watching.
The Bullish Case for SLS
The bullish case rests on trend continuation across all three timeframes, supported by consistent EMA alignment and oncology sector tailwinds. The EMA alignment across daily, hourly, and 15-minute charts is consistent — shorter averages sit above longer ones in every case.
Anticipated REGAL trial data has been a key catalyst. Cancer vaccine sector spillover following Moderna and Merck’s Phase 3 update has added momentum. A broader oncology rally rounds out the tailwinds. If price clears the daily R1 at 16.33 with volume support, that would reinforce the uptrend. It would open room toward further upside continuation. This is especially true if RSI cools slightly from overbought levels without breaking trend structure.
The Bearish Case for SLS and What Would Invalidate the Rally
The bearish case centers on exhaustion, with the rally extended above upper Bollinger Bands and built partly on unconfirmed trial catalysts. Retail skepticism has been noted in recent coverage, with a German report claiming Regal hit its 80th event — still unconfirmed by the company itself. That kind of unverified catalyst is a fragile foundation.
Fundamentally, SELLAS reported a second-quarter 2026 net loss of $9.61 million, with basic loss per share of $0.05. First-half 2026 net loss reached $18.01 million, or $0.10 per share. Valuation commentary has flagged the stock as expensive following a roughly 7.9x three-year return, which raises the bar for further upside.
A daily close back below S1 support at 13.92 would be an early warning sign. A breakdown through the 1H EMA20 at 14.26 would also signal the bullish structure is cracking. Therefore, a failure to hold above the daily pivot at 14.8 would be the clearest warning. It would signal that momentum is fading rather than pausing.
Closing Take on SLS Stock Positioning
Overall, SELLAS Life Sciences Group, Inc stock sits in a high-momentum, high-risk setup with both trend strength and overbought fragility in play. The daily trend is bullish and confirmed by the hourly chart. However, both timeframes show overbought readings and price pressing against upper Bollinger Bands.
Meanwhile, the 15-minute MACD flattening at resistance suggests the immediate push higher may need a breather before extending further. Given the elevated ATR readings across timeframes, volatility is likely to stay wide in either direction. Positioning here demands respect for both the strength of the trend and the fragility of the rally. It is built partly on unconfirmed trial reports and stretched valuation metrics. Uncertainty remains the dominant theme until price decisively resolves above daily R1 or breaks back below the S1 support zone.
FAQ
What is the current trend for SLS stock?
All three timeframes — daily, 1-hour, and 15-minute — currently register a bullish regime. The EMA stack is consistently aligned, with the 20-day EMA at 12.54 above the 50-day EMA at 11.38, and both well above the 200-day EMA at 7.29. The stock has gained more than 20% over the past five sessions.
What are the key resistance and support levels for SLS?
On the daily timeframe, the pivot point sits at 14.8, with R1 resistance at 16.33 and S1 support at 13.92. On the 1-hour chart, pivot is at 15.37 with R1 at 15.58 and S1 at 15.26. A close above 16.33 would extend the bullish structure, while a breakdown below 13.92 would challenge it.
What would invalidate the bullish case for SLS stock?
A daily close below S1 support at 13.92 or a breakdown through the 1H EMA20 at 14.26 would be early warning signs. The clearest technical invalidation signal would be a failure to hold above the daily pivot at 14.8, indicating momentum is fading rather than pausing.
Disclaimer: This article is for informational purposes only and does not constitute financial advice, an investment recommendation, or a solicitation to buy or sell any financial instrument or cryptocurrency. The analysis provided is not indicative of future results. Investing in crypto assets and financial markets carries a high risk of capital loss. Always do your own research (DYOR) and consult a qualified financial advisor before making any decision.
Article produced with the assistance of artificial intelligence and reviewed by the editorial team.
