




Walmart stock suffered one of its roughest sessions in years, closing at $103.84 on August 20 after U.S. comparable sales decelerated sharply to 2.6%, missing Wall Street’s ~3.7% estimate. The earnings shock has reshaped the technical picture across every timeframe.
Summary
Key takeaways
- Walmart stock closed at $103.84 on August 20 after U.S. comparable sales growth slowed to 2.6%, well below the ~3.7% Wall Street had modeled and down sharply from 4.8% a year earlier.
- Daily RSI14 sits at 29.78, approaching oversold territory, while price has broken below the lower Bollinger Band at $107.18 — a genuine volatility expansion signal.
- Hourly RSI14 at 21.41 confirms intense short-term selling pressure, with the MACD histogram still widening to the downside rather than showing exhaustion.
- A recovery above the daily pivot at $104.55 is needed for bulls to regain control; a break below support at $102.14 would open the door to further downside.
- Revenue of $187.9 billion still beat estimates, giving bulls a fundamental anchor for any potential relief bounce despite the bearish technical structure.
Daily Chart: Structural Damage for Walmart Stock After Earnings
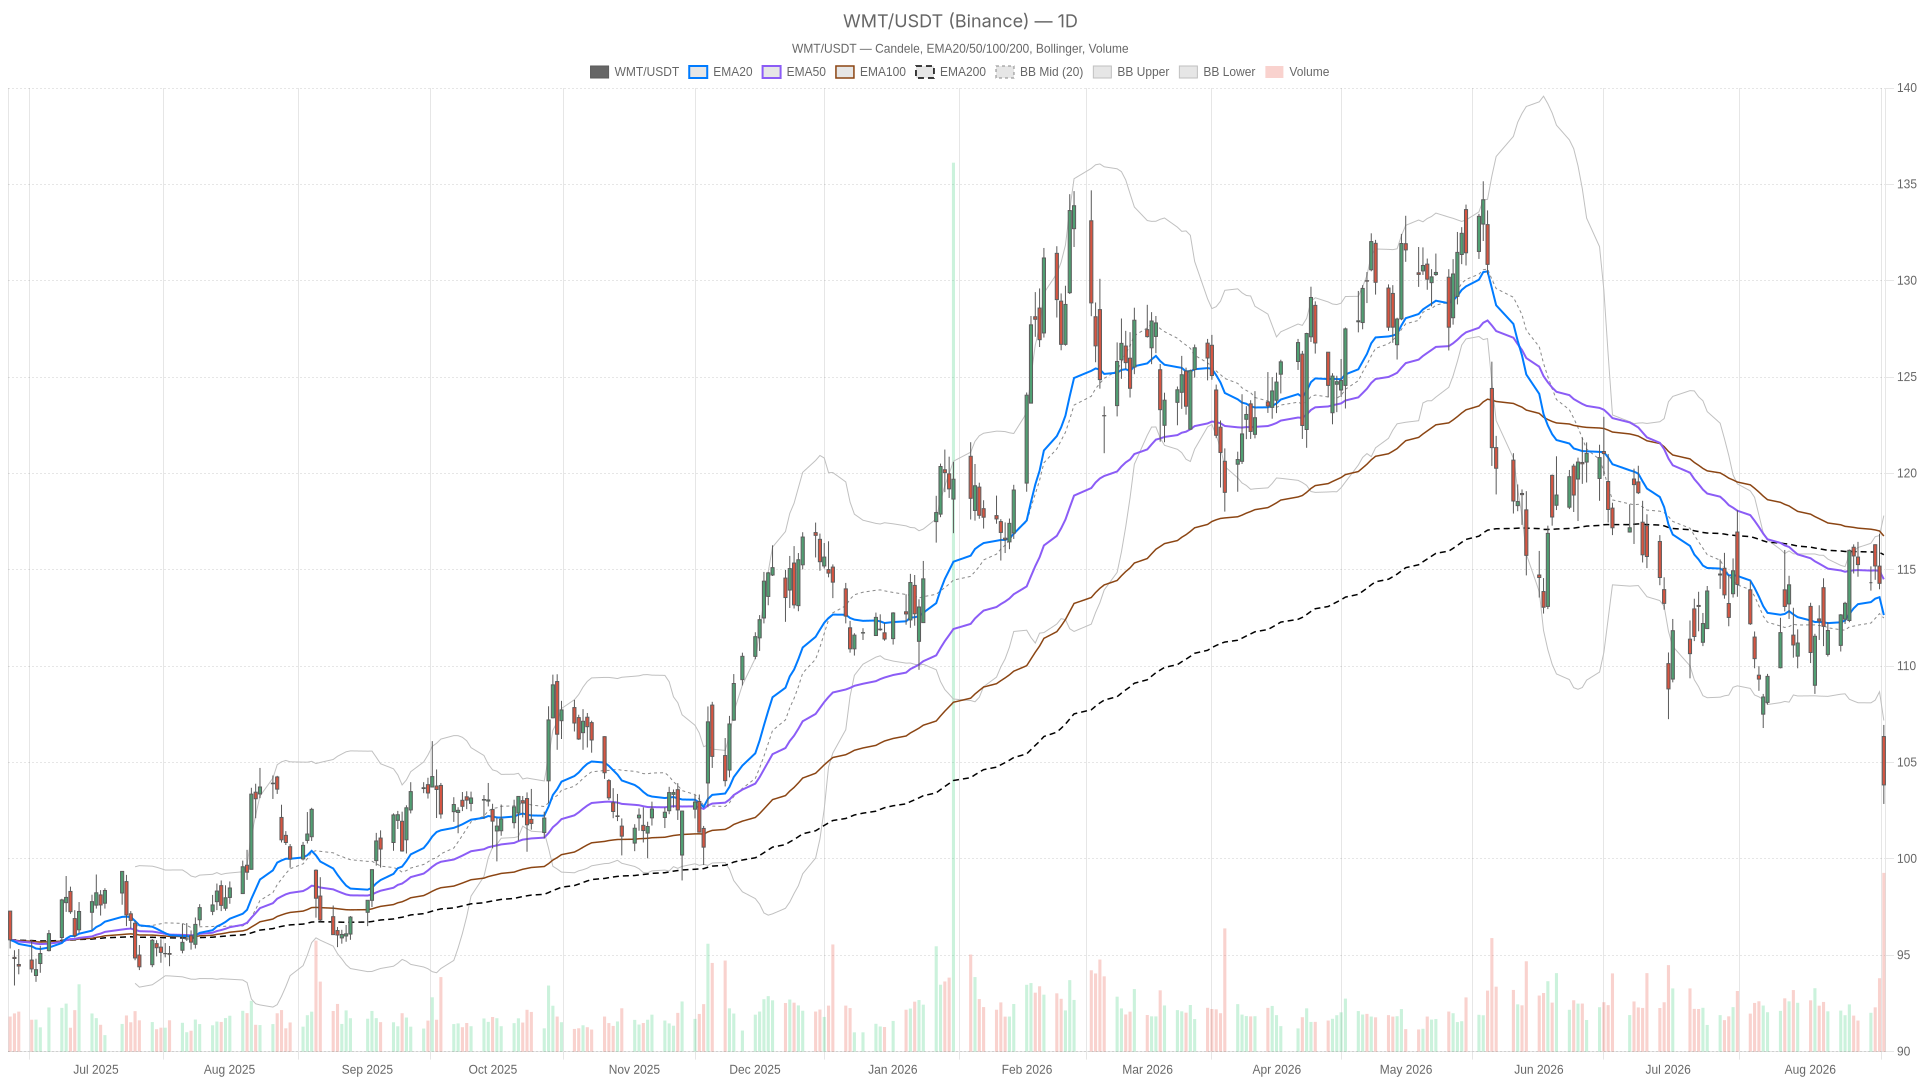
The damage to Walmart stock on the daily chart is structural, not cosmetic. Price is trading at $103.84, well below the EMA20 at $112.65, the EMA50 at $114.51, and the EMA200 at $115.78.
That is a clean bearish stack. Short-term averages sit beneath longer-term ones, confirming the daily regime is officially bearish.
RSI14 sits at 29.78, approaching oversold territory. However, it has not yet reached an extreme reading that would typically force a mean-reversion bounce on its own.
The daily MACD line at -0.5 sits below its signal at -0.2, with a histogram of -0.3. This means bearish momentum is present and has room to extend rather than fade.
Perhaps the most telling signal comes from the Bollinger Bands. The mid-band sits at $112.50, the upper band at $117.81, and the lower band at $107.18. Walmart’s close of $103.84 is now trading below the lower band entirely, signaling a genuine volatility expansion event rather than routine noise.
Meanwhile, ATR14 has climbed to 2.94, confirming that daily ranges have widened considerably compared to recent history.
The daily pivot sits at $104.55, with resistance at $106.24 and support at $102.14. Those two levels — the pivot above and S1 below — now frame the immediate battlefield for price.
Hourly Timeframe: Momentum Still Points Lower for Walmart Stock
The hourly chart reinforces rather than softens the bearish case for Walmart stock. Price at $103.83 remains under the EMA20 ($109.39), EMA50 ($111.94), and EMA200 ($112.78), the same descending structure seen on the daily.
RSI14 on this timeframe has dropped to 21.41. This genuinely oversold reading suggests selling pressure has been intense and possibly overextended in the very short run.
However, the MACD tells a story of accelerating weakness rather than exhaustion. The MACD line sits at -3.11 against a signal line of -1.97. That produces a histogram of -1.14, wider than the daily histogram. Momentum is still building to the downside on an hourly basis.
The hourly Bollinger Bands have widened dramatically too. The upper band sits at $122.70 and the lower band at $100.01 around a mid-band of $111.36. That kind of band expansion reflects the shock nature of the earnings reaction.
In short, the hourly pivot at $103.71, with resistance at $104.41 and support at $103.12, sits right on top of current price. The next few hours of trading will likely decide short-term direction.
15-Minute Chart: Short-Term Stabilization, Not Reversal
The 15-minute chart shows early signs of stabilization for Walmart stock. However, nothing changes the broader bearish picture.
RSI14 has ticked up to 32.82 from the deeper oversold readings seen on the hourly chart. Meanwhile, the MACD histogram has turned slightly positive at 0.38. The MACD line at -1.53 has crossed above its signal line at -1.91.
That is a short-term momentum shift worth noting for execution purposes. Still, it remains a small, tactical signal within a much larger bearish structure. The 15m EMA200 at $112.14 is still miles above current price.
At the same time, Bollinger Bands on the 15-minute chart are notably tight. The mid-band sits at $103.65, the upper band at $104.47, and the lower band at $102.83. Price sits almost exactly at the mid-line.
That compression, combined with an ATR14 of just 0.42, suggests the market is pausing to digest the initial shock. It is not yet committing to a fresh directional move. The 15m pivot at $103.75, with resistance at $104.37 and support at $103.22, gives short-term traders tight reference points for any bounce attempt.
Bullish Scenario: What It Would Take to Turn Walmart Stock Around
For a genuine bullish case to develop, Walmart stock would need to reclaim the daily pivot at $104.55 and hold above it convincingly.
A push back above the hourly EMA20 near $109.39 would be a much stronger signal that the selling has run its course. The oversold hourly RSI at 21.41 does raise the odds of a near-term relief bounce. The fact that revenue actually beat estimates at $187.9 billion gives bulls something fundamental to lean on.
If short-term momentum on the 15-minute chart — where MACD has already turned marginally positive — extends into the hourly timeframe, that would be an early tell that buyers are stepping back in. Still, this would likely be a technical bounce within a downtrend. A full trend reversal would require meaningful improvement in the daily EMA structure.
Bearish Scenario: Downside Risk Remains in Control for Walmart Stock
The bearish case for Walmart stock is currently better supported by the weight of evidence across timeframes.
Daily price has broken decisively below the lower Bollinger Band at $107.18. Both the daily and hourly MACD histograms remain negative. Notably, the hourly histogram is actually deeper than the daily one.
That divergence in momentum intensity suggests sellers pressed harder on the hourly chart than the daily one initially captured. A break of the daily support at $102.14 would open the door to further downside, especially with ATR14 at 2.94 confirming that larger daily ranges are now the norm.
The underlying narrative reinforces the technical breakdown. Comps growth is at its slowest pace since roughly 2020. Meanwhile, comparisons to Target’s stronger traffic and improving business trajectory reinforce the view that this is a fundamental repricing of Walmart’s near-term growth outlook.
A failure to reclaim the 15-minute EMA20 at $104.47 would invalidate any early bullish attempt and confirm sellers remain in control.
Walmart Stock Positioning: Closing Thoughts
Overall, the picture across daily, hourly, and 15-minute timeframes is largely aligned on the bearish side for Walmart stock. The only conflicting signal comes from the 15-minute chart’s tentative momentum stabilization.
That divergence matters for execution timing but does not yet challenge the dominant daily bias. Meanwhile, elevated ATR readings on both the daily and hourly charts point to a market that is more volatile than usual right now. This raises the stakes for position sizing regardless of directional view.
Given the fresh earnings-driven repricing, the slowing comps trend, and the technical breakdown below key moving averages, caution remains warranted. Price action needs to prove it can reclaim the pivot levels highlighted above. This analysis is for informational purposes only and does not constitute financial advice.
FAQ
Why did Walmart stock drop so sharply?
Walmart stock fell after the company reported U.S. comparable sales growth of just 2.6%, well below the ~3.7% Wall Street expected and down sharply from 4.8% a year earlier. This signaled slowing consumer traffic and spending trade-offs that spooked investors despite revenue of $187.9 billion beating estimates.
Is Walmart stock oversold and due for a bounce?
The hourly RSI14 has dropped to 21.41, which is genuinely oversold and raises the odds of a short-term relief bounce. The 15-minute MACD has also turned marginally positive. However, the daily bearish EMA stack and persistently negative MACD histograms suggest any bounce would likely be technical rather than a full trend reversal.
What are the key levels to watch for Walmart stock?
The daily pivot at $104.55 and resistance at $106.24 are the levels bulls need to reclaim for any credible recovery. On the downside, support at $102.14 is critical — a break below could accelerate selling pressure given elevated ATR14 readings at 2.94.
How does Walmart’s performance compare to competitors?
Walmart’s 2.6% comparable sales growth contrasts with Target’s stronger traffic and improving business trajectory. This divergence reinforces the view that the sell-off reflects a fundamental repricing of Walmart’s near-term growth outlook, not merely a technical event.
Disclaimer: This article is for informational purposes only and does not constitute financial advice, an investment recommendation, or a solicitation to buy or sell any financial instrument or cryptocurrency. The analysis provided is not indicative of future results. Investing in crypto assets and financial markets carries a high risk of capital loss. Always do your own research (DYOR) and consult a qualified financial advisor before making any decision.
Article produced with the assistance of artificial intelligence and reviewed by the editorial team.
