




Mara Holdings stock surged 15.54% to $11.15 on Thursday, fueled by Trump’s push for the Clarity Act. The rally reignited risk appetite across crypto-linked equities. Yet the question remains: is this a genuine trend reversal, or just a sharp bounce within a fragile daily structure?
Summary
Key takeaways
- MARA closed at $11.15, up 15.54% in its sharpest single-session move in recent memory.
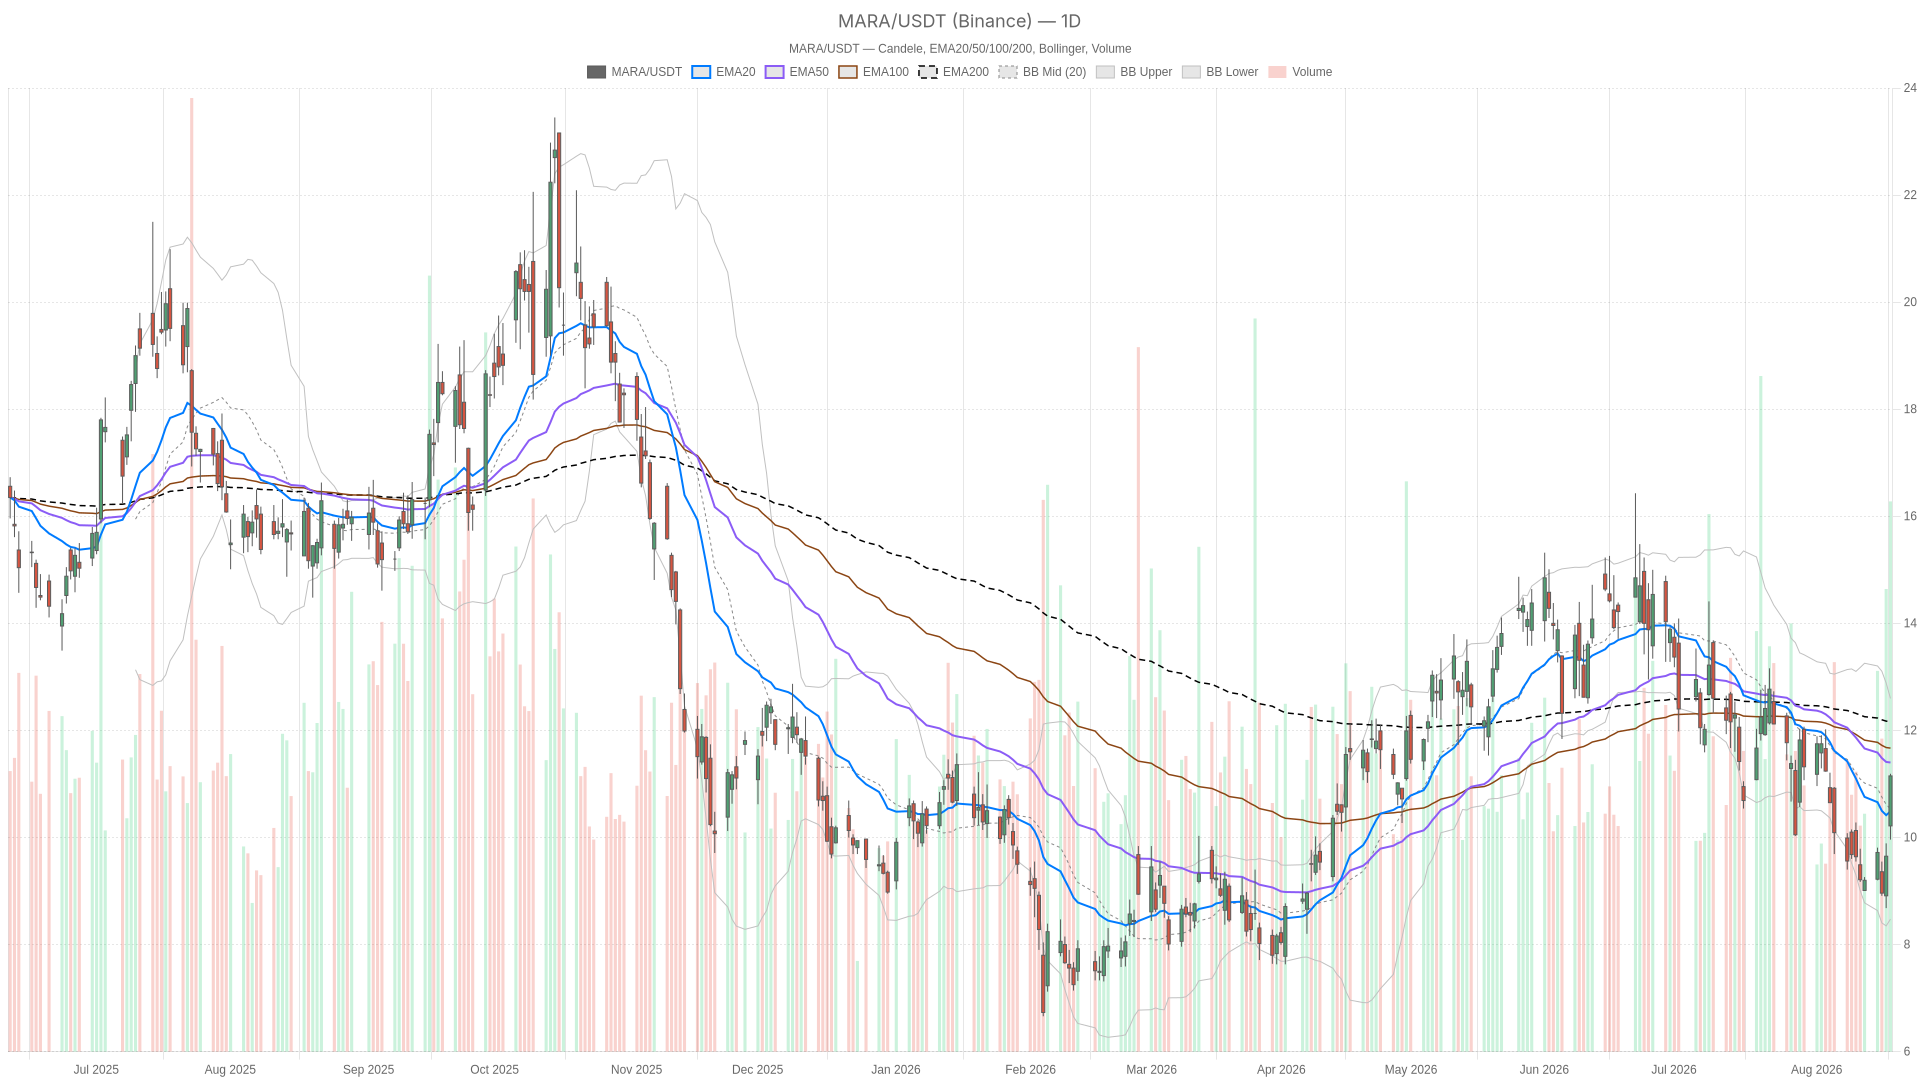
- Price sits above the 20-day EMA at $10.49 but below the 50-day EMA at $11.40 and the 200-day EMA at $12.16.
- Daily RSI14 at 52.35 signals neutral conditions, while 1H RSI14 at 74.96 is deep in overbought territory.
- Daily ATR14 of $0.80 confirms MARA remains a high-volatility name with sharp moves in either direction.
- CEO Fred Thiel sold $253,000 in shares, while valuation concerns persist despite growing AI lease plans.
Daily Structure Still Faces Overhead Resistance
Thursday’s rally has not yet broken the broader technical ceiling capping Mara Holdings stock. The daily chart shows a stock fighting to escape a longer-term downtrend rather than one confirmed in bullish territory.
Price closed comfortably above the 20-day EMA at $10.49. However, it remains below both the 50-day EMA at $11.40 and the 200-day EMA at $12.16. That alignment matters. The rally, however impressive, has not cleared the key moving averages that define trend health.
RSI14 on the daily sits at 52.35. This neutral reading reflects a market recovering from oversold conditions rather than one overheating.
MACD remains slightly negative at -0.65 versus a signal line of -0.73. However, the histogram has turned positive at 0.07. In practical terms, this signals early momentum shifting, not yet a confirmed bullish crossover.
The Bollinger Bands add useful context. With the mid-band at $10.54 and the upper band at $12.60, price has room to extend higher before hitting statistical resistance. Meanwhile, daily ATR14 of $0.80 confirms just how volatile MARA remains.
The daily pivot sits at $10.77, with resistance at R1 $11.57 and support at S1 $10.34. Notably, Thursday’s close sits between the pivot and R1. This suggests bulls have regained short-term control, even if the broader daily regime remains neutral.
1H Momentum Confirms the Short-Term Push, But Overbought Signals Emerge
The 1-hour chart confirms bullish momentum but warns of overbought conditions. Intraday buyers remain in control, yet the rally looks increasingly stretched.
Turning to the 1-hour chart, the picture for MARA becomes more constructively aligned. Price trades above the 20, 50, and 200-period EMAs — at $10.13, $9.89, and $10.98 respectively — a textbook bullish stack.
MACD on this timeframe is firmly positive. The line at 0.42 stands above a signal of 0.25, reinforcing that intraday buyers remain in control. At the same time, RSI14 on the 1-hour chart has pushed to 74.96, deep into overbought territory.
This is where the conflict between timeframes starts to surface. The 1H trend confirms the bullish thrust seen on the daily close. Yet the overbought RSI reading warns that the move may be stretched in the near term.
Price is also pressing against the 1H upper Bollinger Band at $11.36, with the mid-band at $9.84. This is another sign the rally has advanced quickly relative to its recent range.
The 1H pivot structure supports this near-term tension. Pivot point sits at $11.09, with R1 at $11.25 and S1 at $10.98.
Price closing right at $11.15 places it inside a tight band between pivot and resistance. Short-term direction could hinge on whether buyers can clear R1 or profit-taking pulls price back toward the pivot.
15-Minute Execution Context: Momentum Cooling After the Spike
The 15-minute chart reveals short-term momentum cooling even as the broader trend remains intact. For Mara Holdings stock, this suggests limited room for further immediate extension without a pause.
On the 15-minute chart, the regime is explicitly labeled bullish. EMA20, EMA50, and EMA200 are stacked at $10.75, $10.30, and $9.86 respectively. That alignment reflects the strength of Thursday’s intraday advance.
However, RSI14 at 71.52 remains elevated. More tellingly, the MACD histogram has slipped negative at -0.01. The MACD line at 0.24 sits just below its signal at 0.25.
This is an early sign of short-term momentum cooling. Yet the broader 15-minute trend remains intact.
Price is also pressing against the 15-minute upper Bollinger Band at $11.09. ATR14 has compressed to just $0.15, signaling that volatility is contracting after the initial burst higher. For intraday positioning, this points to limited room for further extension without a shallow pullback first.
Bullish Scenario
The bullish case depends on Mara Holdings stock holding above key support while reclaiming the 50-day EMA. A break above R1 would strengthen the reversal argument considerably.
The bullish case rests on the stock holding above the daily pivot at $10.77 and, ideally, above the 20-day EMA at $10.49. The next objective is reclaiming the 50-day EMA at $11.40.
A daily close above R1 at $11.57 would strengthen the argument. It would suggest the MACD histogram’s turn toward positive territory is the start of a more durable shift rather than a one-day spike.
On the news side, continued legislative progress on the Clarity Act would likely keep sentiment supportive for crypto-mining equities. Meanwhile, broader market stabilization could add a favorable macro backdrop, with futures climbing after this week’s selloff tied to rising Treasury yields.
Bearish Scenario
The bearish case centers on overbought signals and insider selling weighing on Mara Holdings stock. Failure to clear the 50-day EMA would keep the broader downtrend firmly intact.
The bearish case centers on the stock failing to hold above 1H support around the $10.98 pivot area, or the 20-period 1H EMA near $10.13. A rejection here, combined with already overbought RSI readings, would support a near-term pullback narrative.
This case is reinforced by two non-technical factors. First, Mara Holdings CEO Fred Thiel sold $253,000 in shares — an insider transaction that can weigh on sentiment even when small in size. Second, a separate Yahoo Finance piece noted that MARA still looks expensive on valuation grounds despite growing AI lease plans.
Should the daily chart fail to clear the 50-day EMA at $11.40, the broader downtrend structure would remain intact. The 200-day EMA at $12.16 would stay the dominant technical ceiling.
Closing Take on Mara Holdings Stock
Mara Holdings stock is caught between a powerful short-term rally and a daily trend that has not confirmed a reversal. Positioning here requires caution around overhead resistance.
Overall, the 1H and 15m timeframes both confirm the strength of Thursday’s move. The bullish intraday thrust is not in question.
However, elevated RSI readings on both timeframes suggest the advance may need to consolidate. The softening MACD histogram intraday reinforces this view. Positioning calls for caution around the overhead daily resistance at $11.40 and $12.16.
Daily ATR of $0.80 confirms this remains a high-volatility name. Sharp moves in either direction should be expected. Given the mix of a supportive news catalyst, insider selling, and valuation concerns, uncertainty around the next directional move remains elevated.
FAQ
What drove Mara Holdings stock’s 15.54% surge on Thursday?
President Trump’s push to Congress to accelerate passage of the Clarity Act reignited risk appetite across crypto-linked equities, fueling a sharp rally in MARA that pushed shares to $11.15.
What are the key resistance levels for Mara Holdings stock?
The 50-day EMA at $11.40 and the 200-day EMA at $12.16 form the primary overhead resistance. The daily R1 pivot sits at $11.57, and a close above that level would strengthen the bullish case.
Is MARA showing overbought signals after the rally?
Yes. The 1H RSI14 reached 74.96 and the 15m RSI14 hit 71.52, both in overbought territory. This suggests the move may be stretched in the near term and could require consolidation before extending higher.
What bearish factors are weighing on Mara Holdings stock?
CEO Fred Thiel sold $253,000 in shares, an insider transaction that can weigh on sentiment. Additionally, a Yahoo Finance analysis flagged that MARA still looks expensive on valuation grounds despite its growing AI lease plans.
Disclaimer: This article is for informational purposes only and does not constitute financial advice, an investment recommendation, or a solicitation to buy or sell any financial instrument or cryptocurrency. The analysis provided is not indicative of future results. Investing in crypto assets and financial markets carries a high risk of capital loss. Always do your own research (DYOR) and consult a qualified financial advisor before making any decision.
Article produced with the assistance of artificial intelligence and reviewed by the editorial team.
