




Webull Corporation stock finds itself in a post-earnings tug-of-war. The stock gapped sharply higher after a record Q2 2026 print, then surrendered much of that move by the close. A strong fundamental catalyst colliding with an extended technical setup defines the tension now facing BULL.
Summary
Key takeaways
- Webull posted record quarterly revenue of $198.8 million, up 51% year-on-year, with EPS beating estimates by 133.33%.
- BULL stock gapped sharply higher on earnings but printed a rejection candle, closing near the session low of $9.04.
- The daily RSI14 sits at 71.84 in overbought territory, while price trades above the upper Bollinger band.
- The 1-hour chart confirms a bullish EMA stack but flashes an RSI14 of 82.44, warning of near-term exhaustion.
- Key pivot resistance sits at $9.33–$9.34; support levels to watch are $8.73 (daily S1) and $7.82 (daily EMA20).
The numbers behind the move are hard to ignore. Webull posted record quarterly revenue of $198.8 million, up 51% year-on-year, with trading-related revenue jumping 66% to $147.7 million. Earnings per share came in at $0.05, beating estimates by 133.33%, while revenue surprised to the upside by 13.62%. Management pointed to the elimination of the Pattern Day Trader rule as a genuine turning point for trading volumes. Shares were reported up 11% after-hours in the immediate reaction. That is a real catalyst, not noise.
Webull Corporation Stock Technical Picture
Webull Corporation stock presents a bullish daily trend structure that conflicts with clear overbought exhaustion signals. The earnings-driven gap produced strong momentum, but the intraday price rejection raises genuine questions about near-term sustainability. This tension between trend and momentum defines the technical outlook.
Daily Structure: A Meaningful Rejection Candle
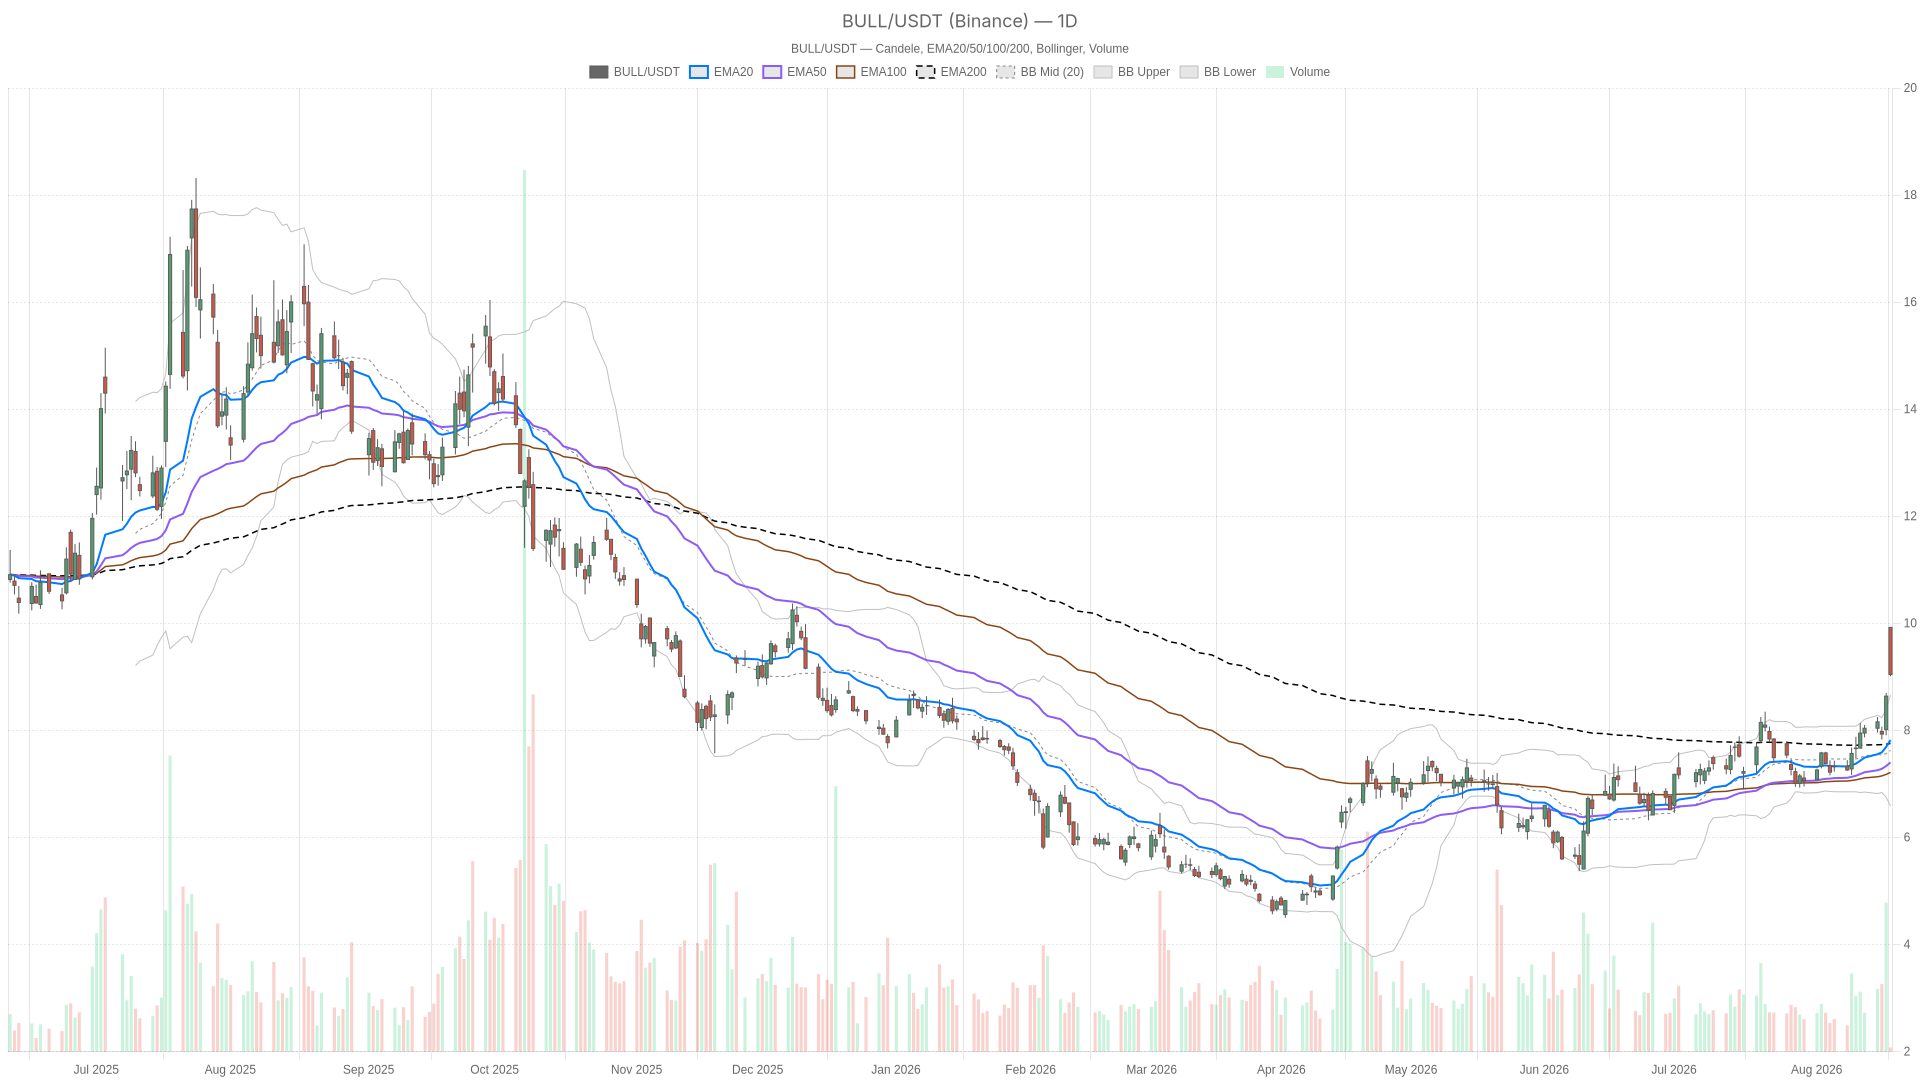
On the daily chart, the session opened at $9.93 and printed a high at the same level. It then sold off to close at $9.04, just above the day’s low of $9.01. That is a meaningful rejection candle. Gaps driven by earnings often produce exactly this pattern: an initial euphoric spike followed by profit-taking once enthusiasm fades.
Meanwhile, the daily RSI14 sits at 71.84, firmly in overbought territory. The daily close at $9.04 sits above the Bollinger upper band of $8.66. The mid-band rests at $7.63 and the lower band at $6.59. Price trading outside its own volatility envelope is rarely sustainable in a straight line. It typically precedes either consolidation or a pullback toward the mid-band.
Still, the daily MACD line at 0.33 remains above its signal at 0.19, with a positive histogram of 0.14. This confirms that bullish momentum is technically intact even after the intraday reversal. However, the daily regime read is tagged neutral rather than bullish, which is notable. That classification likely reflects the session’s failure to hold its highs, even as underlying indicators still lean constructive.
EMAs on the daily add another layer. The 20-period EMA sits at $7.82, the 50-period at $7.40, and the 200-period at $7.76. Price at $9.04 is comfortably above all three, supporting the broader uptrend structure. In contrast, the daily pivot point sits at $9.33, with resistance R1 at $9.64 and support S1 at $8.73. Closing below the pivot signals that sellers regained control into the close. Yet the multi-week trend remains upward. The daily ATR14 stands at 0.41, underscoring the volatility of the earnings reaction.
1-Hour Chart: Bullish Structure, Stretched Momentum
Turning to the 1-hour chart, the picture is more decisively bullish on the surface. The regime is explicitly tagged bullish, and the EMA stack is fully aligned. The 20-period EMA at $8.32, the 50-period at $8.03, and the 200-period at $7.60 all rise in the correct bullish order. They sit beneath the current price of $9.07. The H1 MACD line at 0.22 versus a signal of 0.14 confirms upward momentum, with a histogram of 0.07.
Yet the H1 RSI14 reads 82.44, an extremely overbought level that typically warns of exhaustion rather than continuation. At the same time, price at $9.07 trades above the H1 Bollinger upper band of $8.84, mirroring the daily extension. The H1 pivot point sits at $9.34, with resistance at $9.66 and support at $8.75. Price currently sits below that pivot, echoing the same below-pivot dynamic seen on the daily. So while the 1-hour trend structure confirms the bullish bias, its momentum readings suggest the move is stretched and vulnerable to a near-term cooling-off.
15-Minute Chart: Cooling Momentum, Execution Context
The 15-minute chart offers useful execution context rather than a directional signal. RSI14 has already eased back to 60.18, well off the extreme overbought readings seen on the higher timeframes. This suggests some of the intraday pressure has already been released. The 15m regime remains bullish. EMA20 at $8.78, EMA50 at $8.47, and EMA200 at $8.01 all sit beneath the current price of $9.07.
Notably, the 15m pivot point sits at $9.17, with resistance at $9.33 and support at $8.92. Price is currently trading below the pivot and just above intraday support. This zone is worth watching for short-term stabilization.
Timeframe Synthesis: Agreement on Direction, Disagreement on Timing
Putting the timeframes together, the daily trend remains constructive but shows clear signs of exhaustion after the earnings gap. The 1-hour chart confirms the bullish structure while simultaneously flashing an extremely overbought warning. Meanwhile, the 15-minute chart shows momentum cooling from its peak, consistent with a market digesting a large move rather than reversing outright. Overall, this is a case of timeframes broadly agreeing on direction but disagreeing on timing and risk.
Bullish and Bearish Scenarios for Webull Corporation Stock
Webull Corporation stock’s path forward hinges on whether buyers can reclaim key pivot levels or whether overbought conditions trigger a deeper reset. Both scenarios have credible technical and fundamental underpinnings.
Bullish Scenario
On the upside, a bullish outcome for BULL stock would build on the fundamental backdrop. Record revenue growth, the PDT rule tailwind, and rising trading volumes give the rally a genuine narrative beyond pure technical positioning. For the bullish case to gain traction technically, price would need to reclaim the daily and H1 pivot points near $9.33–$9.34 and hold above them. A push back toward the daily R1 at $9.64 or the H1 R1 at $9.66 would confirm buyers are back in control. That would suggest the earlier pullback was simply a shakeout rather than a top.
Corrective Scenario
The bearish, or at least corrective, scenario centers on overbought readings across the daily and hourly charts combined with the rejection candle already printed. If price fails to reclaim the pivot zone, the case for a deeper retracement strengthens. A break below the daily S1 at $8.73 or the 15m S1 at $8.92 would reinforce that scenario. In that context, a move back toward the daily EMA20 at $7.82 would not be surprising. The Bollinger mid-band at $7.63 could also come into play, given how far price has stretched above its own averages. Such a pullback would not necessarily invalidate the broader uptrend, since price would still sit above the daily EMA200 at $7.76. However, it would materially cool the current overbought condition.
Outlook
Overall, Webull Corporation stock finds itself at an interesting inflection point. The earnings story is genuinely strong, and the underlying trend across the daily and hourly timeframes still leans bullish. However, several factors argue for caution in the immediate term. The daily candle was rejected. RSI14 sits above 70 on the daily and above 80 on the hourly. Price also sits outside its Bollinger bands on both timeframes. Volatility is elevated, as the daily ATR14 of 0.41 makes clear. Positioning around the pivot levels will likely determine the next move. Either continuation higher follows, or a healthy reset unfolds before the next leg. Either way, near-term price action should be treated with the uncertainty that typically follows a large earnings-driven gap.
FAQ
Is Webull Corporation stock overbought after its Q2 2026 earnings beat?
Yes, Webull Corporation stock shows clear overbought signals on multiple timeframes. The daily RSI14 sits at 71.84 and the hourly RSI14 reads 82.44, both in overbought territory. Additionally, price trades above the upper Bollinger band on both the daily and 1-hour charts, suggesting the post-earnings move is stretched.
What are the key support levels to watch for BULL stock?
The most immediate support sits at the daily S1 pivot of $8.73 and the 15-minute S1 at $8.92. Below that, the daily EMA20 at $7.82 and the Bollinger mid-band at $7.63 represent deeper support zones that could come into play during a pullback. The daily EMA200 at $7.76 provides a longer-term trend floor.
What drove Webull Corporation’s record Q2 2026 revenue?
Webull posted record quarterly revenue of $198.8 million, driven by a 66% surge in trading-related revenue to $147.7 million. Management attributed the strong trading volumes partly to the elimination of the Pattern Day Trader rule, which they described as a genuine turning point for the business.
Can Webull Corporation stock continue higher after its post-earnings pullback?
The bullish case for Webull Corporation stock requires price to reclaim and hold above the pivot zone at $9.33–$9.34. A push above the daily R1 at $9.64 or the H1 R1 at $9.66 would confirm renewed buyer control. However, failure to reclaim these levels and a break below $8.73 would favor a deeper retracement scenario instead.
Disclaimer: This article is for informational purposes only and does not constitute financial advice, an investment recommendation, or a solicitation to buy or sell any financial instrument or cryptocurrency. The analysis provided is not indicative of future results. Investing in crypto assets and financial markets carries a high risk of capital loss. Always do your own research (DYOR) and consult a qualified financial advisor before making any decision.
Article produced with the assistance of artificial intelligence and reviewed by the editorial team.
