




As of August 6, 2026, Biconomy crypto sits at a crossroads where daily and intraday charts tell conflicting stories. The daily tape shows a token stretched on momentum, while shorter timeframes still look constructive — forcing traders to choose between chasing strength or respecting an overextended chart.
Summary
Key takeaways
- BICO’s daily RSI14 stands at 85.2, deep in overbought territory, while the 1-hour structure remains technically bullish
- The 0.03 support and 0.04 resistance zone serves as the critical pivot across both daily and hourly timeframes
- Bitcoin dominance at 56.6% and a Fear & Greed Index of 25 (Extreme Fear) create a risk-averse macro backdrop
- Narrow Bollinger Bands on the 1-hour chart suggest an imminent volatility expansion or consolidation phase
- Total crypto market cap sits at approximately $2.284 trillion, essentially flat over 24 hours
Daily Chart: Overbought, Yet the Regime Reading Says Neutral
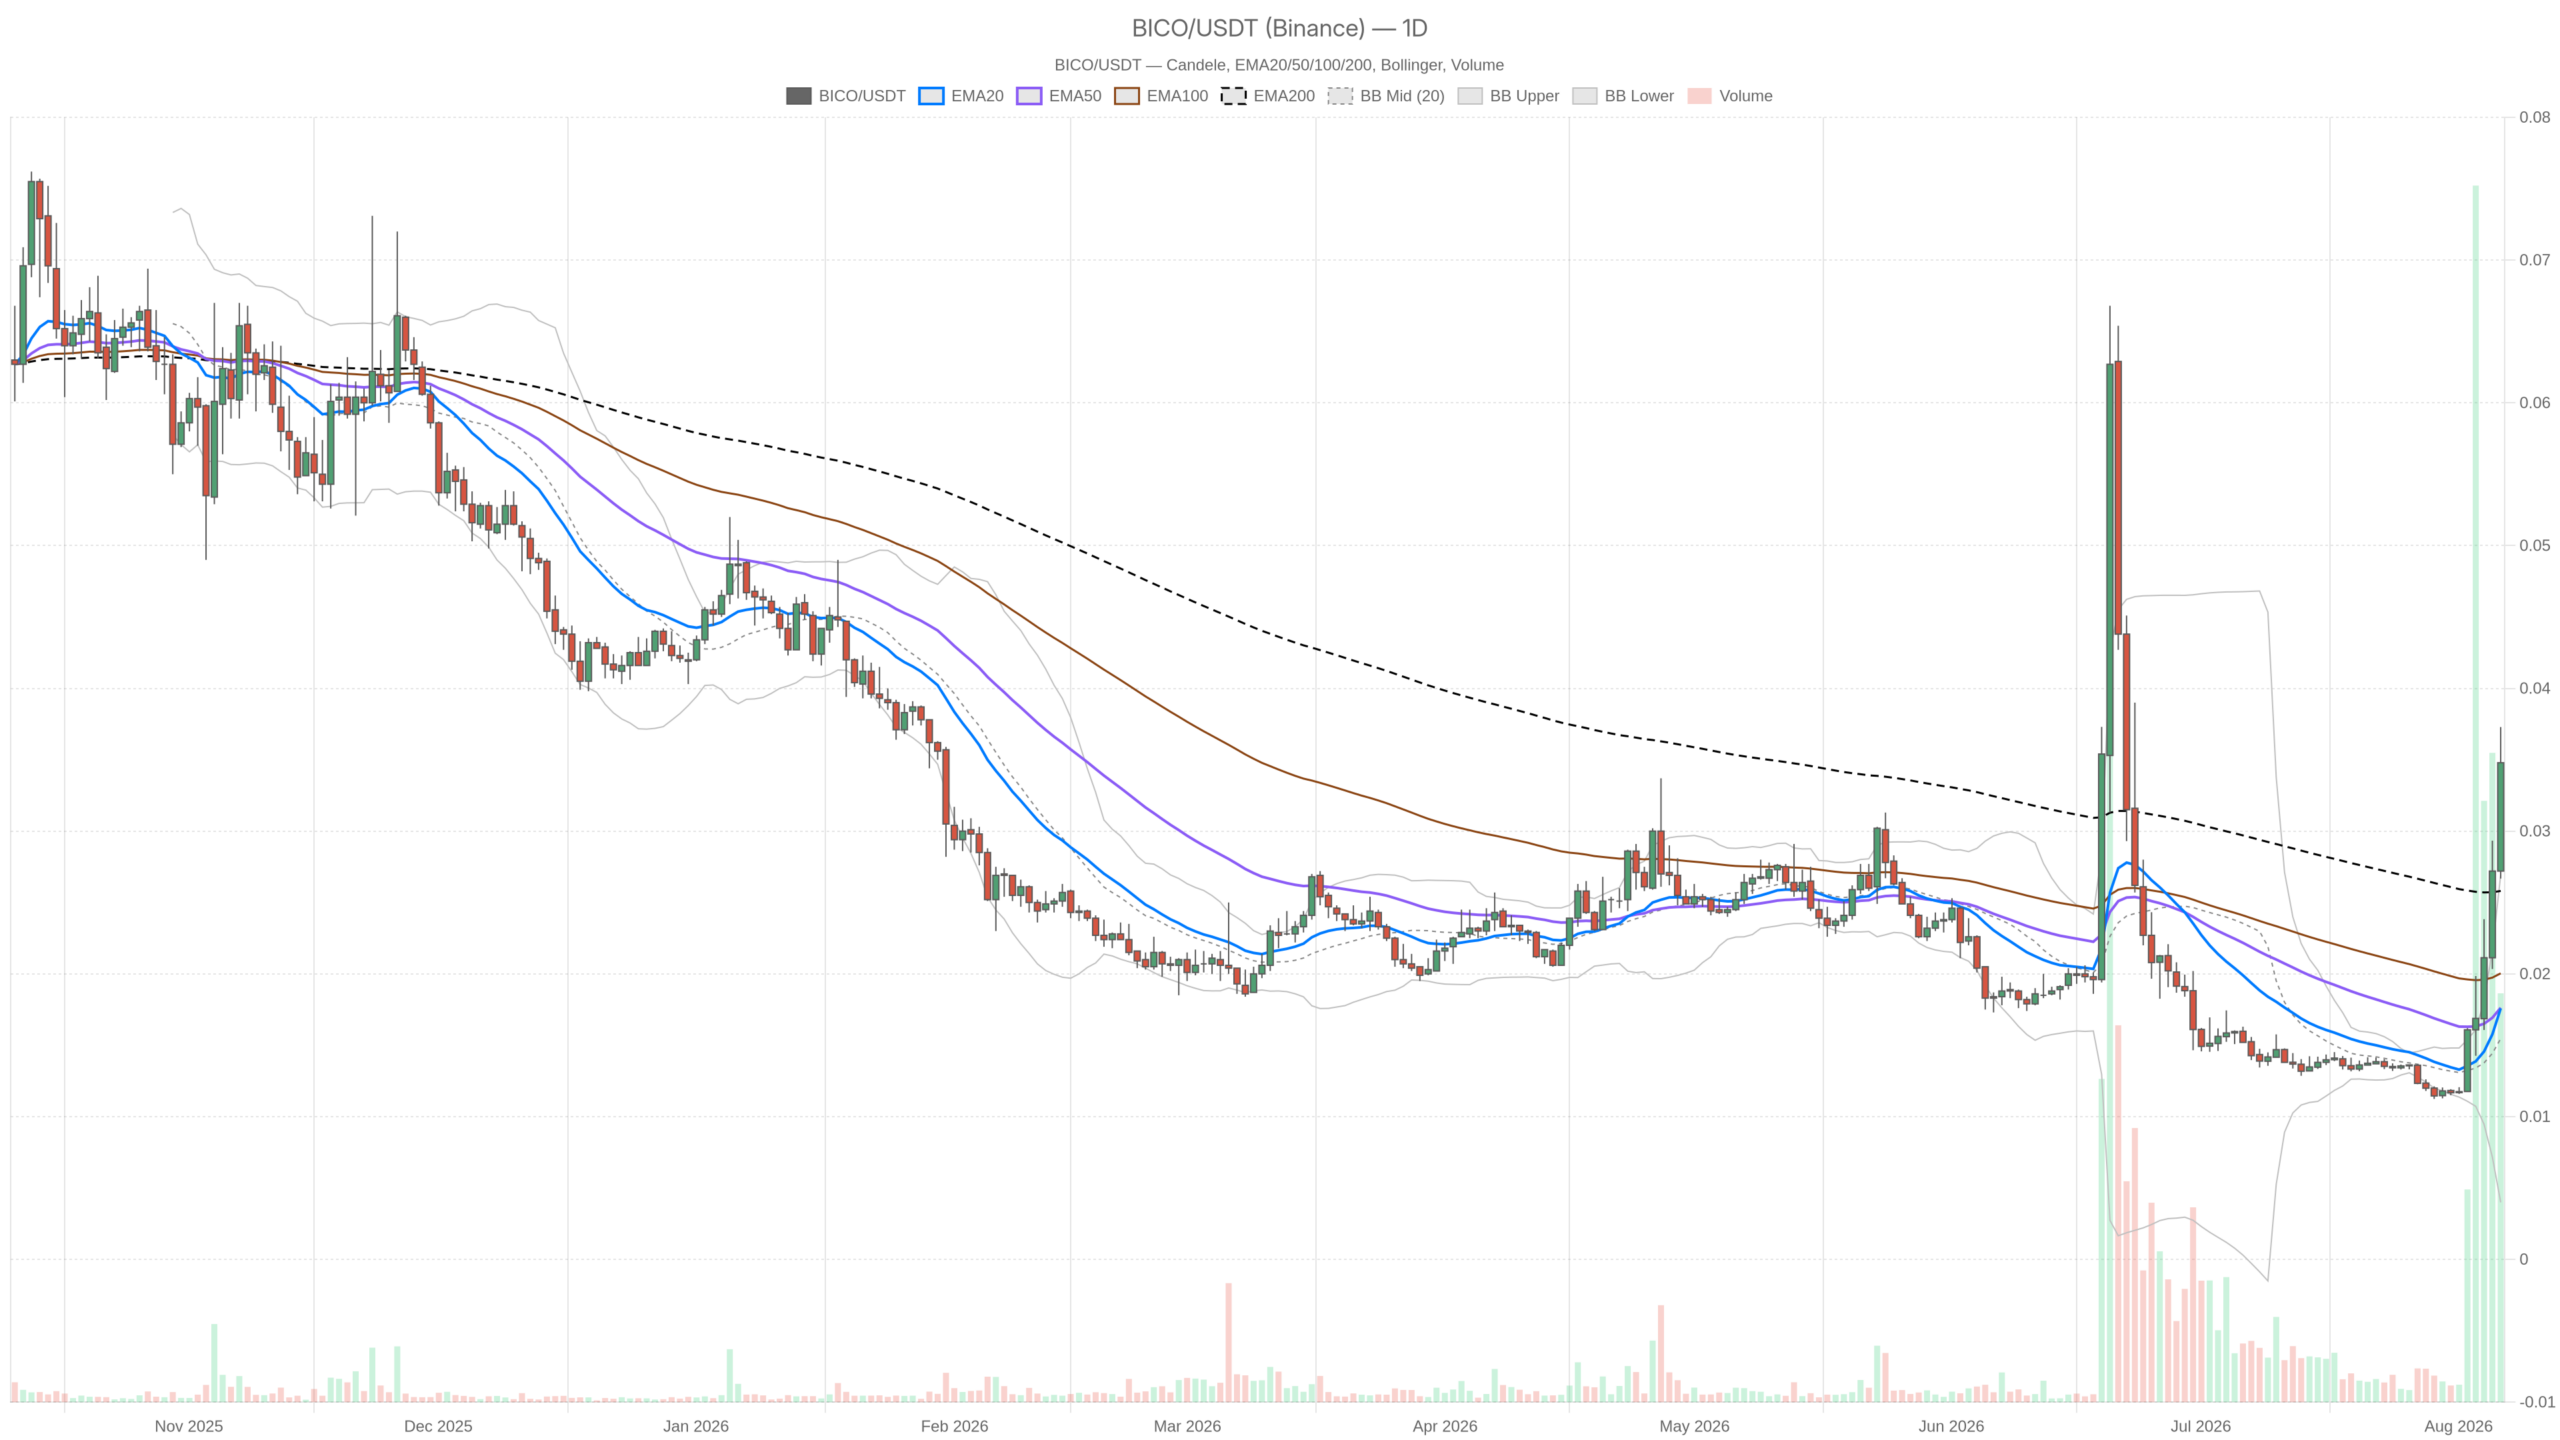
On the daily timeframe, BICO closed at 0.03, sitting right at its EMA200 (0.03). Meanwhile, the EMA20 and EMA50 both sit lower at 0.02. This unusual structural mix — price testing its long-term average from above while short-term averages lag behind — typically appears after a sharp, fast move rather than a slow grind higher.
Moreover, the daily RSI14 is printing 85.2, deep into overbought territory. That is the kind of reading that usually accompanies a parabolic push rather than a sustainable trend. The Bollinger Bands reinforce this view: mid-band at 0.02, upper band at 0.03, lower band effectively at zero. Price pinned against the upper band confirms the move has been aggressive and, statistically, is due for either a pause or a pullback toward the mean.
Despite all this, the system’s own regime classification on the daily timeframe still reads neutral. It is a reminder that an extreme RSI reading alone does not automatically flip the macro trend definition. However, it does raise the stakes for what comes next. Daily pivot levels put the pivot point at 0.03, resistance (R1) at 0.04, and support (S1) at 0.03 — a tight band where the first break is likely to dictate the next directional move.
1-Hour Chart: Bullish Regime, but Momentum Is Cooling
The 1-hour timeframe offers a more constructive picture. Price at 0.03 sits above both the EMA20 and EMA50 (0.03) and comfortably above the EMA200 (0.02). The system flags this timeframe as bullish, presenting the kind of clean, ordered EMA stack that trend-followers typically favour.
That said, RSI14 on the 1-hour is at 70.13, still overbought but noticeably cooler than the daily’s 85.2. That gap between daily and hourly RSI is worth sitting with: it suggests the extreme move originated on a longer timeframe and the hourly chart has not fully caught up to that exhaustion yet. Momentum here remains strong, but it is not as stretched as the daily tape implies.
The Bollinger Bands on the 1-hour are notably narrow, with the mid-band at 0.03, upper at 0.03, and lower at 0.02. Price is hugging the upper band. Narrow bands after a strong move often precede either a volatility expansion or a consolidation period. Pivot levels here closely mirror the daily setup — pivot at 0.04, resistance at 0.04, support at 0.03 — reinforcing that 0.04 is the level the market needs to clear for continuation.
15-Minute Chart: Consolidation, Not Conviction
However, zooming into the 15-minute chart, the picture flattens out considerably. The EMA20, EMA50, and EMA200 are all converged at 0.03, with no meaningful separation between short and long averages. This configuration typically signals a market in a holding pattern rather than actively trending. RSI14 at 67.07 remains elevated but not alarming, and the regime still reads bullish — though it is a softer bullish than what the 1-hour displays.
The Bollinger Bands show the mid-band at 0.03, upper at 0.04, and lower at 0.03, with price sitting in the lower half of a band that is actually slightly wider than the hourly’s. This hints at a short-term cooling-off period. For execution purposes, this timeframe is not signalling urgency. It looks more like the market is pausing to digest the earlier move before committing to a clear direction.
Across all three timeframes, MACD readings come back essentially flat. Line, signal, and histogram all hover near zero, offering no clear directional trigger. It is not bearish, and it is not bullish — just quiet. That quietness matters because it means the RSI and Bollinger Band signals are currently doing the heavy lifting, not momentum confirmation.
The Macro Backdrop: Extreme Fear Meets a Flat Market
Context matters here. Total crypto market capitalization sits around $2.284 trillion with a 24-hour change of essentially +0.03%, according to CoinGecko-derived figures. That is about as flat as the broader market gets. Bitcoin dominance near 56.6% signals that capital is not chasing altcoin beta right now.
Layer on a Fear & Greed reading of 25, squarely in Extreme Fear territory, and you get a market that is risk-averse by default. In that kind of environment, a token stretched to an 85 RSI on the daily chart is effectively swimming against the tide of overall sentiment — even if its own short-term structure looks intact.
There is also noteworthy dispersion on the DeFi side. Uniswap V3 fees jumped 58.96% in a day and are up 35.13% over 30 days, while Fluid DEX surged 65.19% daily. Meanwhile, Curve DEX fees dropped 40.55% in the same period. That is not a uniform narrative — it is rotation between protocols. For a Web3 infrastructure name like Biconomy, that fragmented on-chain activity provides context rather than a direct catalyst, but it underlines that capital is selective right now.
Bullish Scenario
The case for upside continuation rests on the 1-hour structure holding. If BICO stays above the 0.03 support zone and the EMA20/EMA50 alignment on the hourly remains intact, a clean break and hold above the 0.04 resistance — which aligns as both the daily and hourly R1 — would offer the strongest confirmation available on this chart.
Ideally, that breakout would come with the daily RSI cooling from 85 without price actually breaking down. This would resolve the overbought condition through time rather than through a sharp drop. What would invalidate this case: a daily close back below the 0.03 pivot, or a loss of the EMA20/EMA50 stack on the 1-hour, would undercut the bullish argument entirely.
Bearish Scenario
The case for a pullback is built on that daily RSI of 85.2 combined with price sitting against the upper daily Bollinger Band — a classic overextension signature. If BICO loses the 0.03 support on both the daily and hourly timeframes simultaneously, that would flip the short-term bullish regime and open the door to a retracement toward the lower end of the daily Bollinger range.
Furthermore, the Extreme Fear reading of 25 in the broader market adds weight to this scenario. Risk-off sentiment tends to punish overextended moves faster and harder. What would invalidate this: a sustained hold above 0.04 with RSI easing toward the mid-60s without price actually breaking — that would suggest the overbought condition is resolving healthily rather than snapping sharply.
Where This Leaves Traders
Ultimately, this is a chart with real tension baked into it. A daily timeframe flashing exhaustion signals sits against an hourly and 15-minute structure that still looks orderly and bullish. Neither picture cancels the other out; they are operating on different clocks. That is precisely the kind of setup that punishes traders who focus on only one timeframe.
Meanwhile, the 0.03 support and 0.04 resistance zone does double duty across daily and hourly pivots, which makes it the level to watch rather than any single indicator in isolation. Volatility is compressed on the shorter timeframes, and compressed volatility after an overbought daily reading can resolve in either direction with speed. Combined with a market-wide Extreme Fear reading, the environment favours caution over conviction.
Anyone tracking Biconomy crypto right now should treat this as a two-sided setup. The bullish structure is real, but so is the overextension risk sitting right above it. How price behaves around the 0.03–0.04 band over the coming sessions will likely determine which force ultimately prevails.
FAQ
What does BICO’s daily RSI of 85.2 indicate for traders?
A daily RSI14 of 85.2 places BICO deep in overbought territory. Readings at this level typically accompany parabolic moves rather than sustainable trends. While the regime classification on the daily chart still reads neutral, such an extreme RSI statistically raises the probability of either a pause or a mean-reversion pullback in the near term.
Why is the 0.03–0.04 range critical for BICO?
The 0.03 level acts as both the daily pivot and support (S1), while 0.04 serves as resistance (R1) across both the daily and hourly timeframes. This overlap gives the zone heightened significance: whichever level breaks first is likely to dictate the next directional move, making it the primary focus for short-term traders.
How does the macro environment affect BICO’s short-term outlook?
With Bitcoin dominance near 56.6%, a Fear & Greed Index at 25 (Extreme Fear), and total crypto market cap essentially flat at $2.284 trillion, the broader market is risk-averse. In this environment, tokens showing overextended daily readings face headwinds, as capital is not rotating aggressively into altcoins and risk-off sentiment tends to punish stretched moves more severely.
Disclaimer: This article is for informational purposes only and does not constitute financial advice, an investment recommendation, or a solicitation to buy or sell any financial instrument or cryptocurrency. The analysis provided is not indicative of future results. Investing in crypto assets and financial markets carries a high risk of capital loss. Always do your own research (DYOR) and consult a qualified financial advisor before making any decision.
Article produced with the assistance of artificial intelligence and reviewed by the editorial team.
