




As of August 5, 2026, traders watching Hashflow crypto (HFT) face conflicting signals. The daily RSI has rocketed to 87.91 — normally screaming exhaustion — yet shorter-term charts remain structurally intact. That gap between a stretched daily oscillator and a calmer intraday tape is the tension to watch.
Summary
Key takeaways
- HFT’s daily RSI has spiked to 87.91, historically signaling exhaustion risk on the highest timeframe.
- The 1-hour chart maintains a bullish EMA alignment, with price above the 20, 50, and 200-period averages.
- The broader Fear & Greed Index sits at 27, reflecting persistent caution across the crypto market.
- DEX sector data shows mixed fee trends, with Fluid up 61.76% daily while Uniswap V3 weekly fees fell 38.79%.
Daily Chart: Overbought, But Structurally Unconfirmed
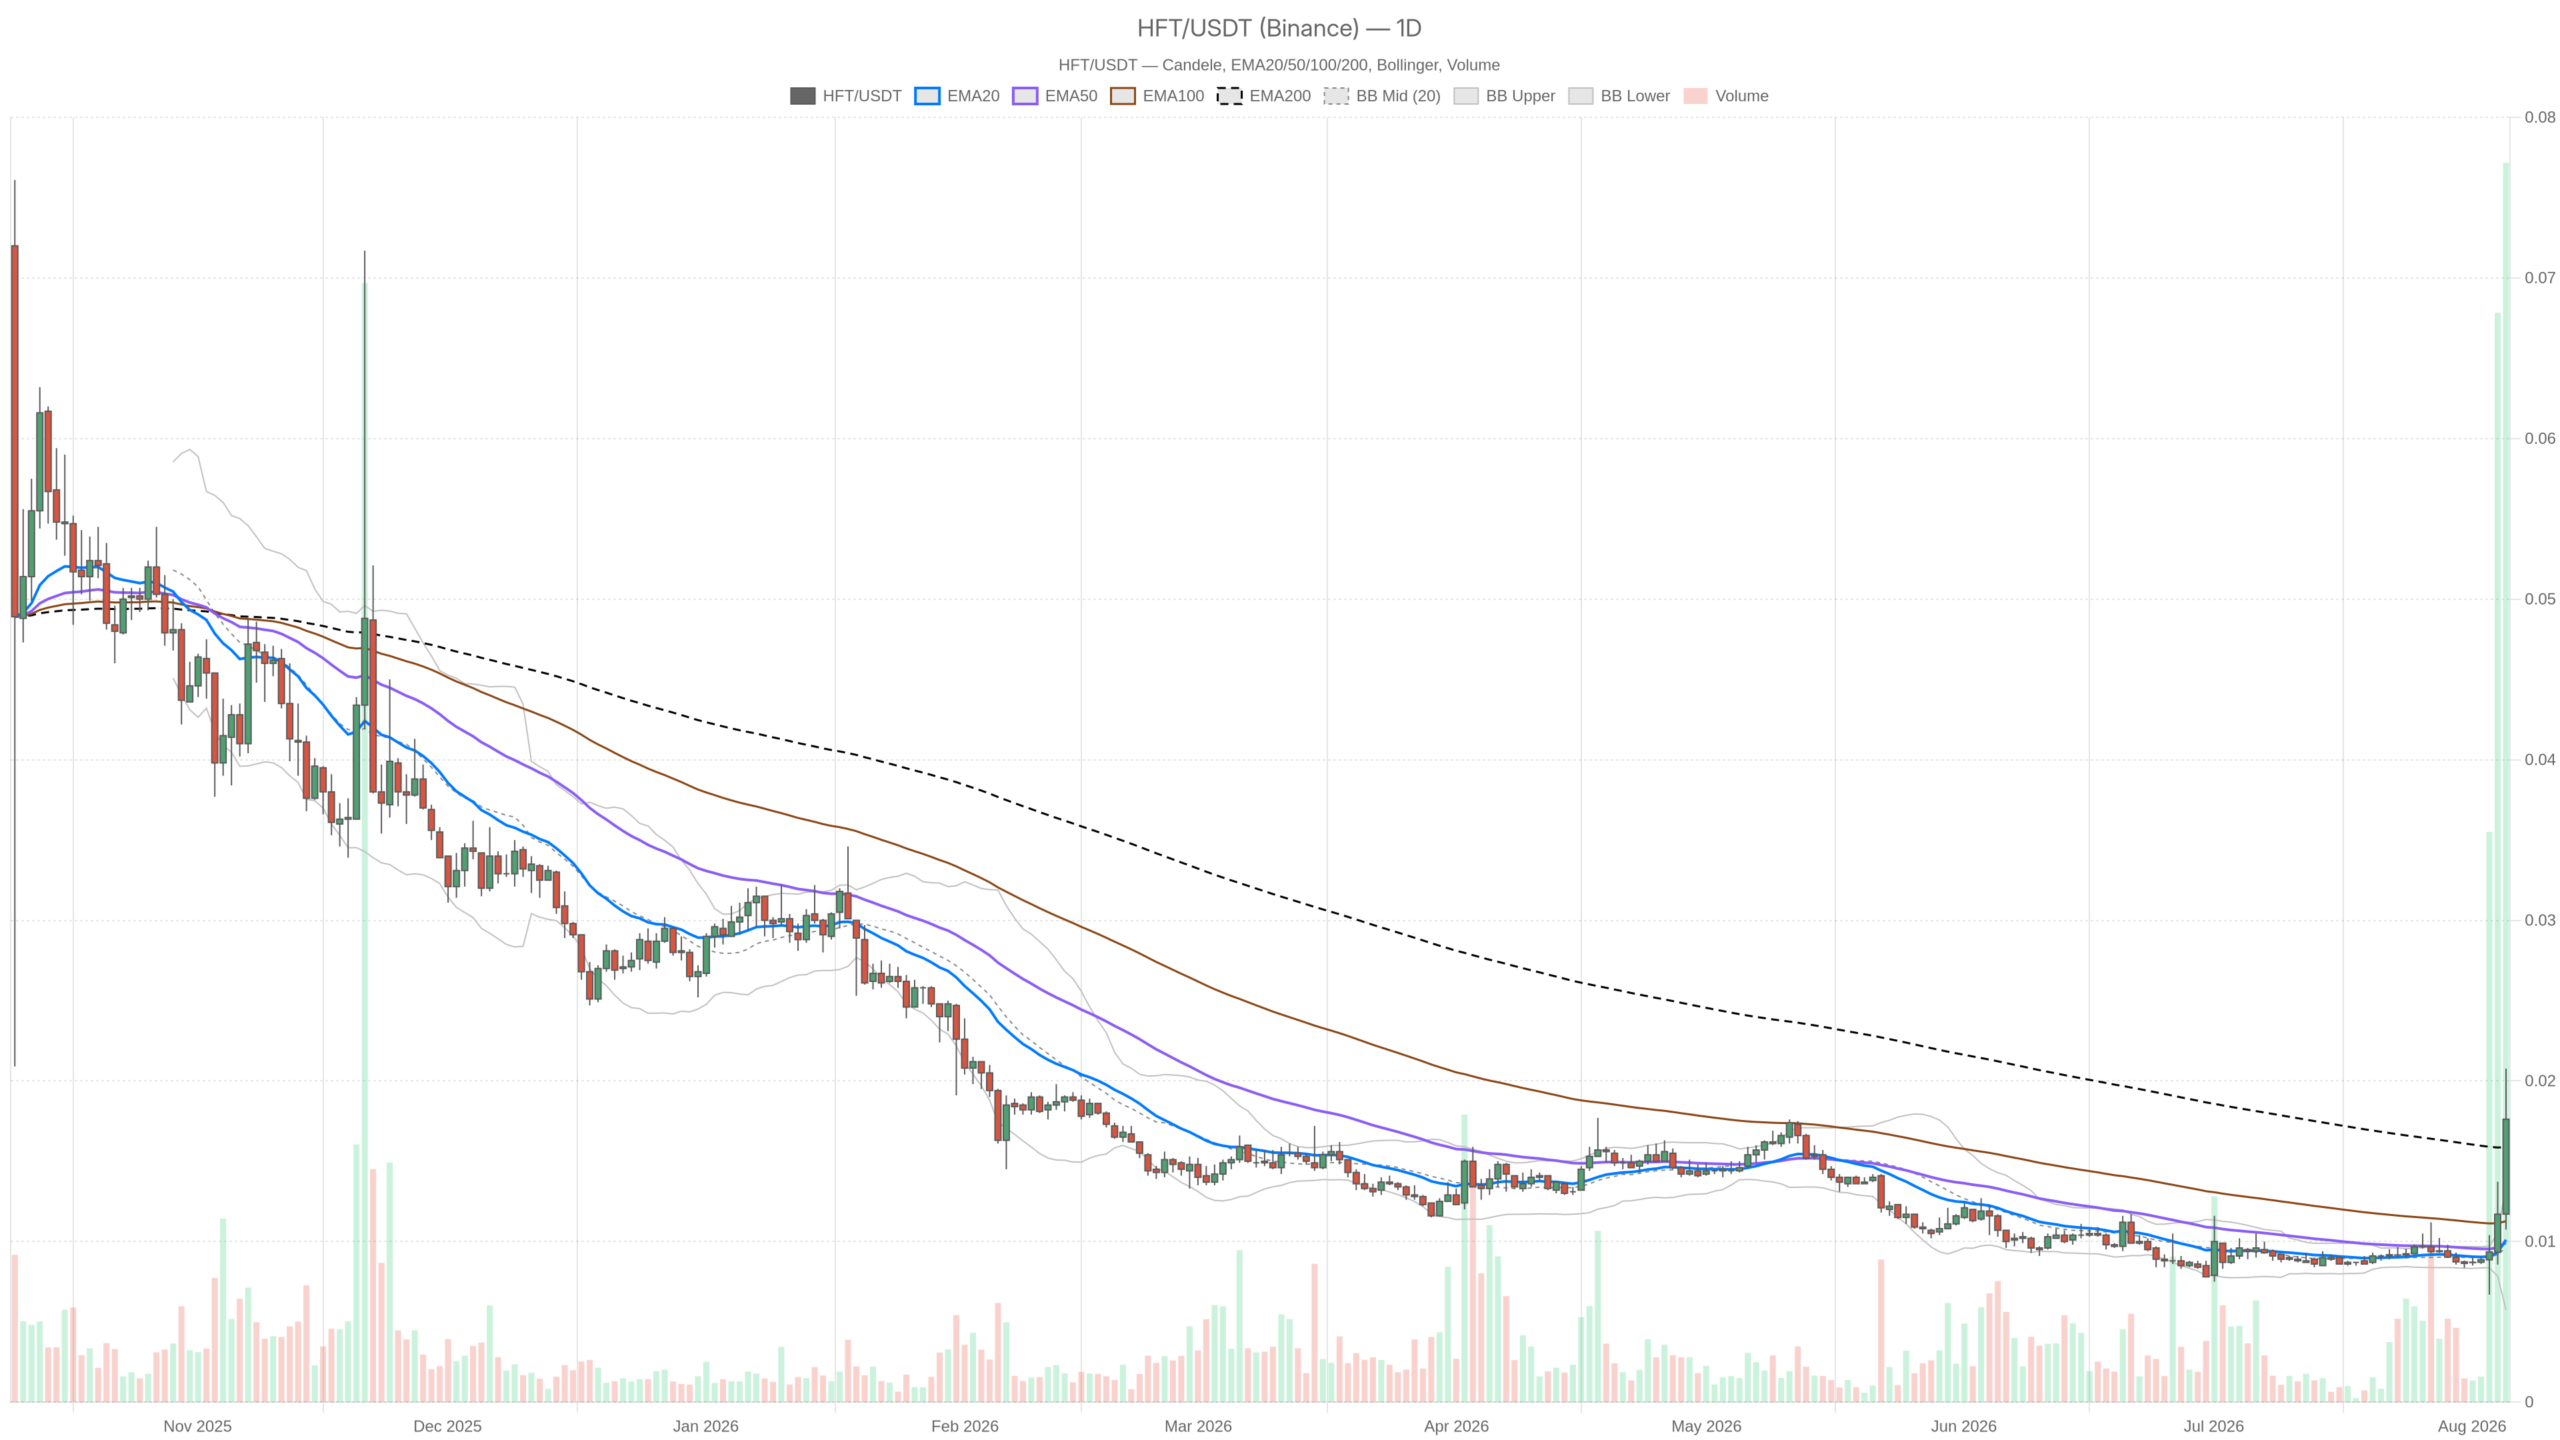
On the daily timeframe, HFT closed at $0.02, sitting above its 20-period and 50-period EMAs — both at $0.01 — but essentially in line with the 200-period EMA at $0.02. That is an unusual EMA stack: short-term averages lagging well below price while the long-term average has already caught up. It typically points to a sharp, fast move that has not given the shorter EMAs time to adjust.
The broader backdrop reinforces this tension. Total crypto market cap sits at roughly $2.28 trillion, up a modest 0.47% over 24 hours, while Bitcoin dominance commands 56.67% of total value, according to CoinGecko aggregate data. Meanwhile, the Fear & Greed Index is planted at 27, squarely in Fear territory. That combination — cautious sentiment under a token showing near-euphoric daily momentum — creates a signal traders cannot ignore.
The daily MACD line, signal, and histogram are all flat at zero, offering no fresh crossover signal — essentially neutral confirmation rather than a trigger. Bollinger Bands on the daily are also compressed, with the mid, upper, and lower bands clustered tightly around $0.01. This suggests the move followed a squeeze rather than emerging from an already-expanded range. Moreover, daily pivot levels place the pivot point at $0.02 with resistance R1 at $0.02 and support S1 down at $0.01. Price is therefore trading closer to resistance than support.
1-Hour Chart: Bullish Structure, Healthier Momentum
Zooming into the 1-hour chart changes the picture meaningfully. HFT’s close at $0.02 sits above a properly stacked EMA setup — EMA20 at $0.02, EMA50 at $0.01, EMA200 at $0.01 — the kind of alignment technicians want to see in a trending market. RSI at 64.45 is bullish but nowhere near exhaustion, offering a healthier read than the daily’s near-90 print.
The regime here is explicitly tagged bullish, and pivot levels show the pivot, R1, and S1 all converging around $0.02. This suggests price is consolidating tightly just under resistance rather than extending aggressively. However, this is precisely where the multi-timeframe tension becomes clear: the daily flashes overbought exhaustion risk, while the 1-hour confirms the underlying trend structure remains intact. Neither view cancels the other — they simply operate on different clocks.
15-Minute Chart: Momentum Cooling Into Consolidation
The 15-minute chart is where traders would look for execution timing, and right now it suggests a pause rather than a breakout. RSI has cooled to 53.47 — essentially neutral — with EMA20 and EMA50 both at $0.02, sitting above the EMA200 at $0.01. That creates a mildly bullish short-term structure. However, the flattening RSI shows momentum easing off rather than accelerating. Pivot, R1, and S1 are all bunched near $0.02, reinforcing a market that is digesting its recent move before committing to a direction.
Bullish and Bearish Scenarios for HFT
The bullish case for Hashflow crypto rests on the 1-hour and 15-minute bullish regimes holding while the daily RSI works off its overbought condition through time and sideways consolidation. If HFT can hold above the daily EMA20/EMA50 cluster near $0.01 and push through the $0.02 resistance zone flagged across all three pivot sets, that would suggest buyers are absorbing pressure rather than being trapped. This scenario would be invalidated if price loses the 1-hour bullish EMA stack, specifically breaking below the EMA50 near $0.01.
The bearish case leans on the daily RSI reading of 87.91 at face value. Extreme overbought conditions on the highest timeframe often precede at least a corrective pullback, especially with EMA20 and EMA50 sitting well below current price. If the 1-hour regime flips from bullish and RSI breaks down through the mid-50s, that would confirm daily exhaustion is translating into selling pressure. This view would be invalidated if intraday charts hold above their EMA20 lines, signaling the daily overbought reading is merely a lagging artifact of a strong trend.
Market Context Adds Another Layer
It is worth weighing HFT’s technical picture against the wider market. A Fear & Greed Index of 27 tells you most participants remain cautious, even as total market capitalization ticks up 0.47% and Bitcoin dominance holds above 56%. That is not a backdrop that typically rewards chasing overbought daily momentum on a smaller-cap token. Fearful markets tend to punish overextension quickly when sentiment shifts.
There is also relevant activity in the DEX sector where Hashflow operates. DefiLlama fee data shows a mixed picture: Fluid DEX fees jumped 61.76% in the past 24 hours, while Uniswap V3 fees fell 38.79% over the past week despite climbing 81.46% over 30 days. Curve DEX saw a sharp 59.63% daily fee drop. That volatility in DEX revenue trends suggests trading activity is rotating unevenly between platforms rather than expanding broadly — a detail worth noting given Hashflow’s positioning as a trade execution and liquidity aggregation protocol.
Where This Leaves Traders
The honest read on HFT right now is that the daily and intraday timeframes are telling different stories, and neither should be dismissed. The daily RSI at 87.91 is a legitimate warning sign that should not be waved away just because shorter-term structure looks fine. Extreme readings like that tend to resolve through either time-based consolidation or a sharper snapback. At the same time, the 1-hour bullish regime and cleaner EMA alignment mean the trend has not broken down yet. Treating the daily signal as an automatic sell trigger would be jumping ahead of actual price action.
Position sizing and risk management matter more than usual here, particularly with a Fear & Greed reading still stuck in cautious territory. Volatility around overbought extremes tends to cut both ways — sharp continuation moves and equally sharp reversals are both live possibilities until price actually breaks one of the key levels discussed. Watching whether the 1-hour structure holds or cracks over the next sessions will likely tell traders more than the daily RSI reading alone.
FAQ
What does an RSI of 87.91 mean for HFT?
An RSI reading of 87.91 on the daily chart signals that HFT is in deeply overbought territory. Values above 70 traditionally indicate overbought conditions, and a reading near 90 is a strong warning that the asset may be overextended. However, overbought RSI can persist in strong trends, and the 1-hour chart still shows bullish structure with an RSI of 64.45, suggesting the trend has not yet broken down.
What are the key levels to watch for HFT?
The critical resistance zone sits at $0.02, flagged across daily, 1-hour, and 15-minute pivot sets. On the support side, the daily EMA20 and EMA50 cluster near $0.01 represents the line in the sand. A break below this level, particularly the 1-hour EMA50, would confirm that daily exhaustion is translating into selling pressure.
How does the Fear & Greed Index affect HFT’s outlook?
The Fear & Greed Index at 27 reflects cautious sentiment across the broader crypto market. In fearful markets, overextended daily momentum on smaller-cap tokens tends to get punished quickly if sentiment shifts. This adds an extra layer of risk to HFT’s already overbought daily technical picture.
Disclaimer: This article is for informational purposes only and does not constitute financial advice, an investment recommendation, or a solicitation to buy or sell any financial instrument or cryptocurrency. The analysis provided is not indicative of future results. Investing in crypto assets and financial markets carries a high risk of capital loss. Always do your own research (DYOR) and consult a qualified financial advisor before making any decision.
Article produced with the assistance of artificial intelligence and reviewed by the editorial team.
