



Carvana stock closed at $66.32 on July 29, pinned near its daily pivot of $66.71. Despite blockbuster Q2 results, CVNA failed to sustain a breakout above resistance. The daily timeframe remains neutral, and that indecision is proving difficult to shake.
Summary
Key takeaways
- Carvana posted record Q2 results including $7.38 billion in revenue and $769 million adjusted EBITDA, yet shares faded from an intraday high of $69.41.
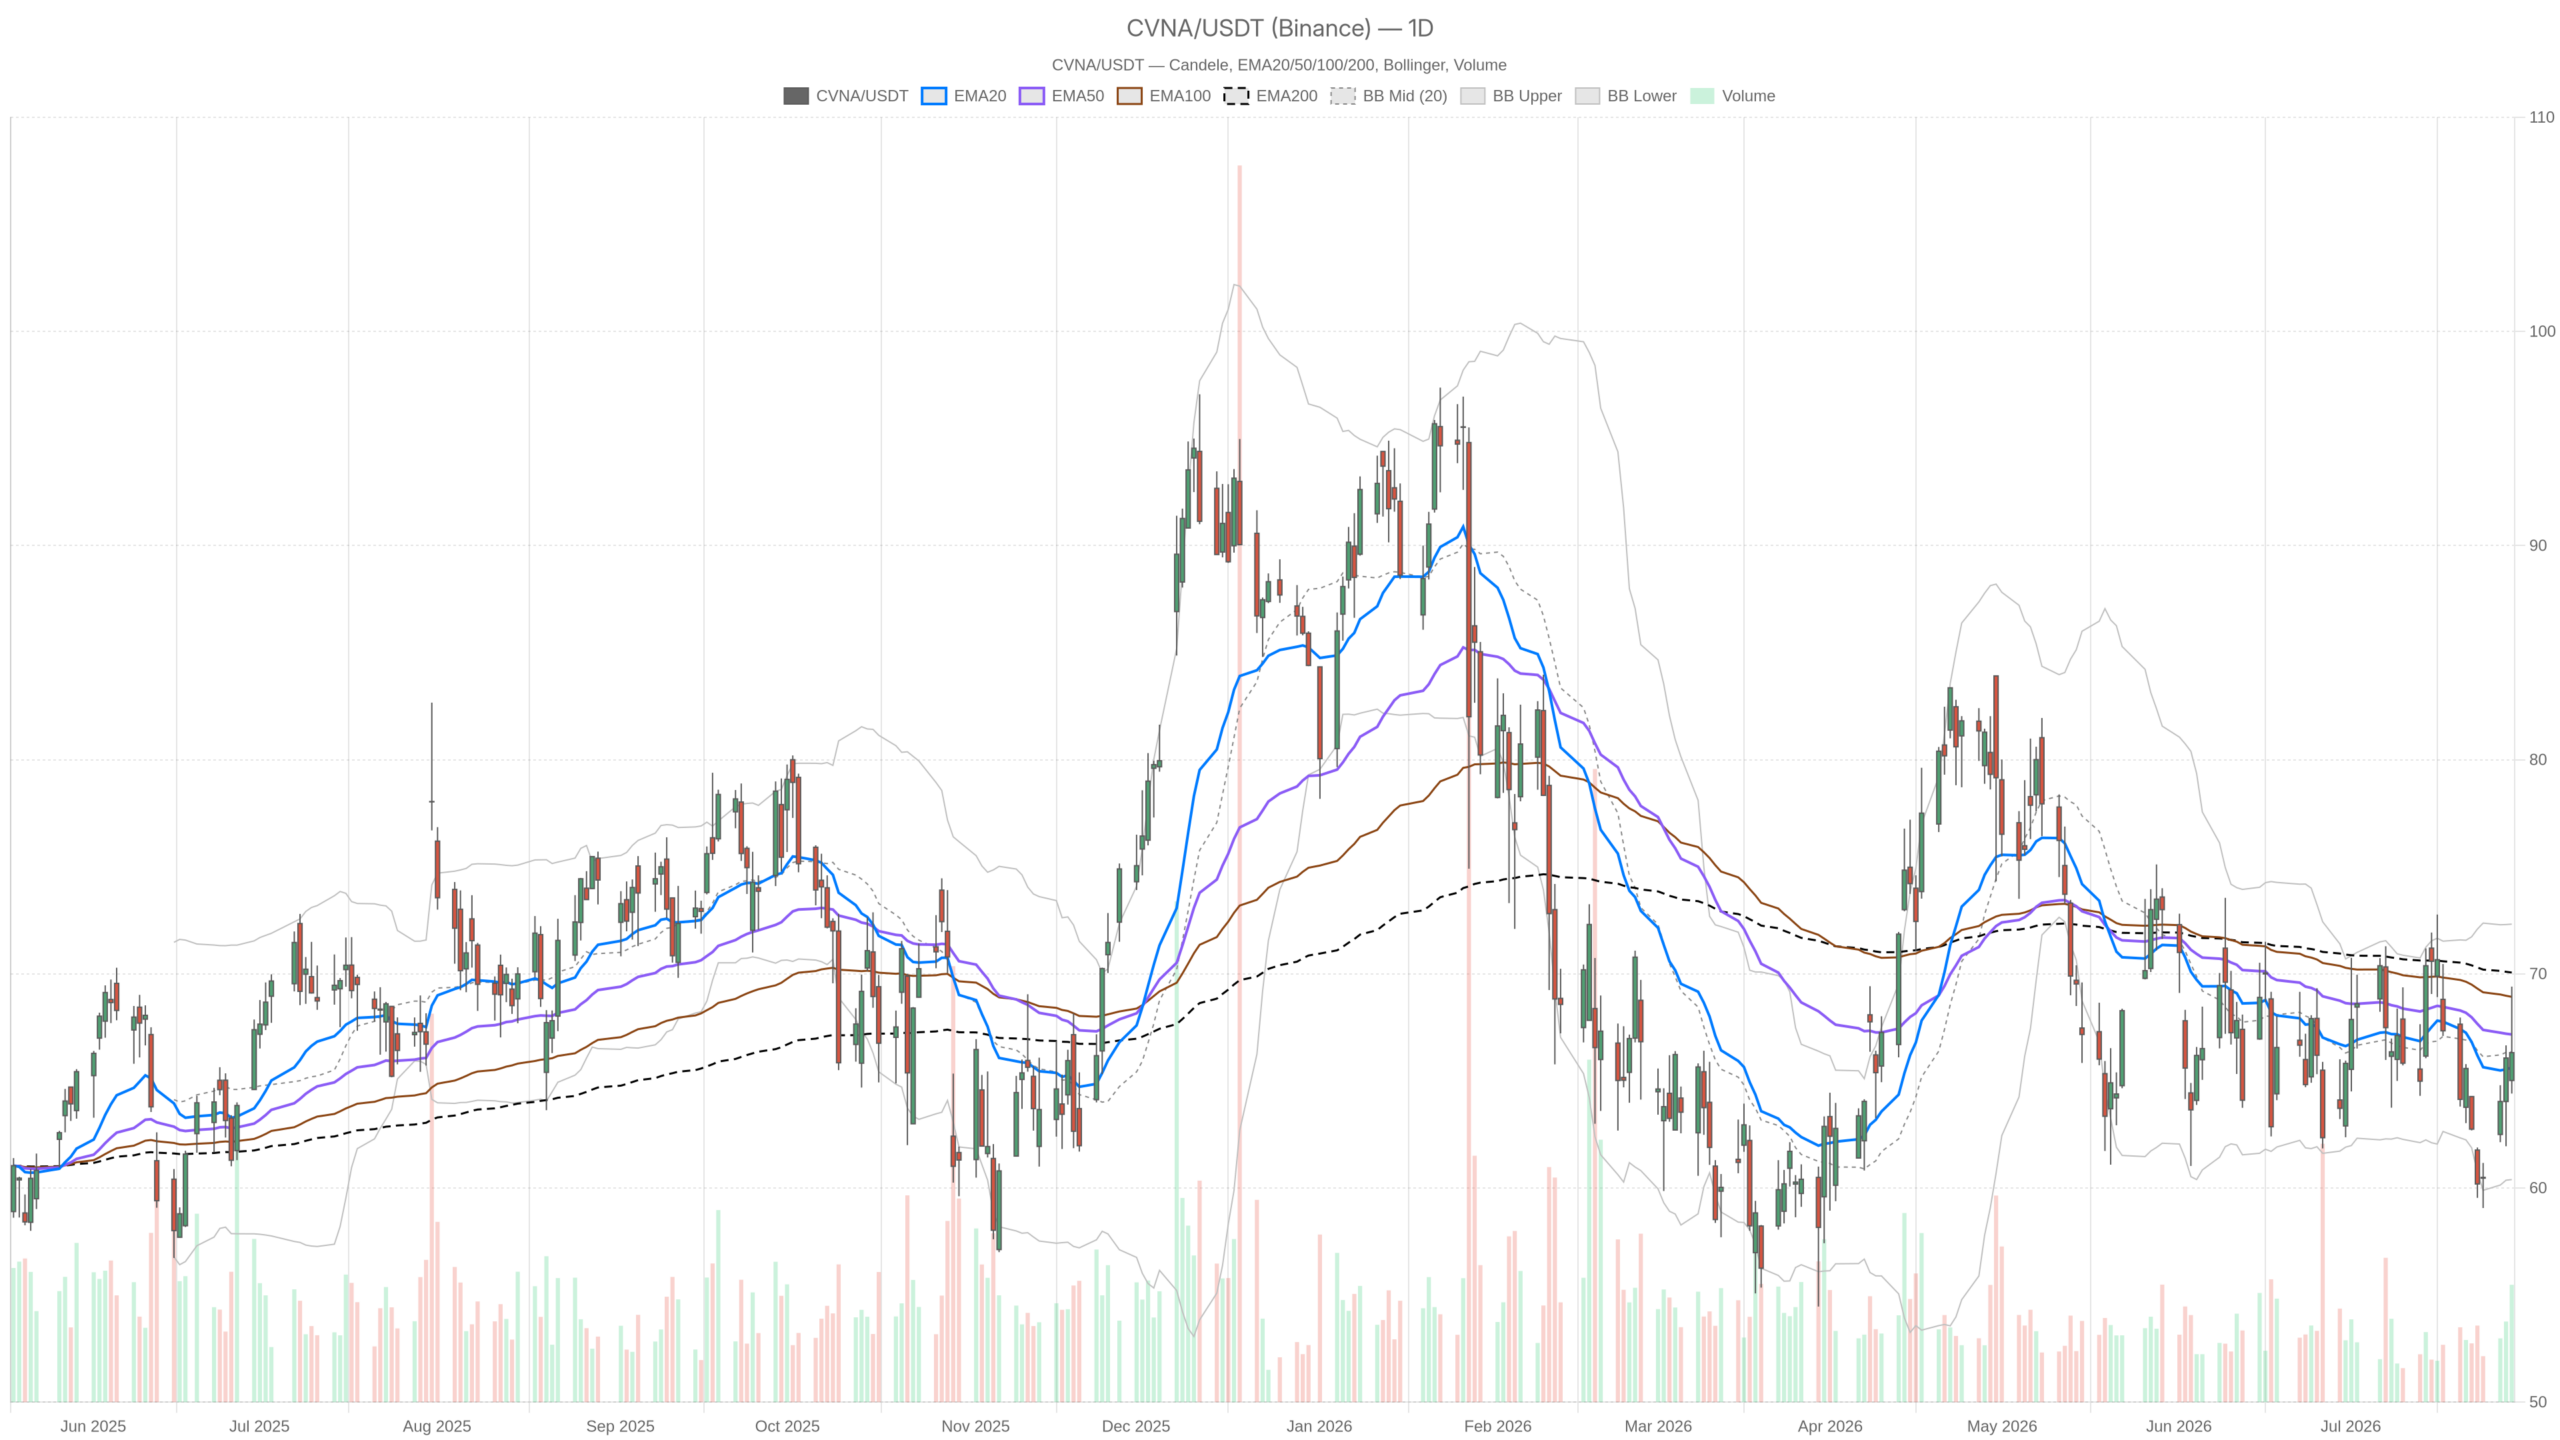
- The daily EMA stack remains bearish, with CVNA trading below both the EMA50 at $67.17 and EMA200 at $70.06.
- A sustained close above $67.17 is needed to challenge the bearish structure. Failure at $64.02 support opens the path toward $60.39.
- Short-term hourly momentum shows modest recovery, but the 15-minute chart reveals late-session selling pressure into the close.
- Volatility remains elevated with a daily ATR of $3.76, keeping Carvana stock capable of sharp moves in either direction.
Carvana’s Record Q2 Results Fail to Overcome Soft Guidance
Carvana delivered record second-quarter results by nearly every measure. Yet the stock failed to rally. Soft forward guidance overshadowed the quarterly beat.
Notably, retail unit sales rose 38% year over year to 197,325 vehicles. Revenue climbed 52% to $7.38 billion. Net income reached $513 million. Adjusted EBITDA hit a new high of $769 million. On the surface, these are exactly the numbers a growth investor wants to see.
However, the market’s reaction was notably muted. A soft full-year 2026 adjusted EBITDA guidance alongside a slip in gross profit overshadowed the quarterly beat. In fact, the post-earnings price action on July 29 tells that story clearly. An intraday high of $69.41 faded to close at $66.32. Strong results alone were not enough to sustain a breakout.
CVNA Daily Bias: Neutral With a Bearish Lean
The daily chart for Carvana stock is neutral in regime but bearish in structure. Price sits pinned below key moving averages. Momentum indicators offer no directional edge.
EMA Stack Signals Bearish Structure
The EMA stack is bearish. Notably, price trades below both the EMA50 at $67.17 and the EMA200 at $70.06. Only the EMA20 at $65.62 sits below the current close, offering mild near-term support. This configuration keeps the structural bias tilted to the downside.
Meanwhile, the MACD on the daily confirms the hesitation. The line sits at -0.91, barely below the signal at -0.84. This produces a histogram reading of just -0.06. The negative cross remains in place. However, the histogram compression suggests momentum is stalling rather than accelerating lower. This is not a trending sell signal. It is a market searching for direction.
Daily RSI at 50.56 reinforces that message. Sitting almost exactly at the midpoint, it offers no directional edge. At the same time, Bollinger Bands place the midline at $66.36, nearly identical to the close. The upper band at $72.32 and lower band at $60.39 define a wide range of uncertainty. ATR at $3.76 confirms that daily moves are volatile. An intraday swing of nearly five points, as seen on July 29, is well within normal parameters.
Pivot Levels Define the Battlefield
Key pivot levels on the daily frame set resistance at $69.01 and support at $64.02. The failed attempt to hold above $69 intraday was a direct rejection at that R1 level. In short, that rejection is the defining technical moment from the session.
The 1H Frame Adds Short-Term Optimism for Carvana Stock — With Caveats
The hourly chart shows modestly improving short-term momentum. Still, CVNA is struggling to clear its own hourly EMA200. That level now coincides precisely with the closing price.
On the hourly, the MACD line stands at 1.28 against a signal of 1.05, with a positive histogram of 0.23. This represents a genuine short-term momentum improvement. The 1H RSI at 57.57 leans bullish without being overbought. Both readings suggest buyers stepped in during the session.
However, the 1H EMA200 at $66.32 sits precisely at the close. Price is essentially flatlining at this important level. The EMA20 at $65.53 and EMA50 at $64.71 are both below price, which is constructive short term. Yet CVNA’s struggle to close above its own hourly EMA200 dampens enthusiasm considerably.
The 1H pivot structure adds further context. The pivot point sits at $66.79, just above the close of $66.31. Price failed to hold above the hourly pivot on the last candle, closing the session just below it. Resistance at R1 of $67.71 is the immediate ceiling. Support at $65.40 is the first meaningful floor.
Overall, the 1H frame adds nuance without resolving the conflict. Short-term momentum is recovering. However, it has not been strong enough to challenge the daily bearish EMA structure in any meaningful way.
15-Minute Context: Intraday Pressure Late in the Session
The 15-minute chart reveals clear late-session selling pressure. Price sits pinned at the lower Bollinger Band. Short-term momentum has turned negative.
Meanwhile, RSI at 42.5 is dipping toward oversold territory on this frame. The MACD histogram is negative at -0.24, with the line falling below the signal. Price on the 15m is sitting at the lower Bollinger Band of $66.31, effectively pinned at band support. The EMA20 at $67.46 sits above price, confirming the short-term downward drift into the close.
Therefore, this 15m deterioration carries weight. It came right after the intraday high near $69.41. Sellers clearly used the post-earnings pop to reduce exposure. For traders evaluating entry timing, the current 15m structure warrants caution on immediate long positions.
Bullish Scenario: What Would Drive Carvana Stock Higher
The bullish case for Carvana stock requires a sustained close above the daily EMA50 at $67.17. That would signal the first meaningful challenge to the bearish EMA structure.
Notably, the fundamental backdrop supports this scenario. Record revenue, record adjusted EBITDA, and accelerating unit sales provide a credible growth narrative. If the market recalibrates on the full-year guidance concern and refocuses on Q2 execution quality, CVNA could attract fresh buying interest.
Technically, a sustained close above $67.17 is the first hurdle. A follow-through toward $69.01 would then confirm renewed momentum. That level marks both the daily R1 and the July 29 intraday high. Beyond that, the daily EMA200 at $70.06 represents the larger structural target. A clean break above $70 would flip the daily bias toward bullish.
Bearish Scenario: Where the CVNA Bull Case Falls Apart
The bearish scenario centers on the guidance disappointment. If selling pressure continues, a break below $64.02 support would trigger a meaningful deterioration. The path would then open toward the lower Bollinger Band near $60.39.
Therefore, if the soft FY26 adjusted EBITDA outlook prompts continued selling, CVNA risks losing the post-earnings bounce entirely. A break below the $64.02 support level would place price well below all three EMAs. That would likely trigger fresh selling toward the lower Bollinger Band near $60.39.
At the same time, if the 1H MACD fades and turns negative while price fails to reclaim the daily EMA50, the short-term recovery signal evaporates. The 15m structure is already signaling intraday pressure. A deterioration in the hourly momentum picture would confirm that the earnings reaction is resolving to the downside.
Positioning Carvana Stock in Uncertainty
Carvana stock sits in an analytically uncomfortable place. Fundamentals delivered. Yet the technical structure remains bearish across the daily frame. Patience is required until key levels are resolved.
Still, the divergence between an outstanding Q2 report and a stock that closed below its daily pivot on earnings day is telling. It reflects the weight forward guidance carries in this market environment. Volatility remains elevated, with a daily ATR of $3.76 giving the stock room to swing meaningfully in either direction.
For now, the daily regime is neutral. The EMA stack leans bearish. The 1H recovery has not yet proven durable. Until CVNA can reclaim and hold above the $67.17 daily EMA50 on a closing basis, the technical bias remains cautious. Positioning here requires patience.
FAQ
Why did Carvana stock fail to rally after record Q2 earnings?
Carvana reported record results across nearly every metric — $7.38 billion in revenue, $769 million in adjusted EBITDA, and 38% unit sales growth. However, soft full-year 2026 adjusted EBITDA guidance and a slip in gross profit overshadowed the quarterly beat. The stock faded from an intraday high of $69.41 to close at $66.32, below its daily pivot.
What are the key technical levels to watch for Carvana stock?
The critical resistance level is the daily EMA50 at $67.17. A sustained close above it would challenge the bearish structure. The next target is $69.01, followed by the EMA200 at $70.06. On the downside, support sits at $64.02. A break below that opens the path toward the lower Bollinger Band near $60.39.
Is the current technical bias bullish or bearish for CVNA?
The daily bias is neutral with a bearish lean. Price trades below both the EMA50 and EMA200. The MACD remains in a negative cross. RSI at 50.56 offers no directional edge. However, momentum is compressing rather than accelerating lower, suggesting the market is searching for direction rather than trending decisively.
What would turn Carvana stock bullish?
A sustained close above the daily EMA50 at $67.17 would be the first meaningful signal. Confirmation would come with a follow-through above $69.01. A clean break above the EMA200 at $70.06 would flip the daily bias toward bullish and signal a structural trend change.
Disclaimer: This article is for informational purposes only and does not constitute financial advice, an investment recommendation, or a solicitation to buy or sell any financial instrument or cryptocurrency. The analysis provided is not indicative of future results. Investing in crypto assets and financial markets carries a high risk of capital loss. Always do your own research (DYOR) and consult a qualified financial advisor before making any decision.
Article produced with the assistance of artificial intelligence and reviewed by the editorial team.
